 4
4peptides
spectra
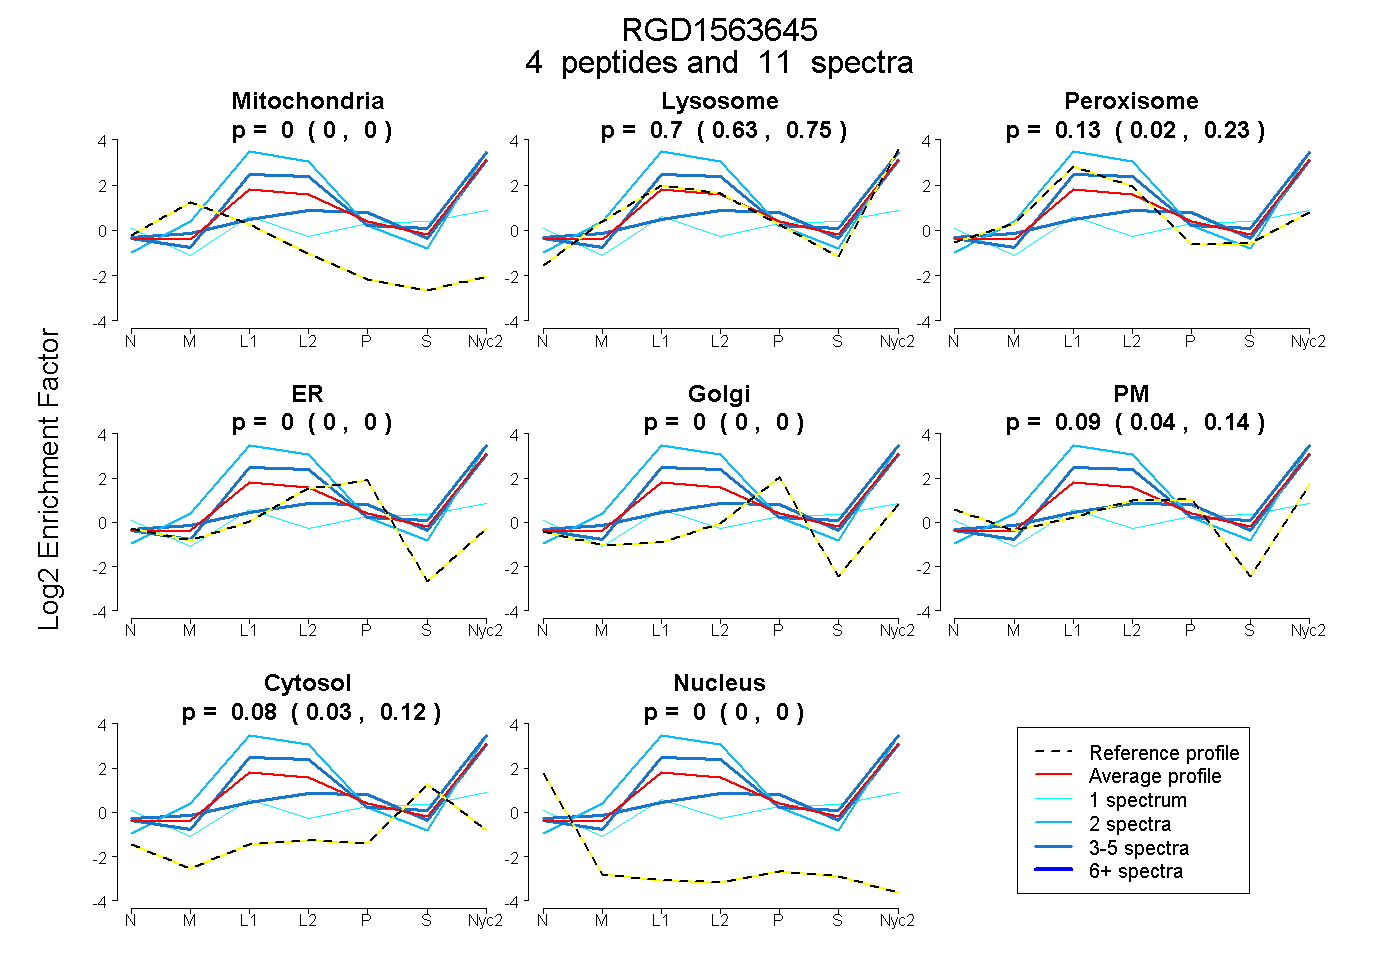
0.000 | 0.000
0.635 | 0.750
0.021 | 0.229
0.000 | 0.000
0.000 | 0.000
0.037 | 0.142
0.028 | 0.118
0.000 | 0.000
2peptides
spectra
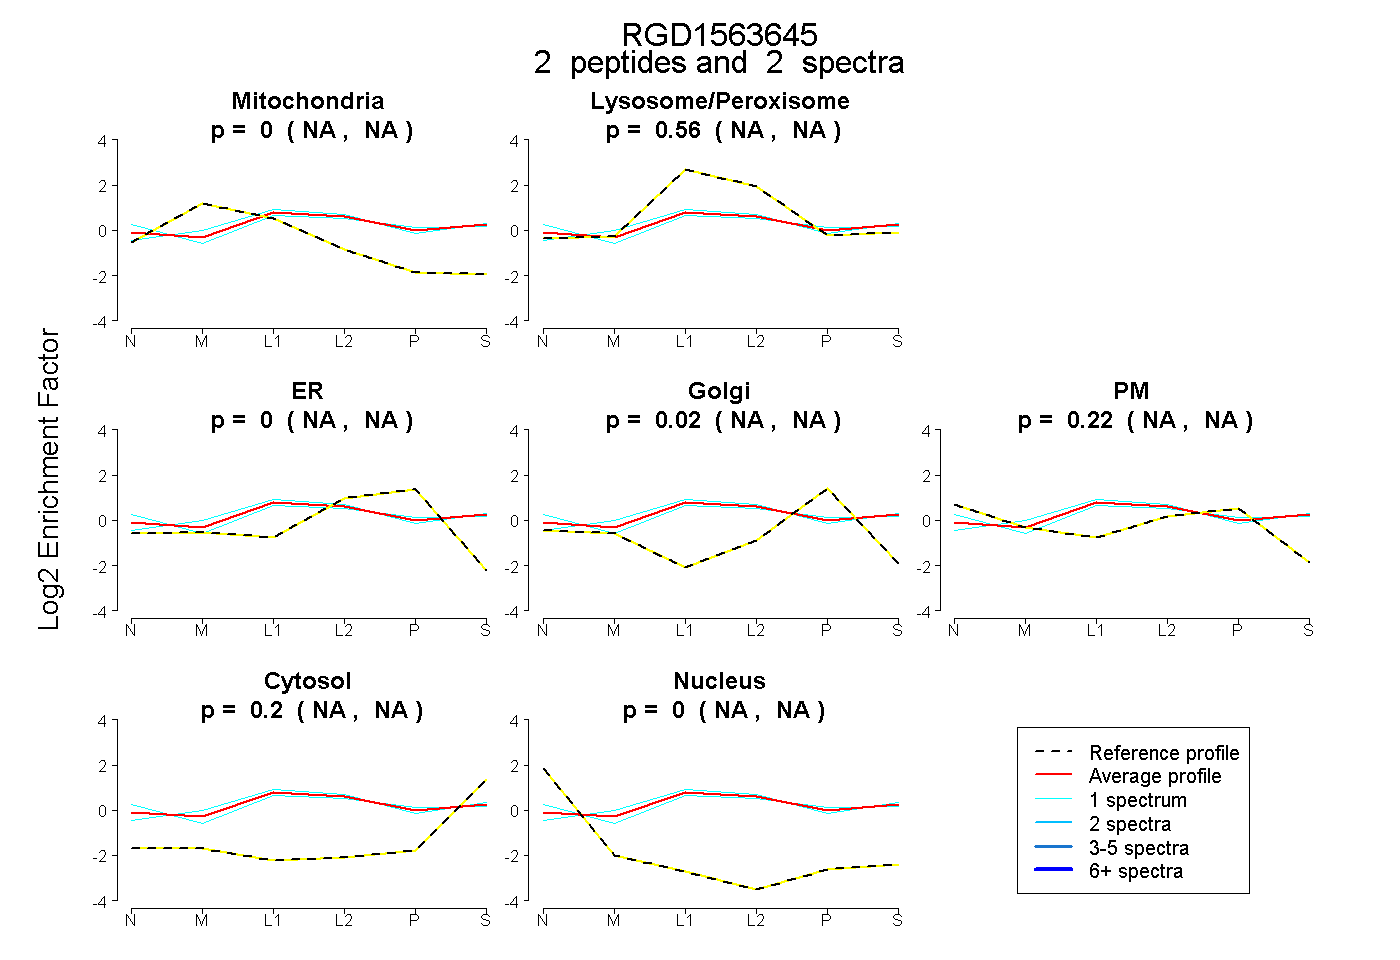
NA | NA
NA | NA
NA | NA
NA | NA
NA | NA
NA | NA
NA | NA
7peptides
spectra

0.000 | 0.000
1.000 | 1.000