 4
4peptides
spectra
0.000 | 0.000
0.635 | 0.750
0.021 | 0.229
0.000 | 0.000
0.000 | 0.000
0.037 | 0.142
0.028 | 0.118
0.000 | 0.000
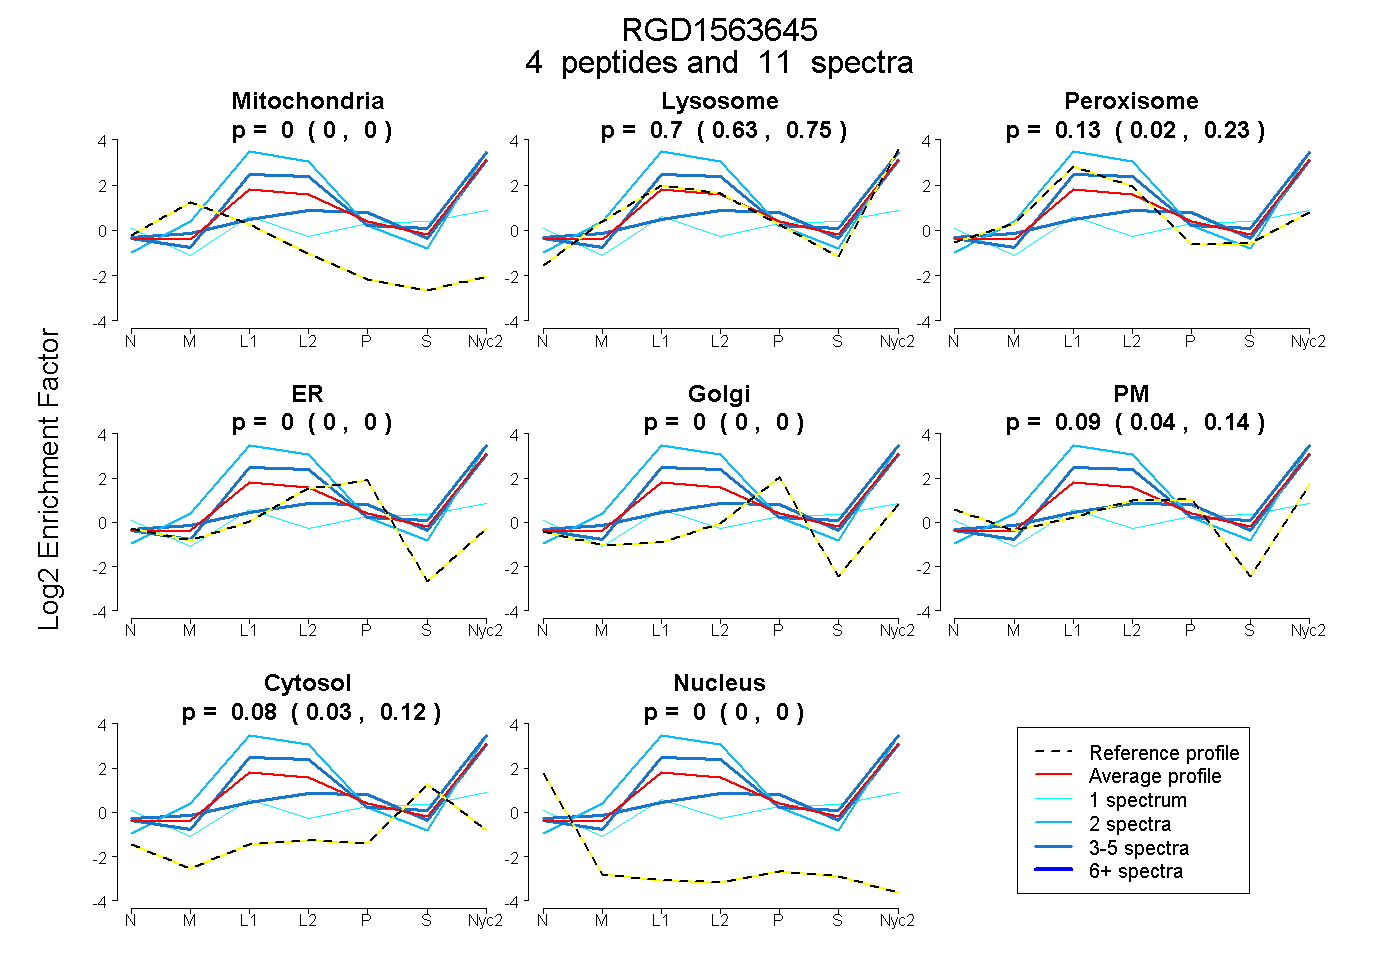
| Plot | Mito | Lyso | Perox | ER | Golgi | PM | Cytosol | Nucleus | |||||
| Expt A |
4 peptides |
11 spectra |
|
0.000 0.000 | 0.000 |
0.698 0.635 | 0.750 |
0.133 0.021 | 0.229 |
0.000 0.000 | 0.000 |
0.000 0.000 | 0.000 |
0.093 0.037 | 0.142 |
0.076 0.028 | 0.118 |
0.000 0.000 | 0.000 |
| 2 spectra, TFCGGFLVR | 0.000 | 0.742 | 0.258 | 0.000 | 0.000 | 0.000 | 0.000 | 0.000 | ||
| 3 spectra, SNDIMLLK | 0.000 | 0.547 | 0.000 | 0.000 | 0.000 | 0.315 | 0.138 | 0.000 | ||
| 5 spectra, TSAVRPLNLPR | 0.000 | 0.717 | 0.283 | 0.000 | 0.000 | 0.000 | 0.000 | 0.000 | ||
| 1 spectrum, ITPQGEFPNTLR | 0.000 | 0.062 | 0.209 | 0.000 | 0.000 | 0.316 | 0.412 | 0.000 |
| Plot | Mito | Lyso or Perox | ER | Golgi | PM | Cytosol | Nucleus | ||||||
| Expt B |
2 peptides |
2 spectra |
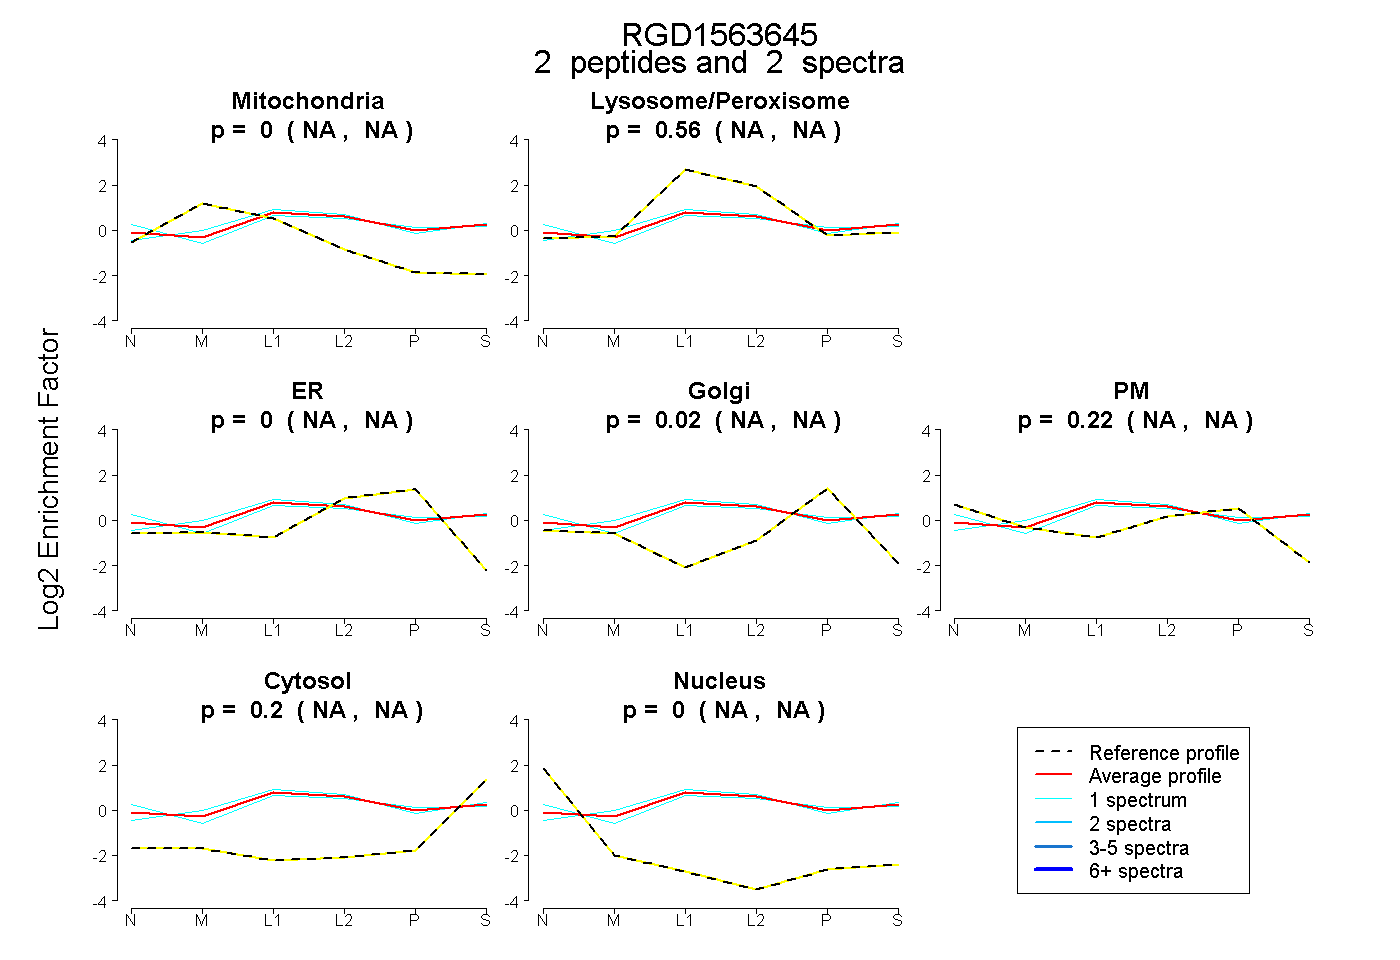 |
0.000 NA | NA |
0.558 NA | NA |
0.000 NA | NA |
0.019 NA | NA |
0.223 NA | NA |
0.200 NA | NA |
0.000 NA | NA |
|||
| Plot | Lyso | Other | |||||||||||
| Expt C |
7 peptides |
19 spectra |
 |
0.000 0.000 | 0.000 |
1.000 1.000 | 1.000 |