 6
6peptides
spectra
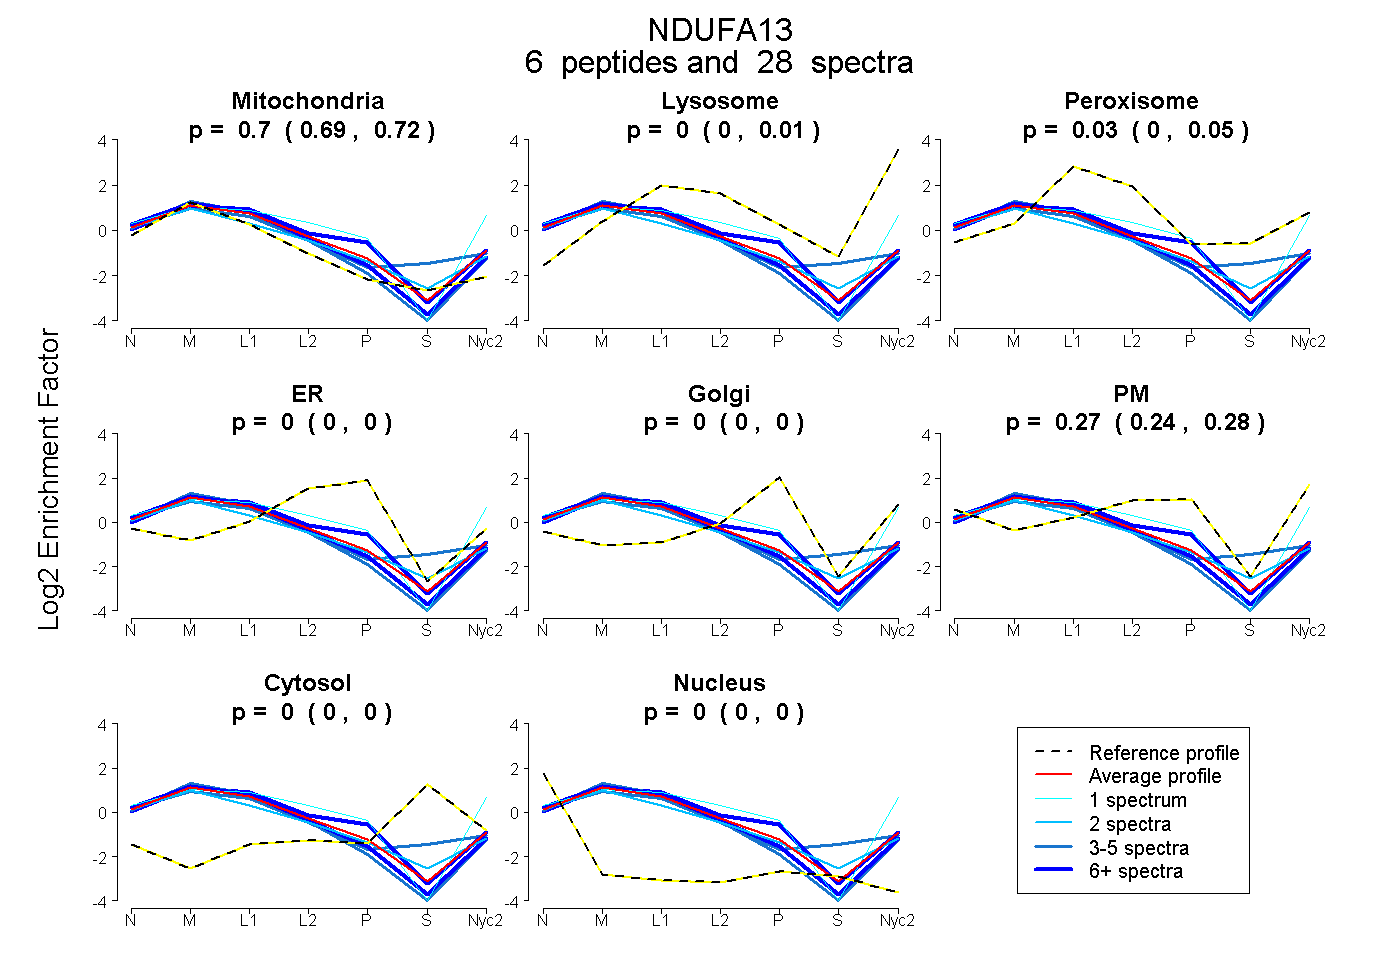
0.690 | 0.716
0.000 | 0.011
0.004 | 0.049
0.000 | 0.000
0.000 | 0.000
0.242 | 0.282
0.000 | 0.000
0.000 | 0.000
3peptides
spectra
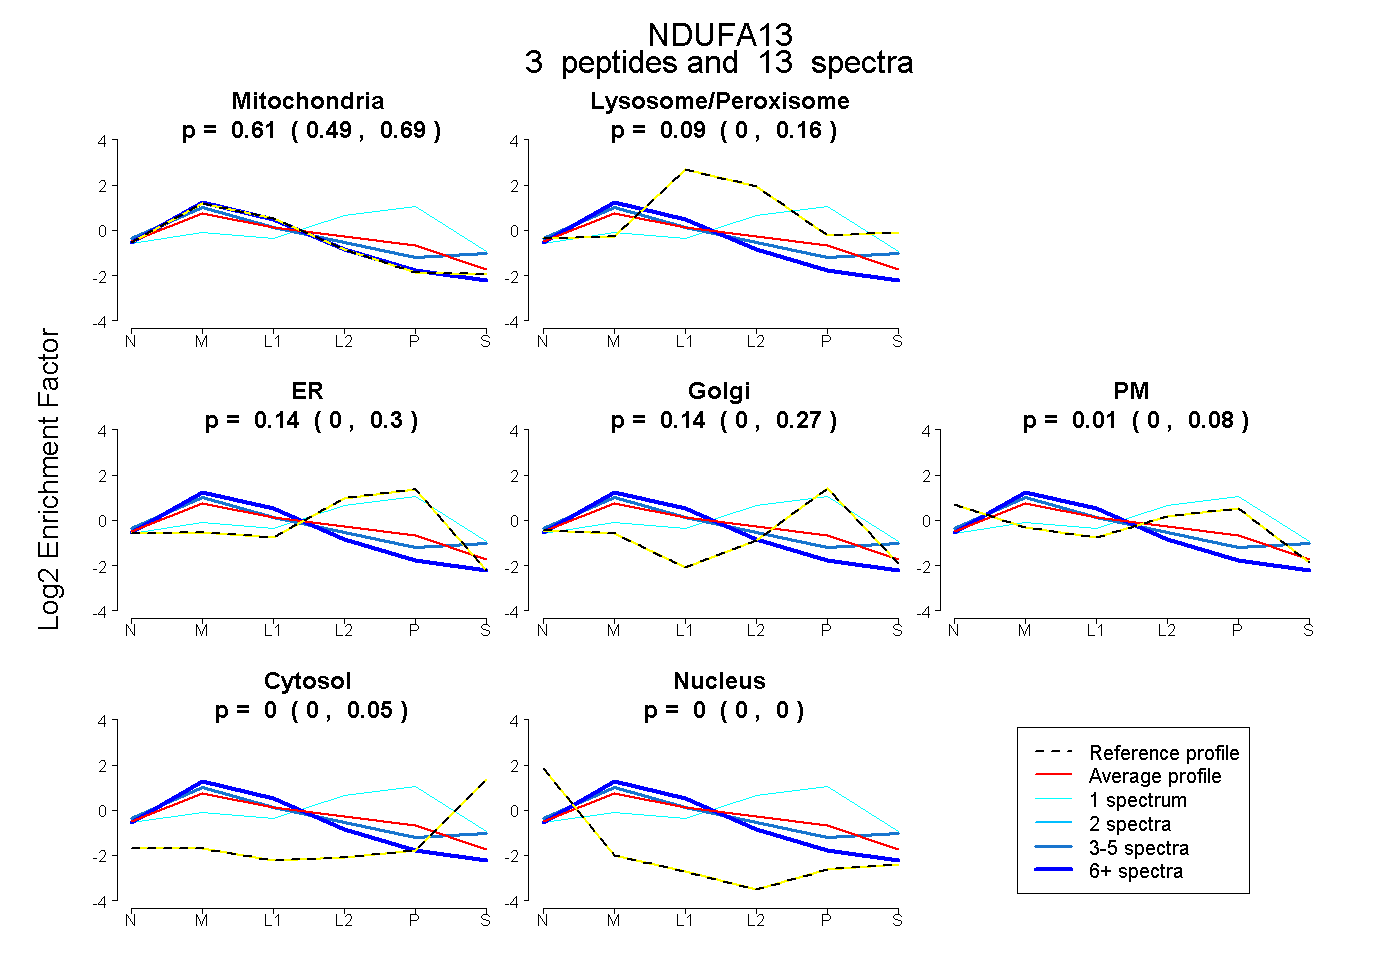
0.487 | 0.686
0.000 | 0.161
0.000 | 0.300
0.000 | 0.266
0.000 | 0.081
0.000 | 0.047
0.000 | 0.000
6peptides
spectra
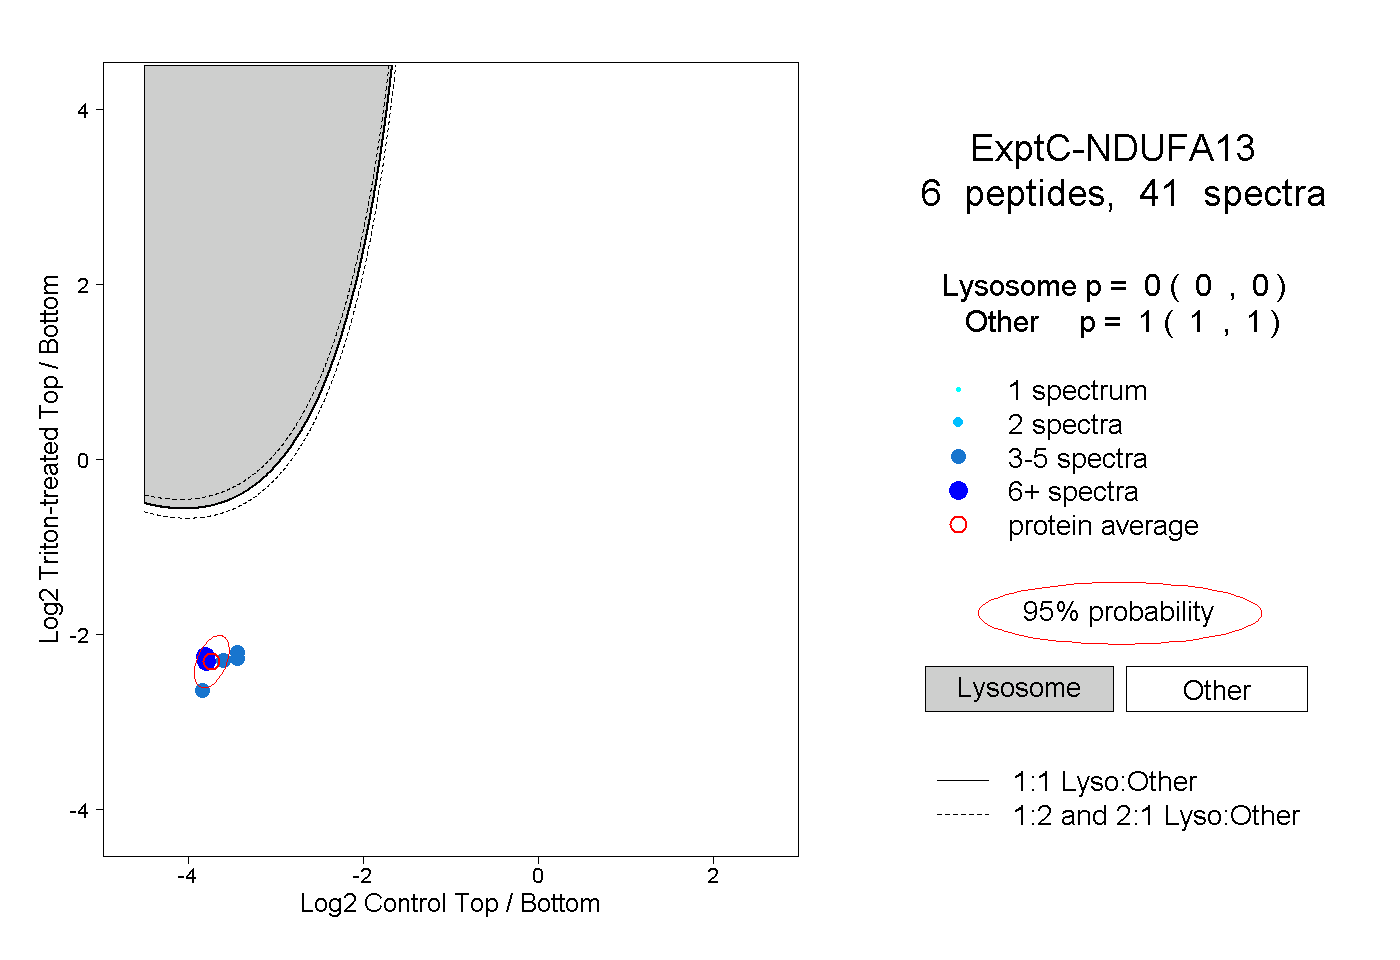
0.000 | 0.000
1.000 | 1.000
3peptides
spectra
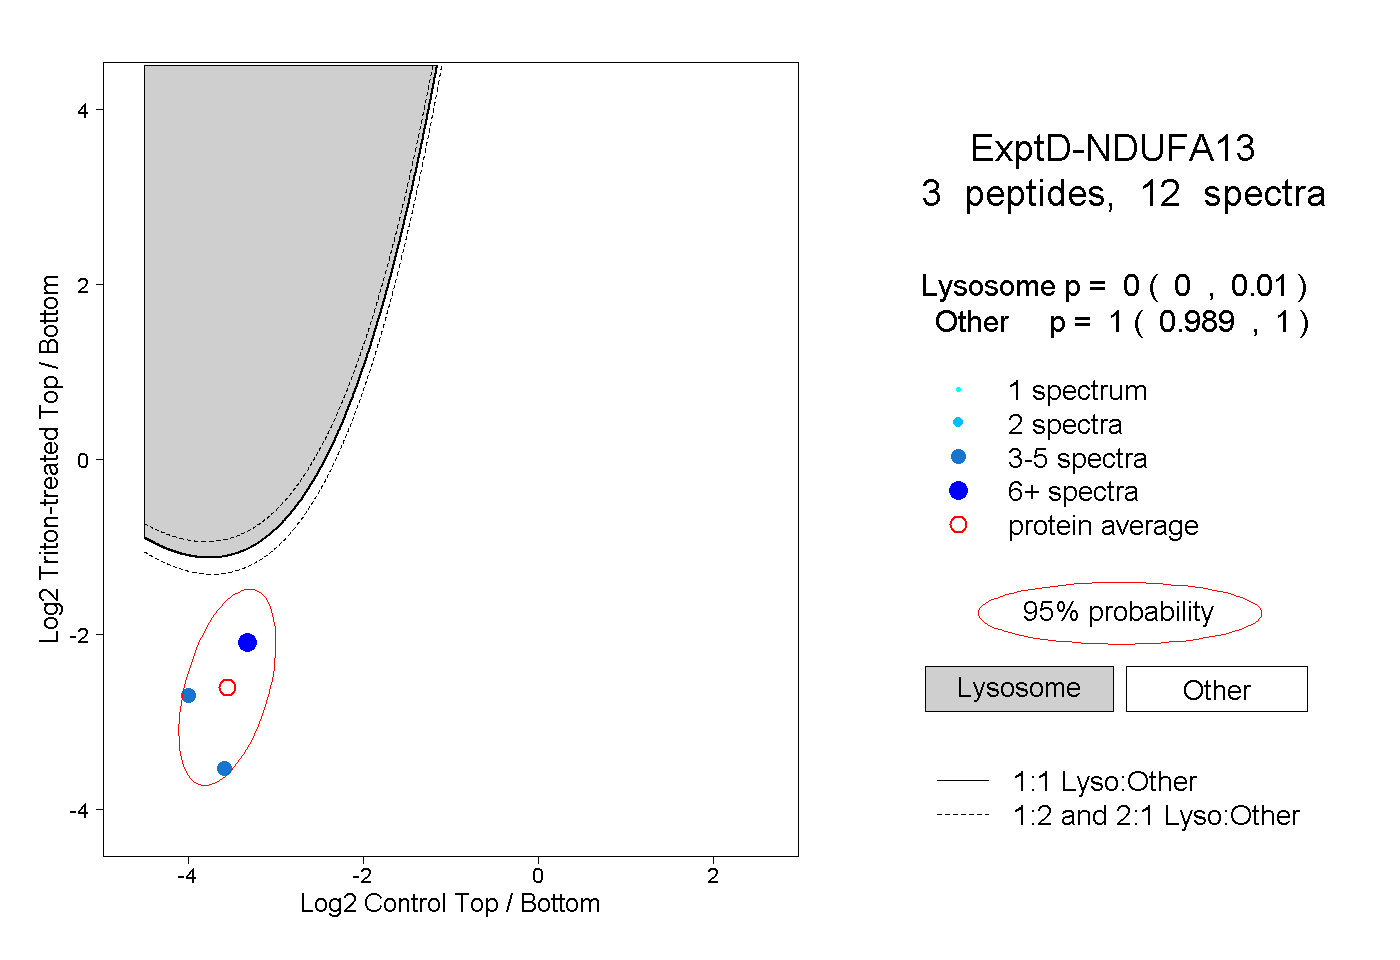
0.000 | 0.010
0.989 | 1.000