 6
6peptides
spectra
0.690 | 0.716
0.000 | 0.011
0.004 | 0.049
0.000 | 0.000
0.000 | 0.000
0.242 | 0.282
0.000 | 0.000
0.000 | 0.000
| Plot | Mito | Lyso | Perox | ER | Golgi | PM | Cytosol | Nucleus | |||||
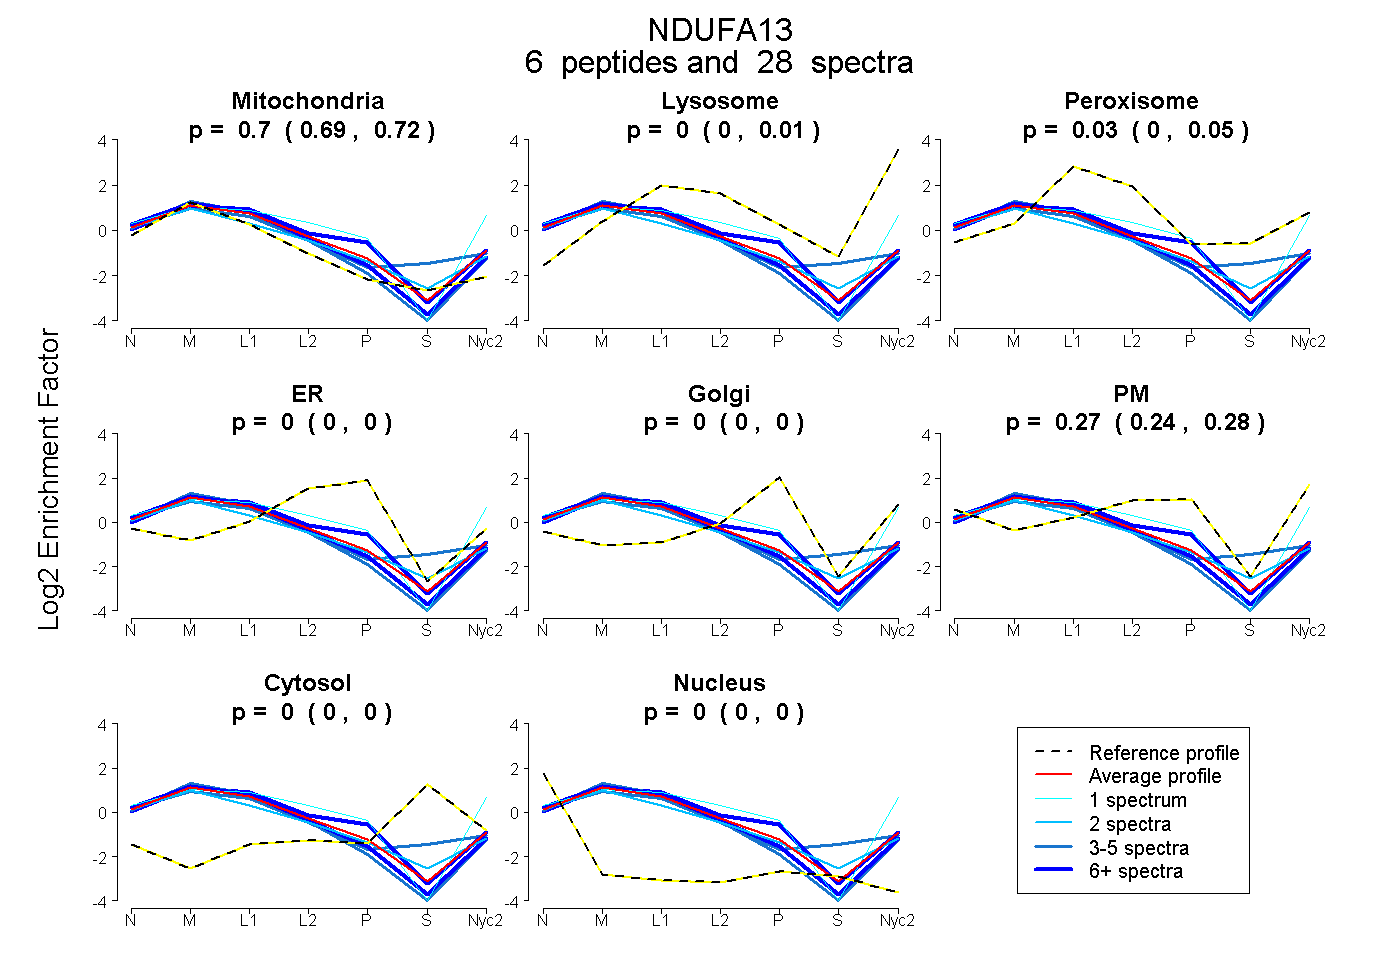
| Expt A |
6 peptides |
28 spectra |
|
0.704 0.690 | 0.716 |
0.000 0.000 | 0.011 |
0.031 0.004 | 0.049 |
0.000 0.000 | 0.000 |
0.000 0.000 | 0.000 |
0.265 0.242 | 0.282 |
0.000 0.000 | 0.000 |
0.000 0.000 | 0.000 |
| 2 spectra, WVPPLIGELYGLR | 0.750 | 0.000 | 0.018 | 0.000 | 0.000 | 0.232 | 0.000 | 0.000 | ||
| 1 spectrum, QDMPPPGGYGPIDYK | 0.403 | 0.052 | 0.000 | 0.000 | 0.000 | 0.545 | 0.000 | 0.000 | ||
| 3 spectra, IALMPLLQAEK | 0.844 | 0.000 | 0.000 | 0.000 | 0.000 | 0.156 | 0.000 | 0.000 | ||
| 11 spectra, LLIEDLEAR | 0.784 | 0.000 | 0.000 | 0.000 | 0.000 | 0.216 | 0.000 | 0.000 | ||
| 7 spectra, ENLEEEAIIMK | 0.613 | 0.015 | 0.027 | 0.151 | 0.000 | 0.195 | 0.000 | 0.000 | ||
| 4 spectra, DVPNWK | 0.638 | 0.000 | 0.236 | 0.000 | 0.000 | 0.038 | 0.077 | 0.010 |
| Plot | Mito | Lyso or Perox | ER | Golgi | PM | Cytosol | Nucleus | ||||||
| Expt B |
3 peptides |
13 spectra |
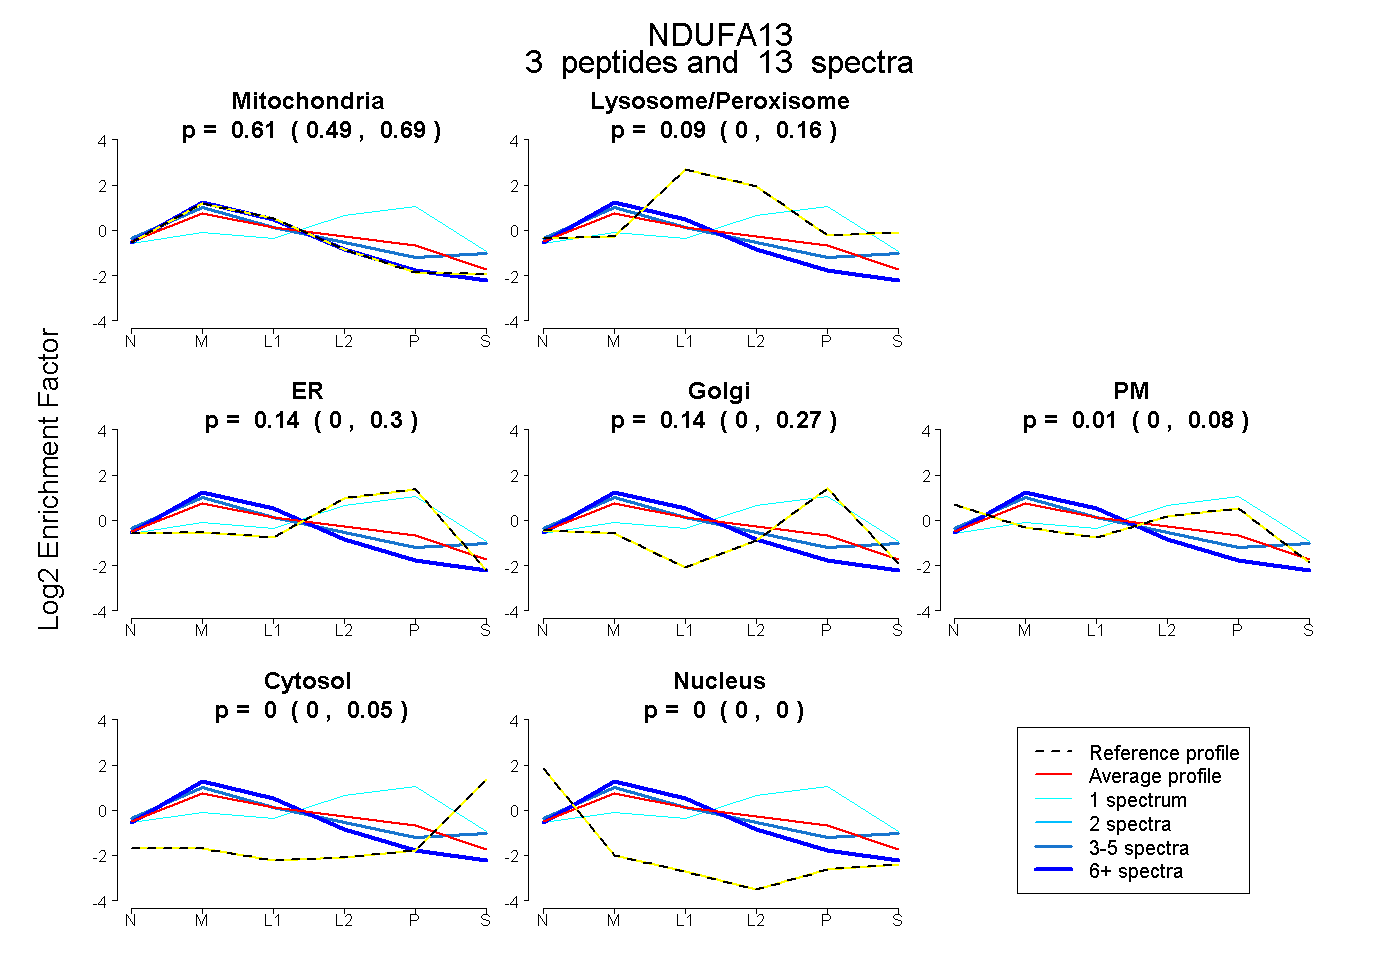 |
0.608 0.487 | 0.686 |
0.094 0.000 | 0.161 |
0.144 0.000 | 0.300 |
0.140 0.000 | 0.266 |
0.014 0.000 | 0.081 |
0.000 0.000 | 0.047 |
0.000 0.000 | 0.000 |
|||
| Plot | Lyso | Other | |||||||||||
| Expt C |
6 peptides |
41 spectra |
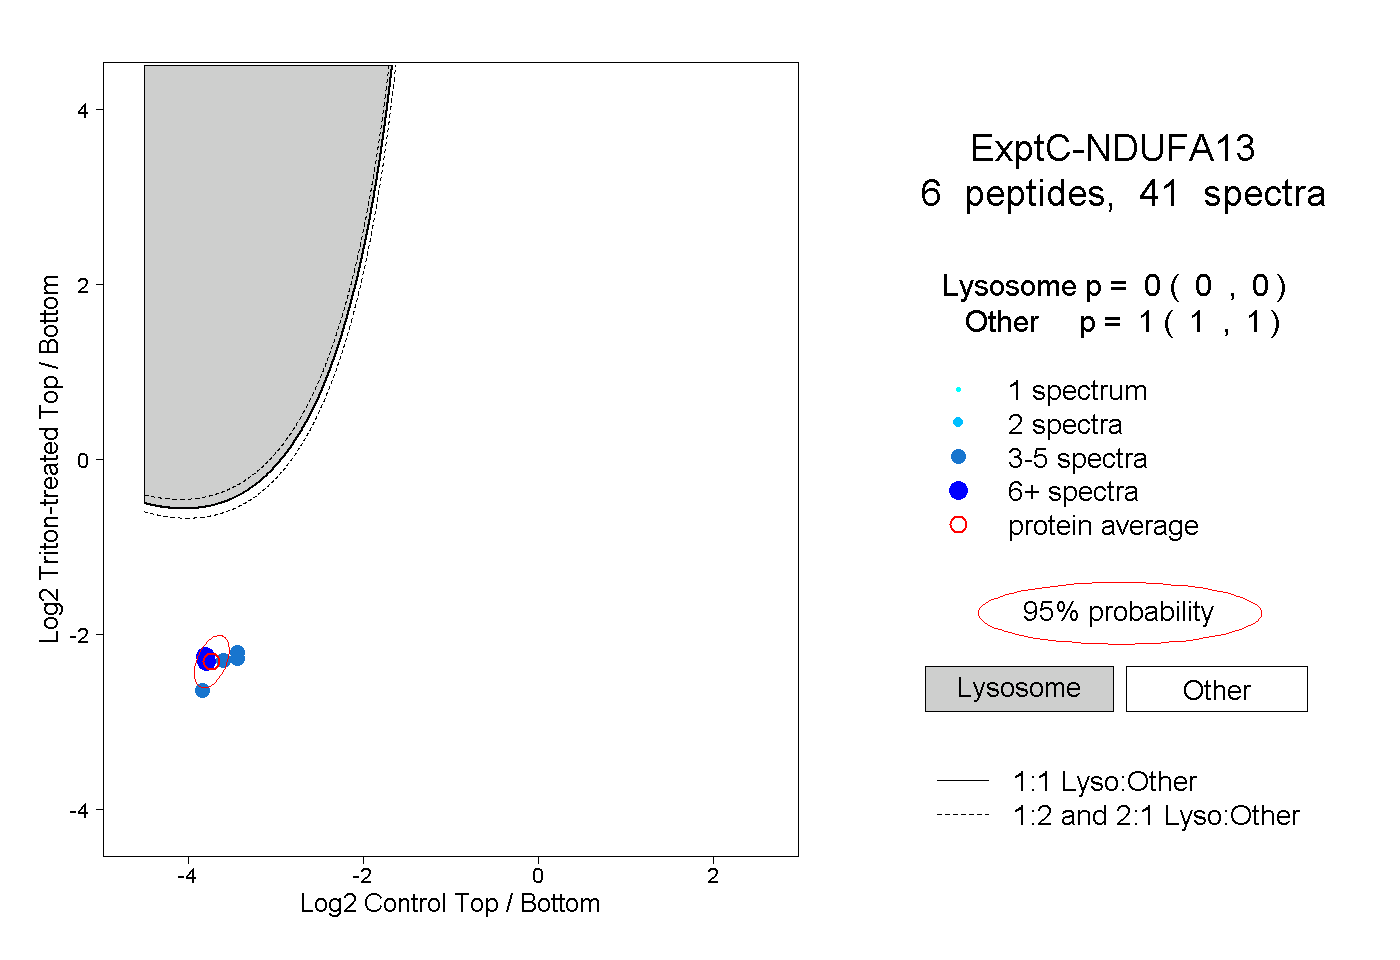 |
0.000 0.000 | 0.000 |
1.000 1.000 | 1.000 |
||||||||
| Plot | Lyso | Other | |||||||||||
| Expt D |
3 peptides |
12 spectra |
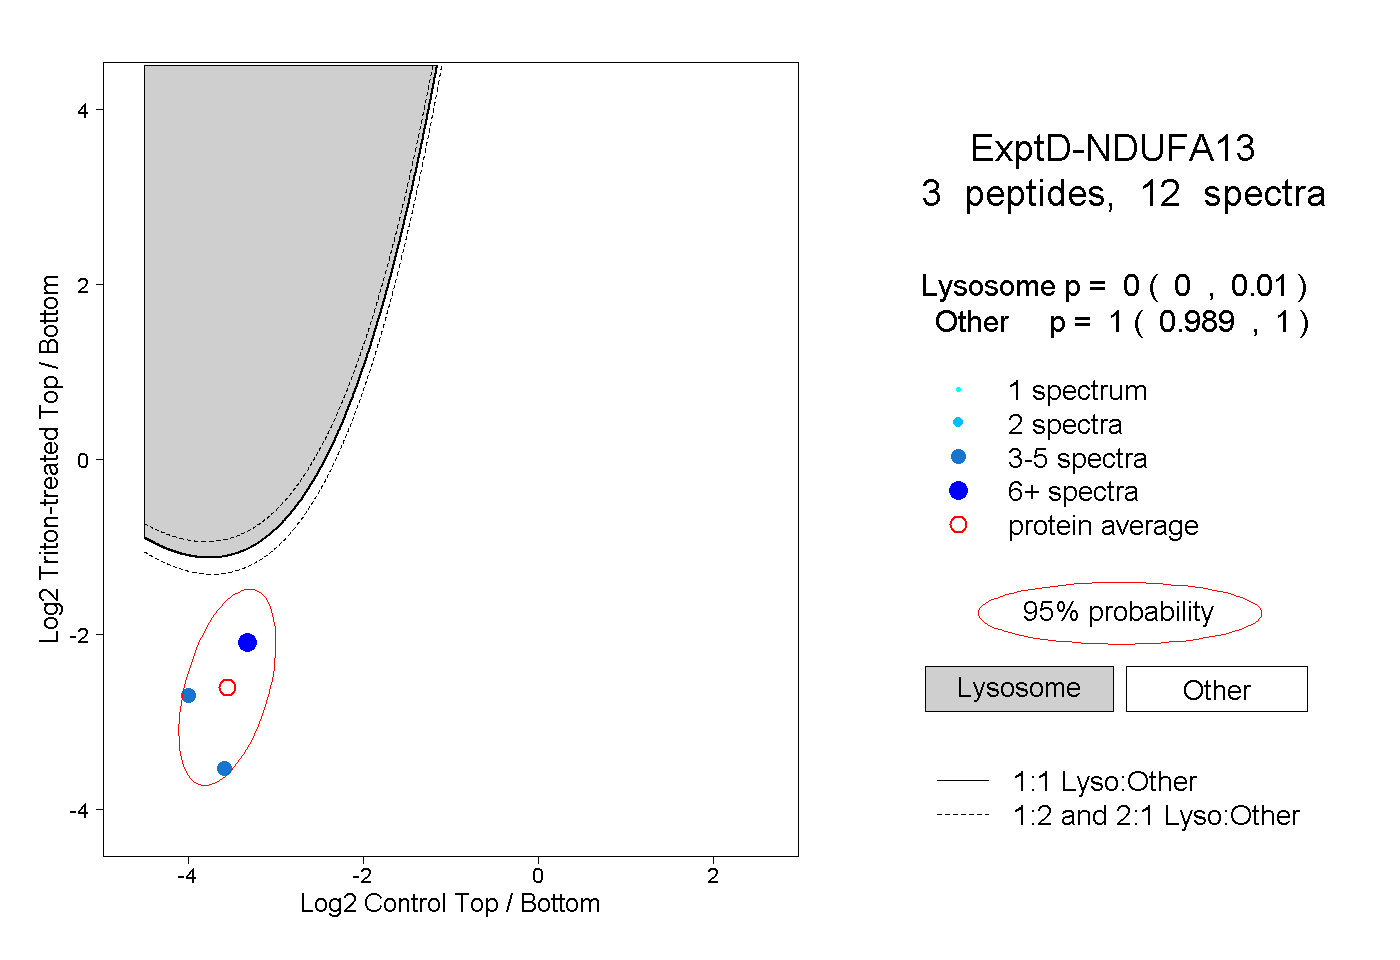 |
0.000 0.000 | 0.010 |
1.000 0.989 | 1.000 |