 3
3peptides
spectra
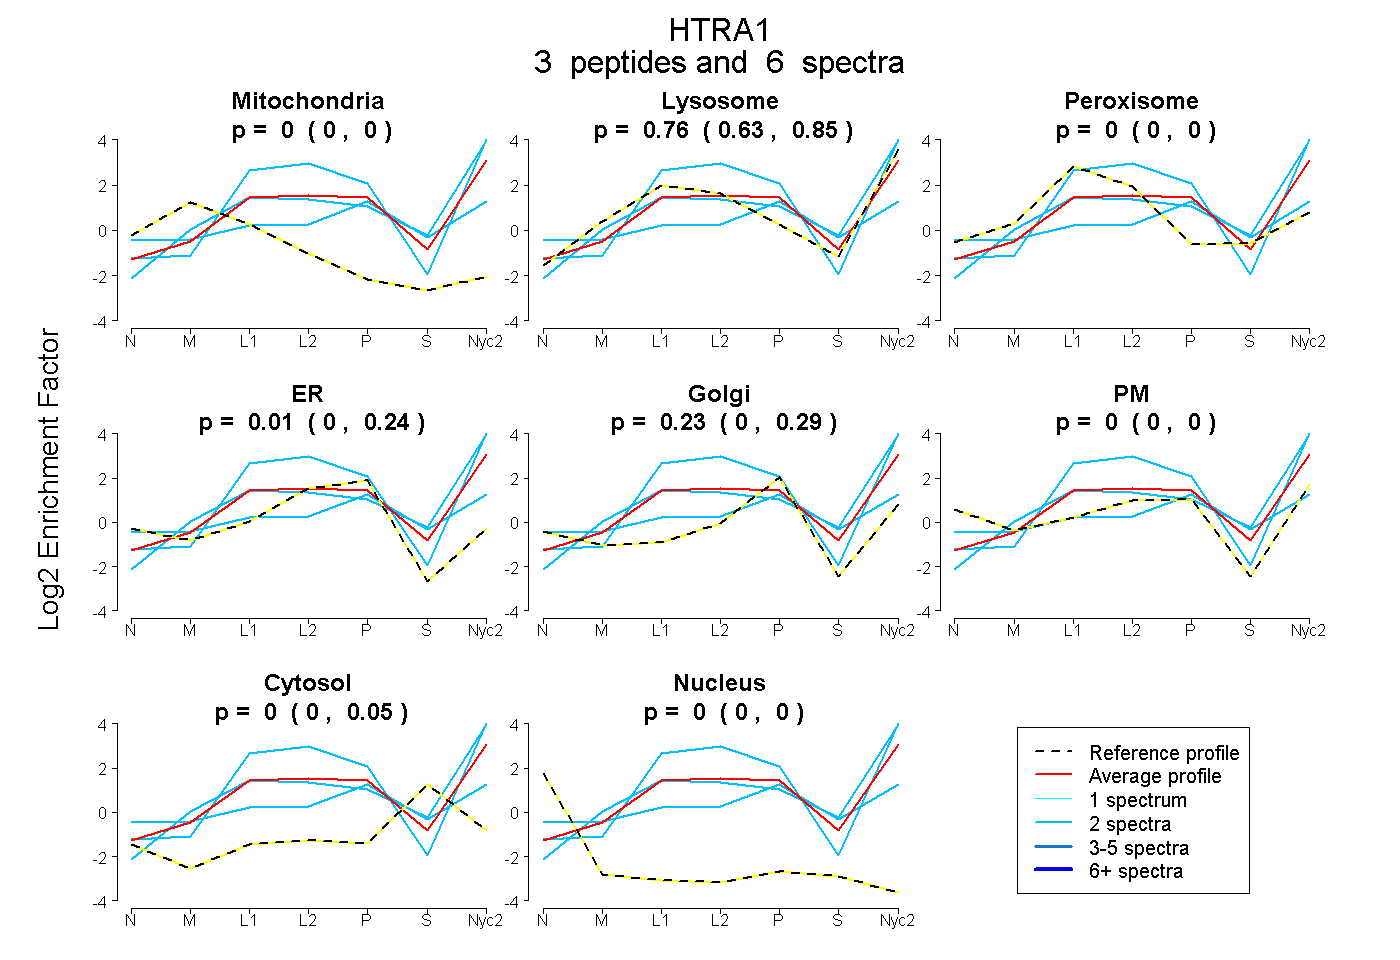
0.000 | 0.000
0.634 | 0.853
0.000 | 0.005
0.000 | 0.242
0.000 | 0.289
0.000 | 0.000
0.000 | 0.054
0.000 | 0.000
1peptide
spectrum
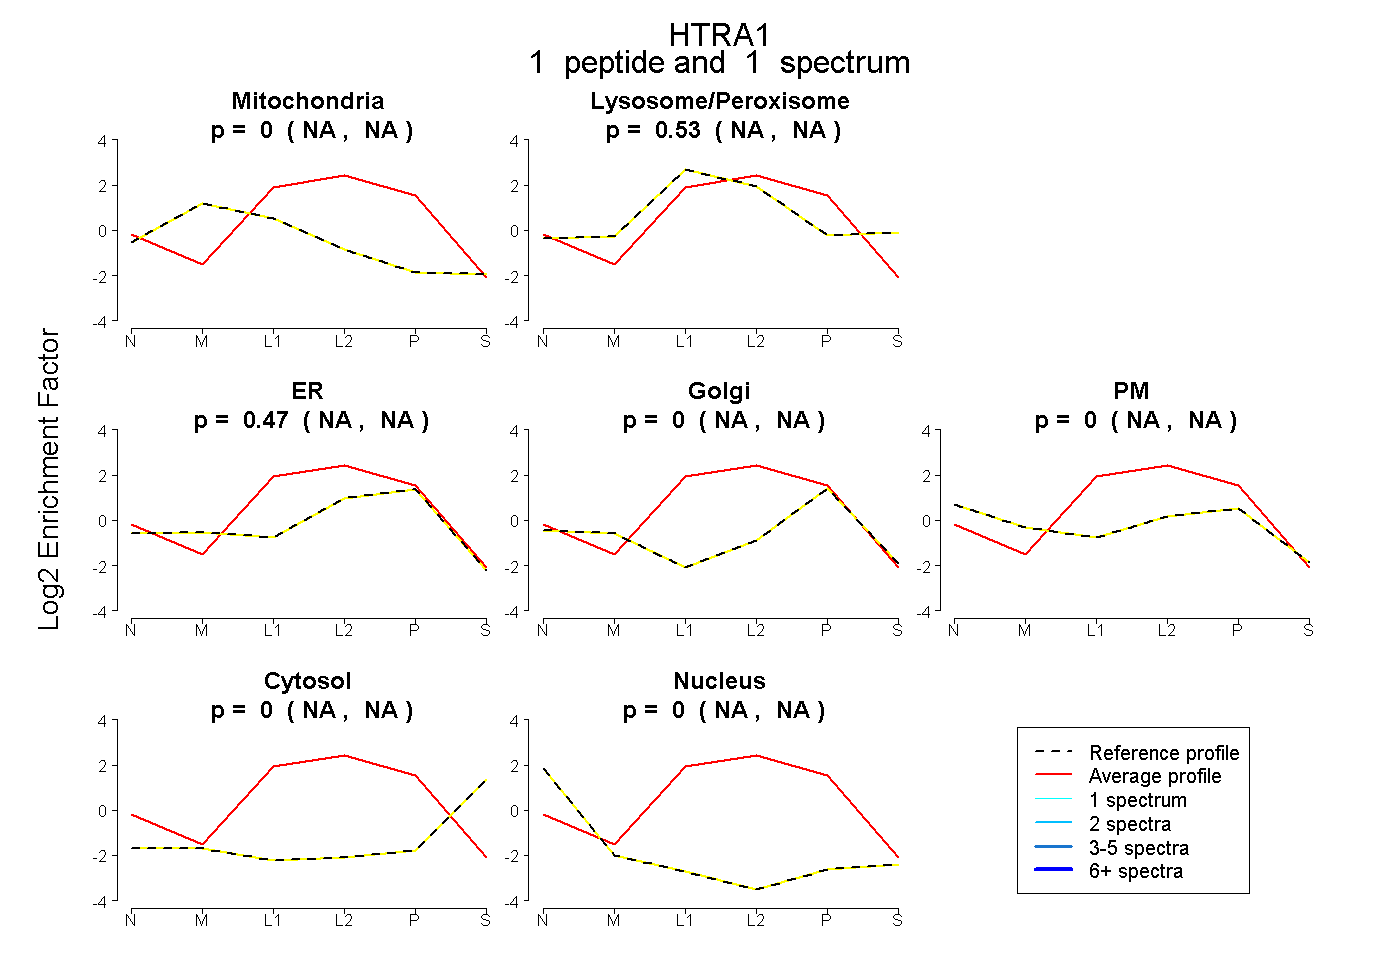
NA | NA
NA | NA
NA | NA
NA | NA
NA | NA
NA | NA
NA | NA
6peptides
spectra
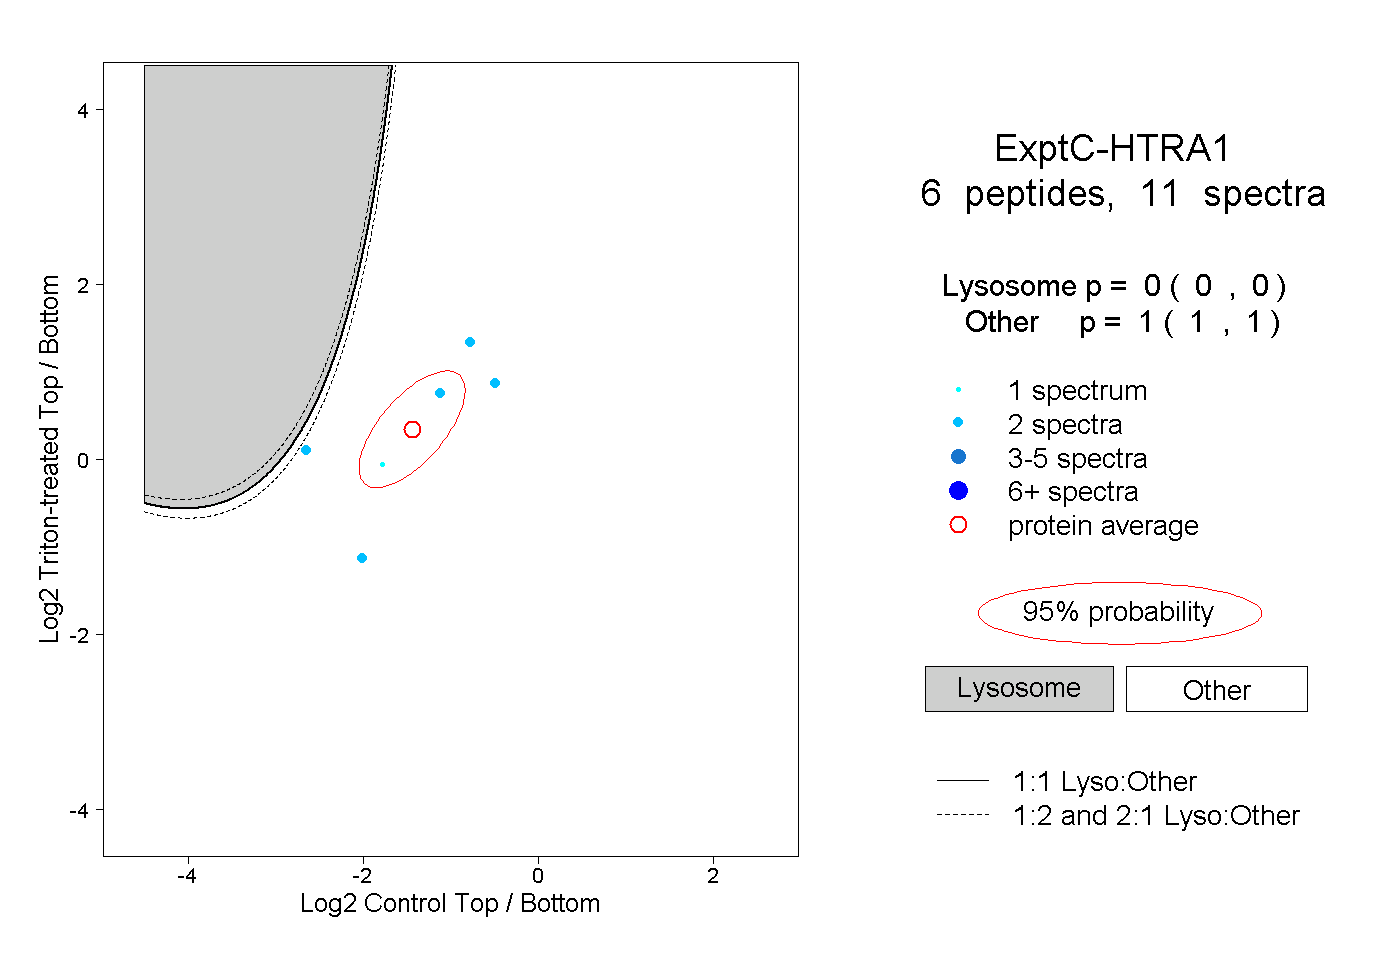
0.000 | 0.000
1.000 | 1.000
3peptides
spectra
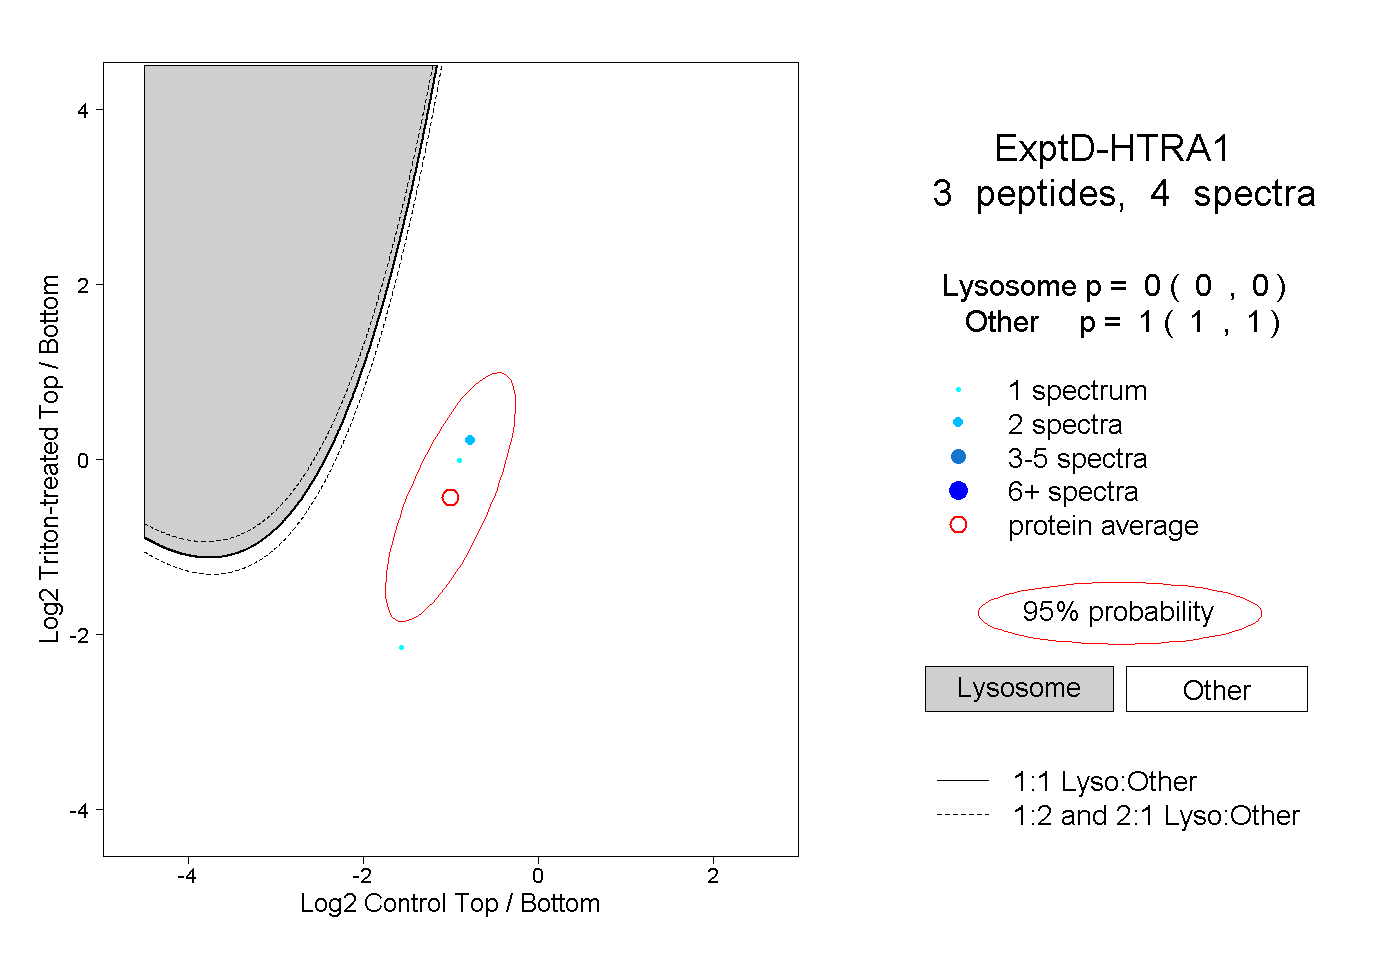
0.000 | 0.000
1.000 | 1.000