 3
3peptides
spectra
0.000 | 0.000
0.634 | 0.853
0.000 | 0.005
0.000 | 0.242
0.000 | 0.289
0.000 | 0.000
0.000 | 0.054
0.000 | 0.000
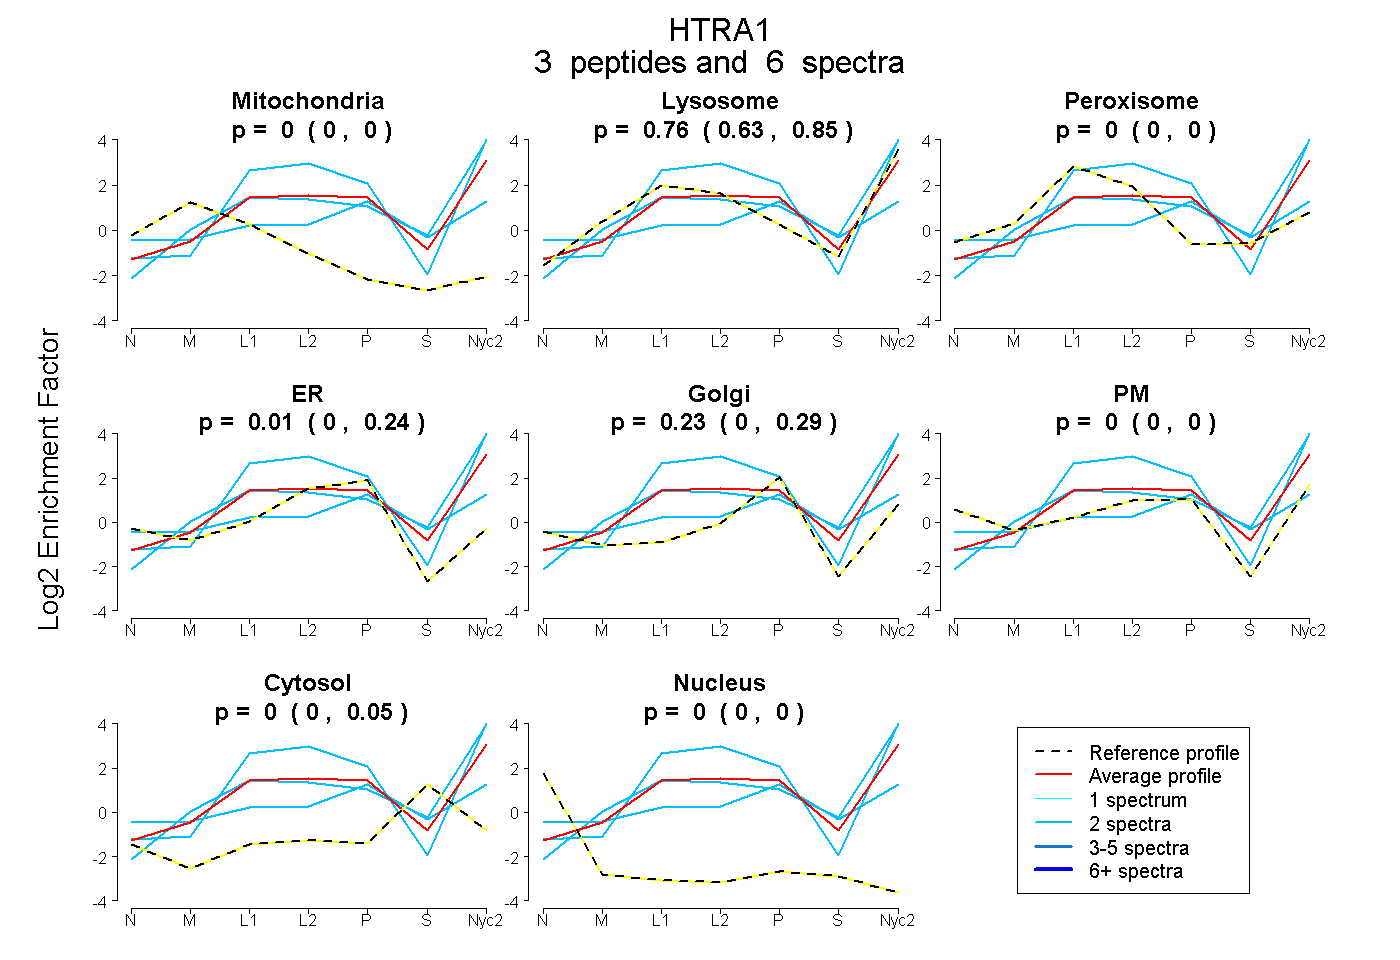
| Plot | Mito | Lyso | Perox | ER | Golgi | PM | Cytosol | Nucleus | |||||
| Expt A |
3 peptides |
6 spectra |
|
0.000 0.000 | 0.000 |
0.764 0.634 | 0.853 |
0.000 0.000 | 0.005 |
0.007 0.000 | 0.242 |
0.229 0.000 | 0.289 |
0.000 0.000 | 0.000 |
0.000 0.000 | 0.054 |
0.000 0.000 | 0.000 |
| 2 spectra, IAPAVVHIELYR | 0.000 | 0.954 | 0.000 | 0.000 | 0.000 | 0.000 | 0.046 | 0.000 | ||
| 2 spectra, QPPVIVLQR | 0.000 | 0.247 | 0.136 | 0.000 | 0.434 | 0.000 | 0.182 | 0.000 | ||
| 2 spectra, LPVLLLGR | 0.000 | 0.877 | 0.000 | 0.123 | 0.000 | 0.000 | 0.000 | 0.000 |
| Plot | Mito | Lyso or Perox | ER | Golgi | PM | Cytosol | Nucleus | ||||||
| Expt B |
1 peptide |
1 spectrum |
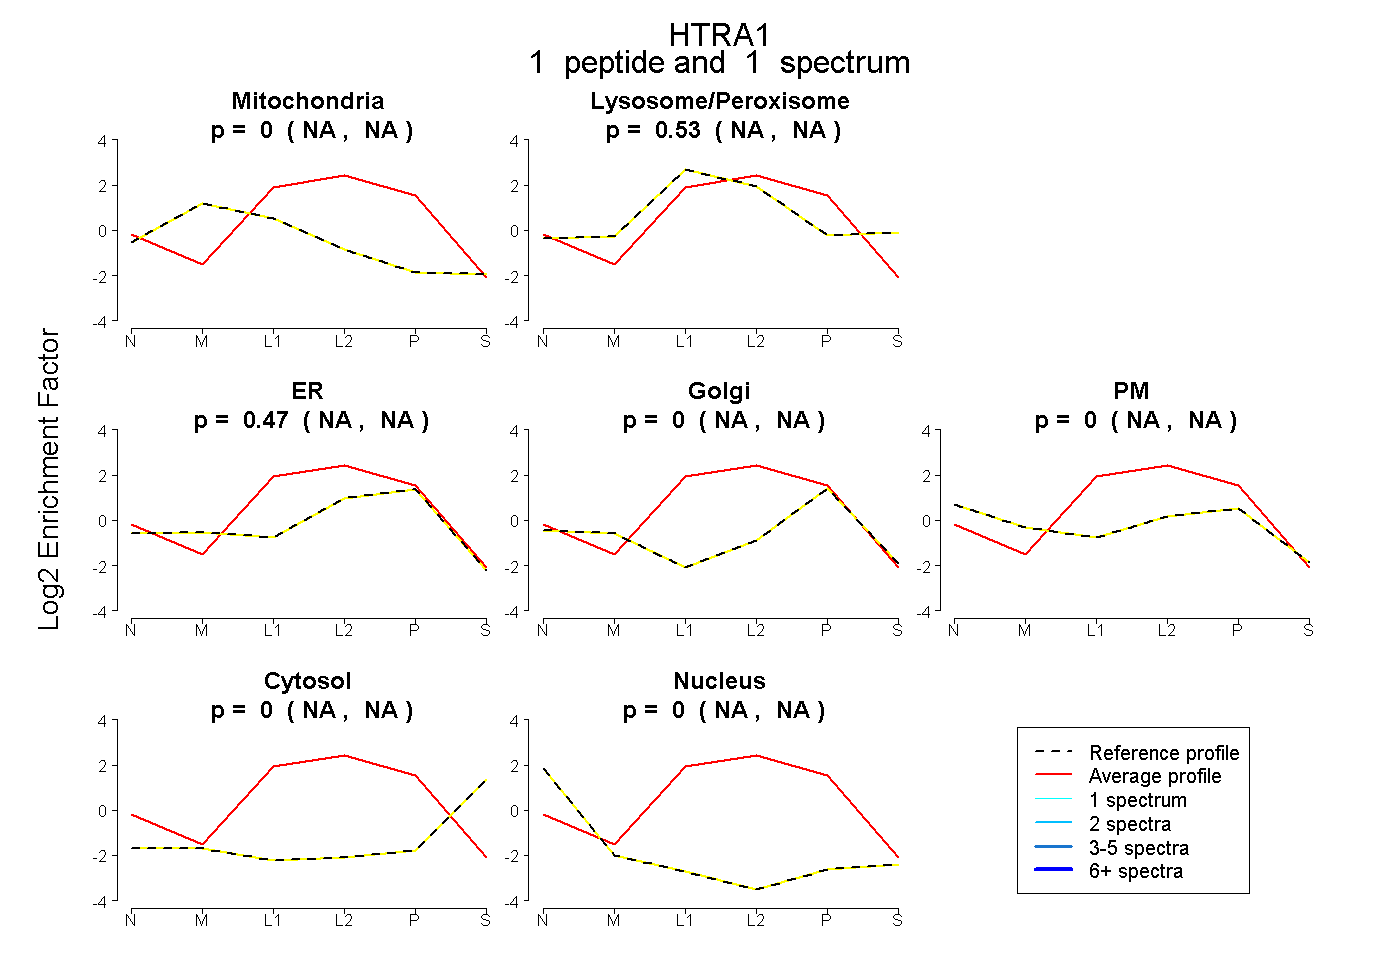 |
0.000 NA | NA |
0.527 NA | NA |
0.473 NA | NA |
0.000 NA | NA |
0.000 NA | NA |
0.000 NA | NA |
0.000 NA | NA |
|||
| Plot | Lyso | Other | |||||||||||
| Expt C |
6 peptides |
11 spectra |
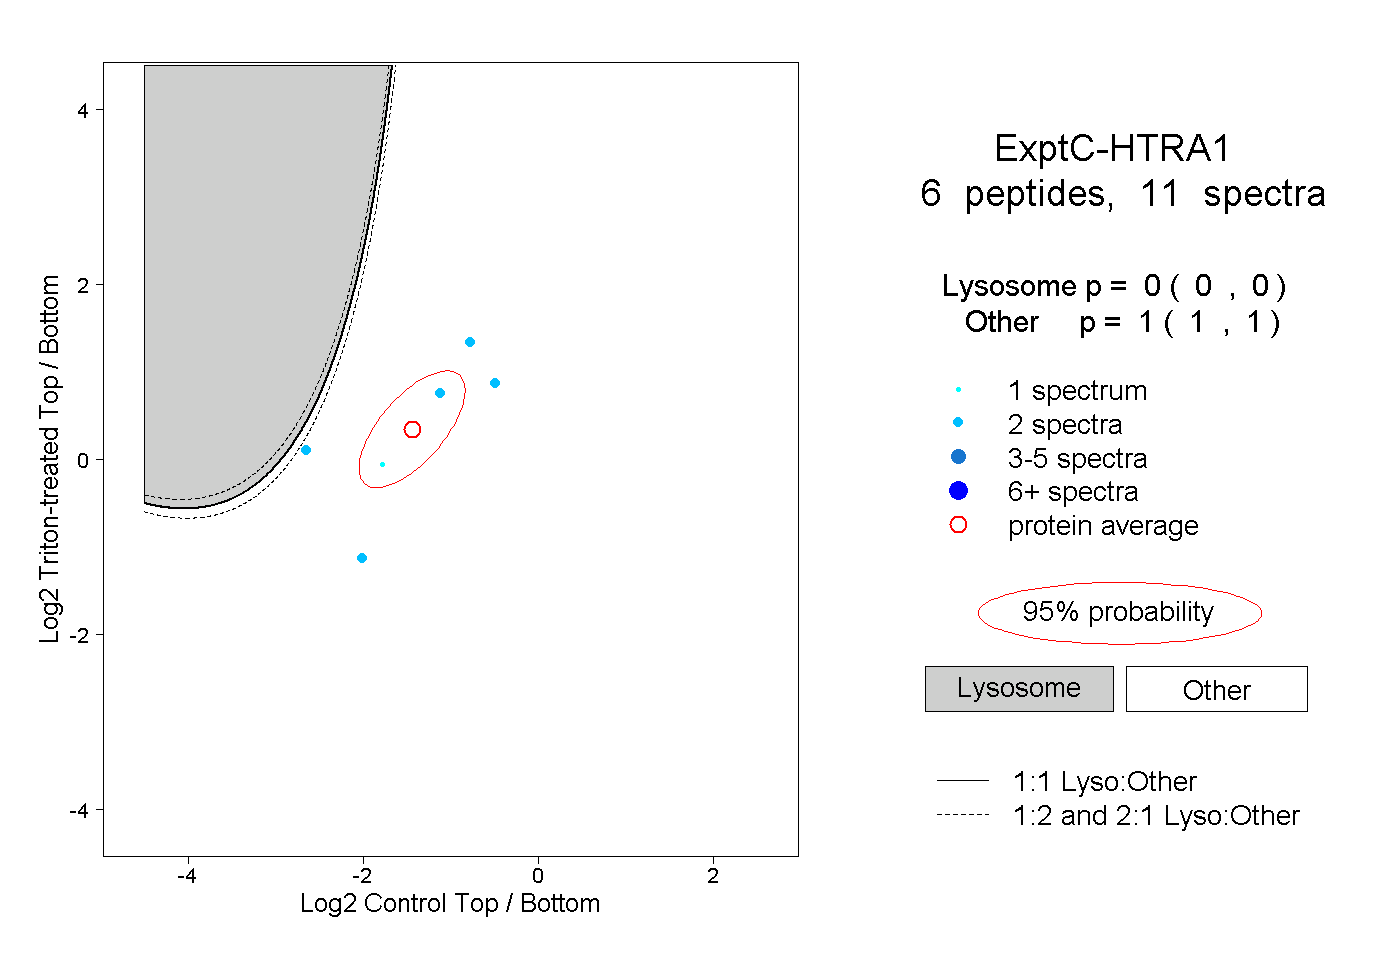 |
0.000 0.000 | 0.000 |
1.000 1.000 | 1.000 |
||||||||
| Plot | Lyso | Other | |||||||||||
| Expt D |
3 peptides |
4 spectra |
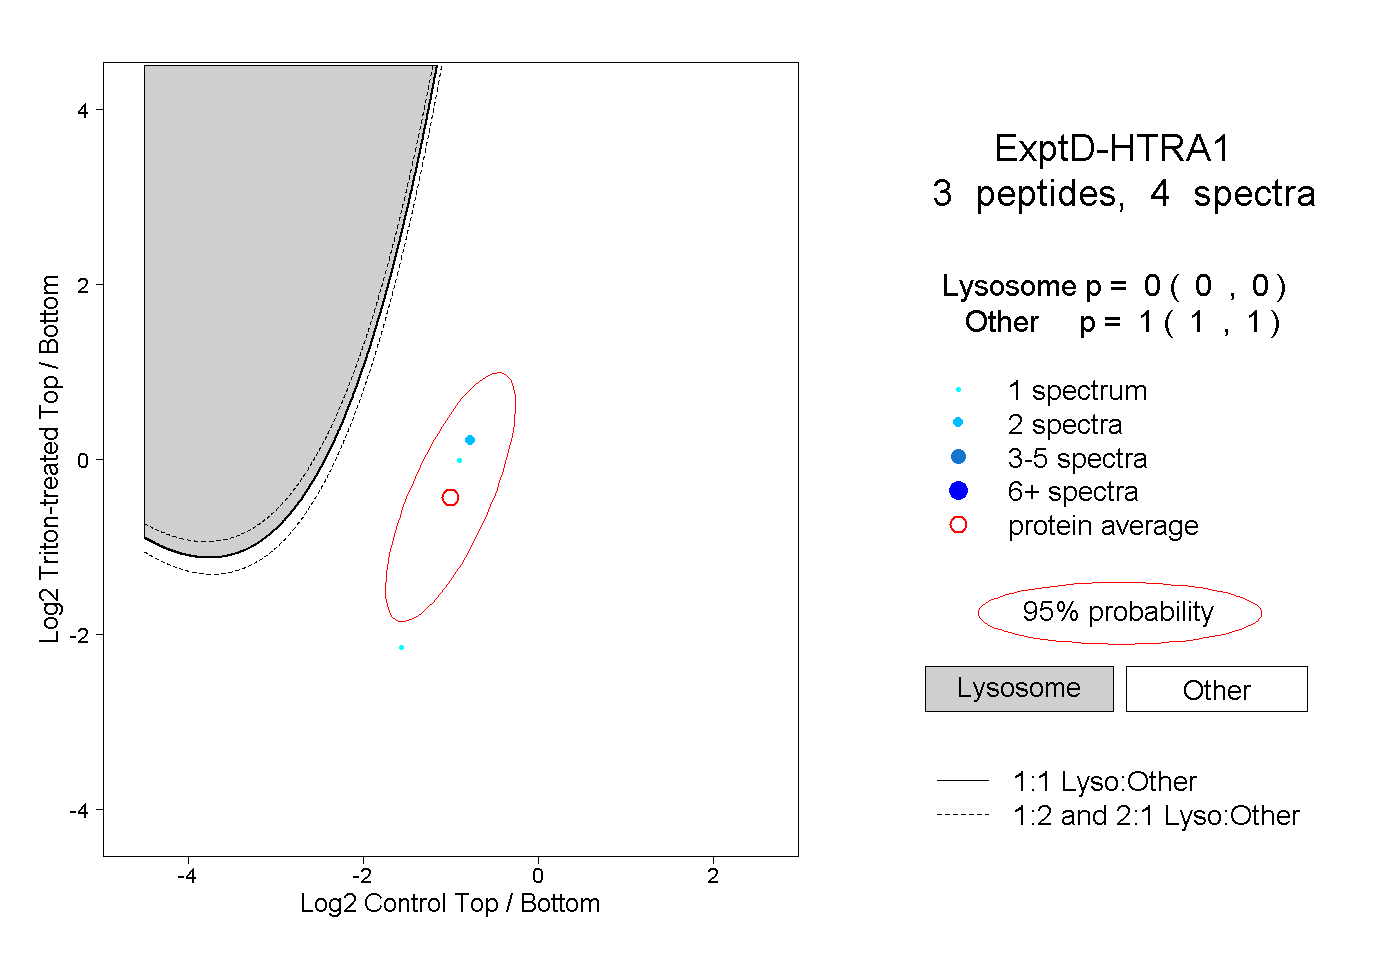 |
0.000 0.000 | 0.000 |
1.000 1.000 | 1.000 |