 10
10peptides
spectra
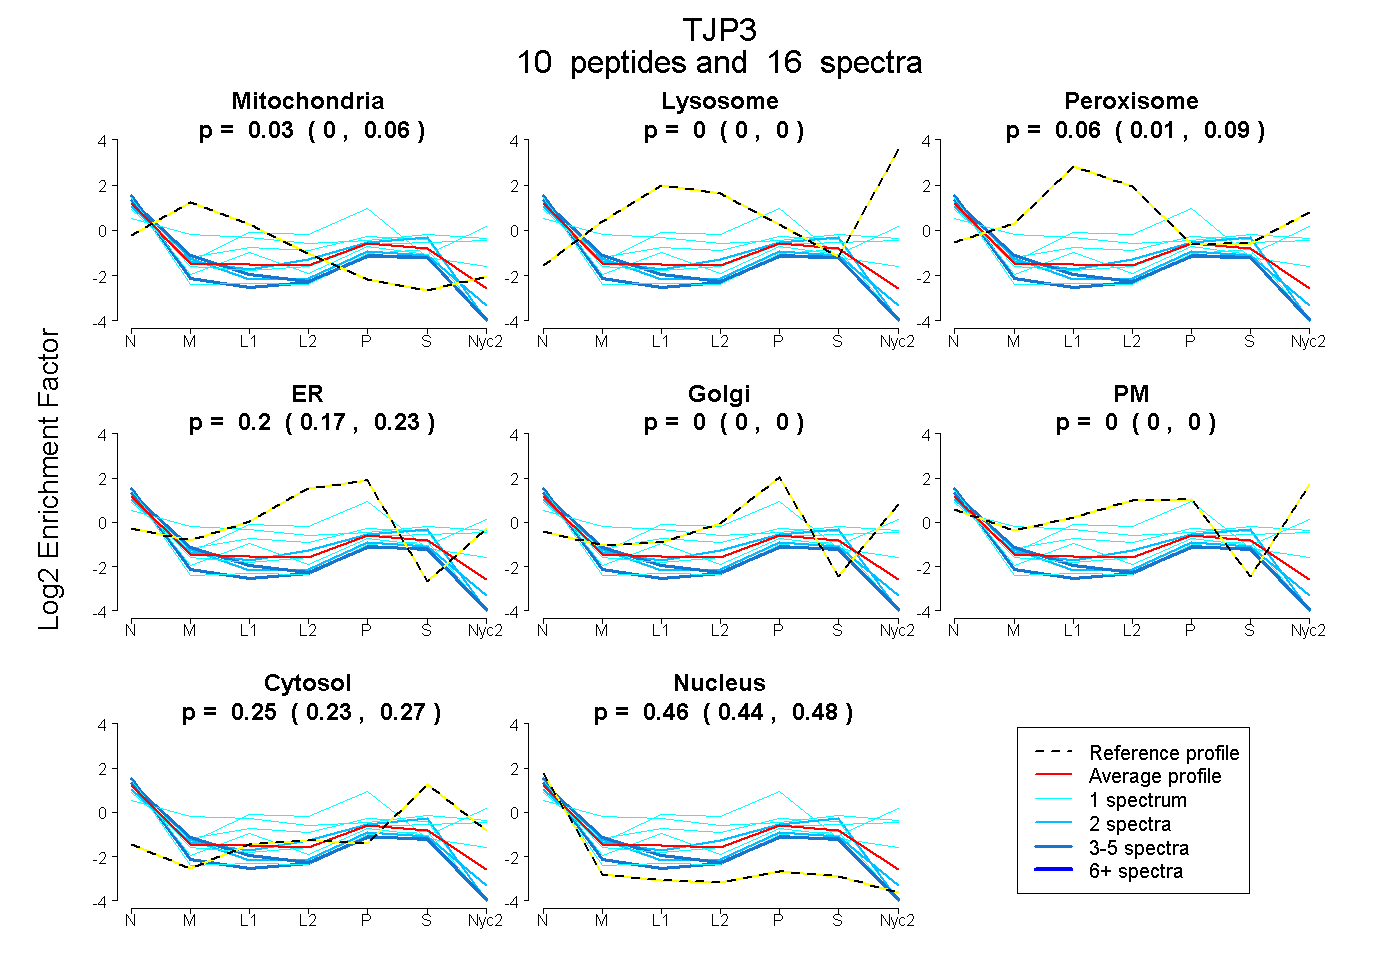
0.000 | 0.064
0.000 | 0.000
0.011 | 0.092
0.174 | 0.226
0.000 | 0.000
0.000 | 0.000
0.227 | 0.266
0.438 | 0.477
3peptides
spectra
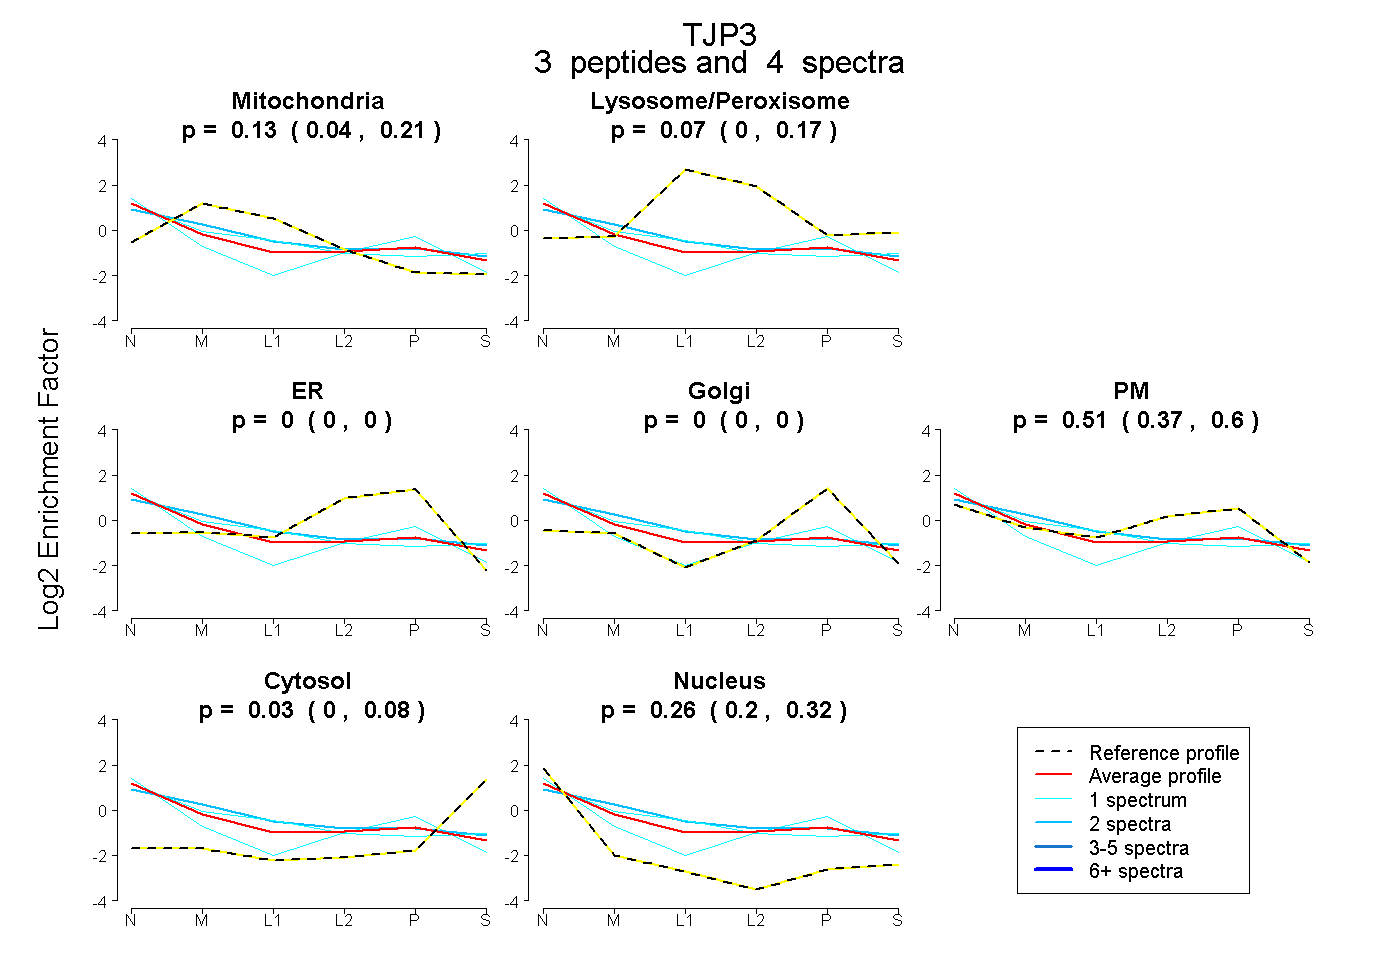
0.041 | 0.209
0.000 | 0.166
0.000 | 0.000
0.000 | 0.000
0.367 | 0.601
0.000 | 0.081
0.202 | 0.318
4peptides
spectra
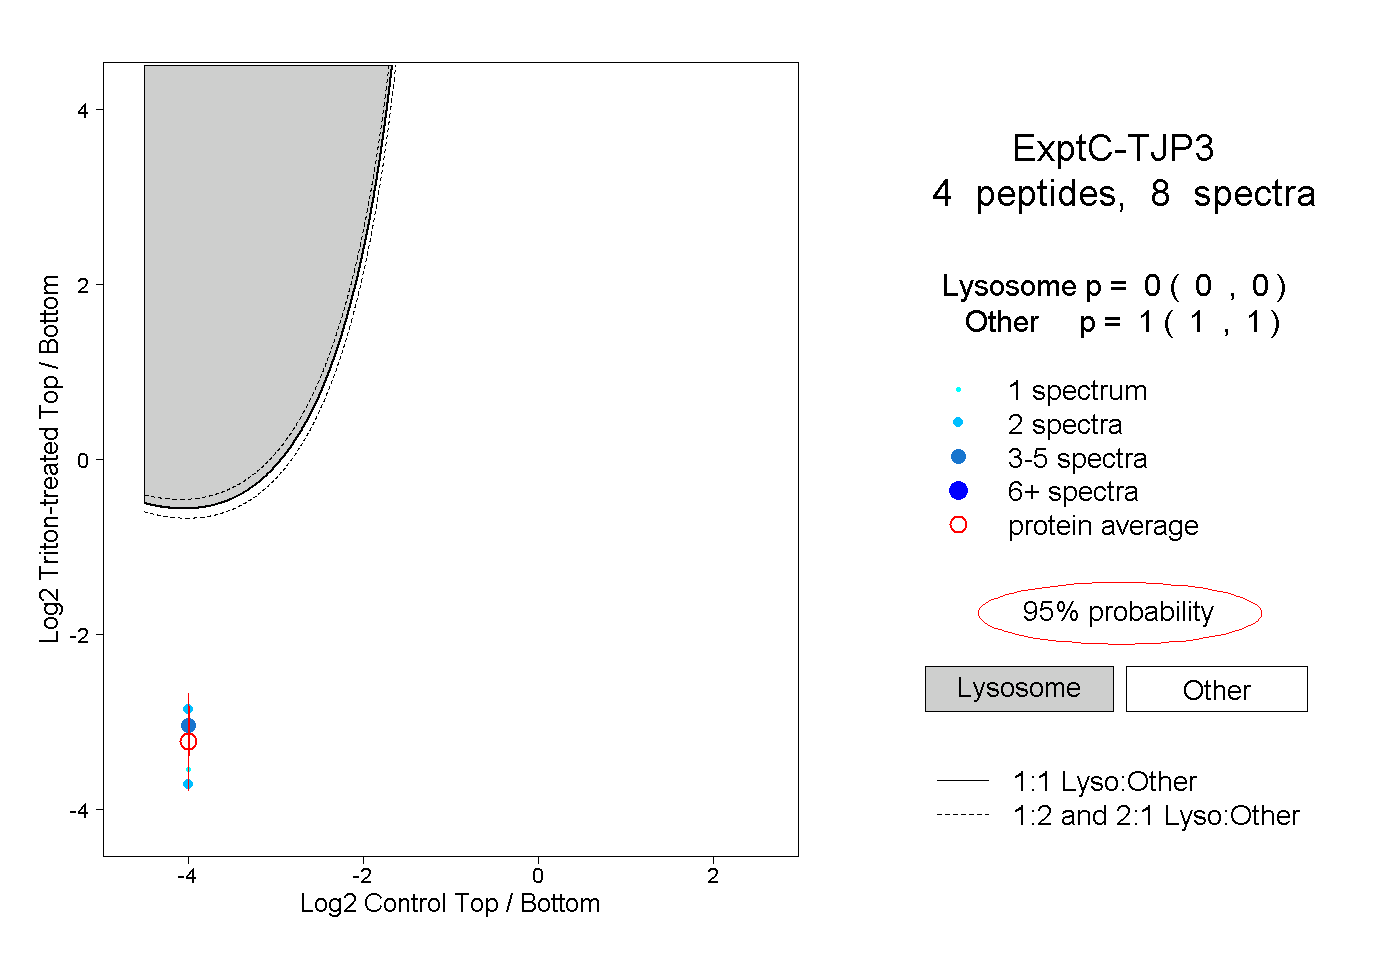
0.000 | 0.000
1.000 | 1.000