 10
10peptides
spectra
0.000 | 0.064
0.000 | 0.000
0.011 | 0.092
0.174 | 0.226
0.000 | 0.000
0.000 | 0.000
0.227 | 0.266
0.438 | 0.477
| Plot | Mito | Lyso | Perox | ER | Golgi | PM | Cytosol | Nucleus | |||||
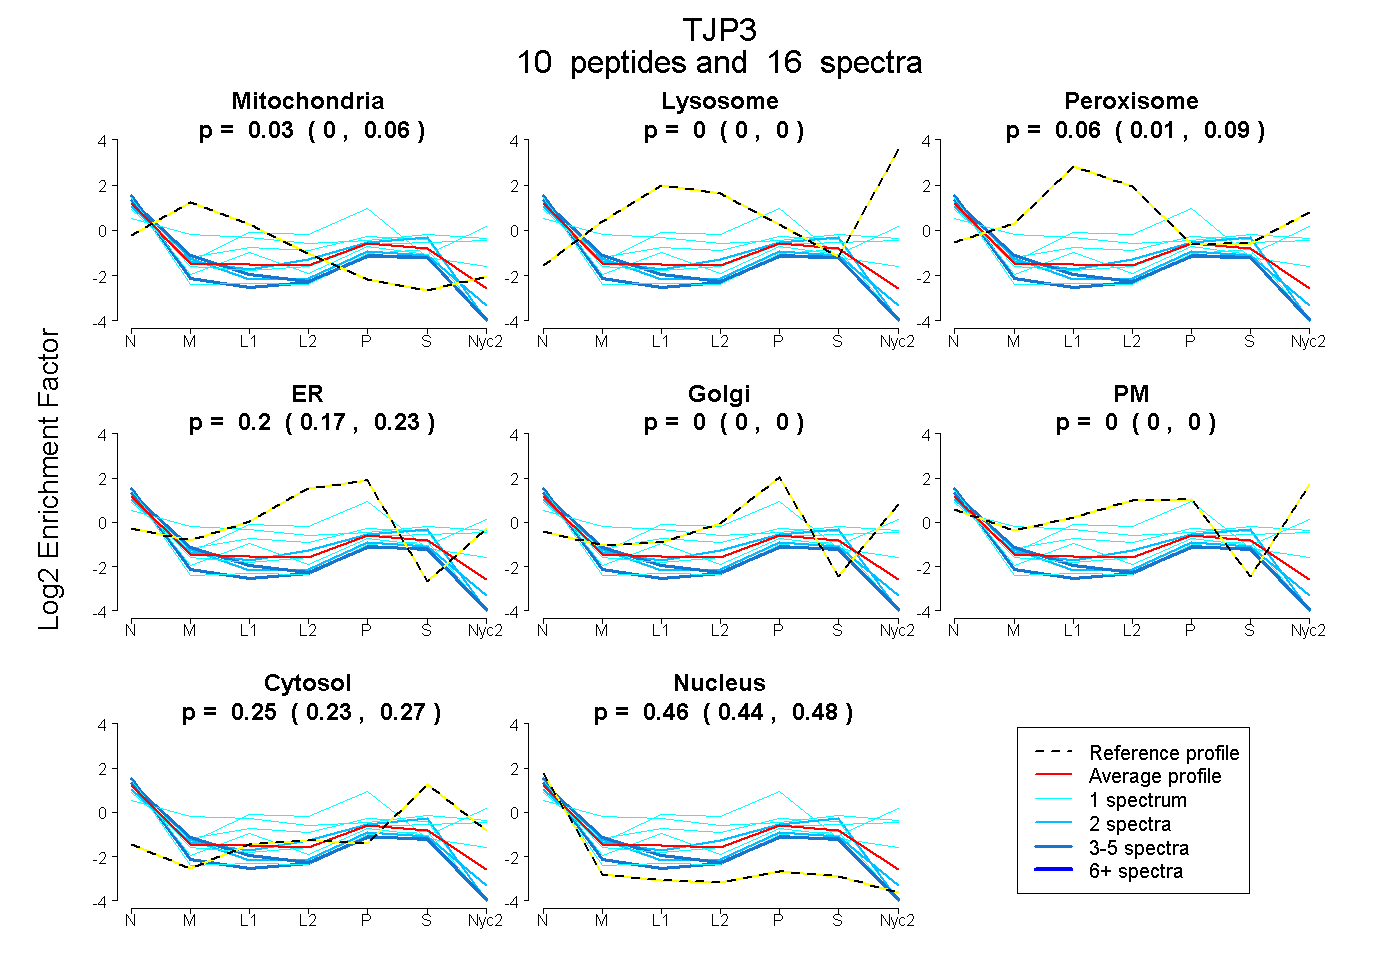
| Expt A |
10 peptides |
16 spectra |
|
0.031 0.000 | 0.064 |
0.000 0.000 | 0.000 |
0.056 0.011 | 0.092 |
0.204 0.174 | 0.226 |
0.000 0.000 | 0.000 |
0.000 0.000 | 0.000 |
0.249 0.227 | 0.266 |
0.460 0.438 | 0.477 |
| 2 spectra, EWLAPASR | 0.120 | 0.000 | 0.000 | 0.128 | 0.000 | 0.000 | 0.188 | 0.564 | ||
| 1 spectrum, AGGPVVVSDVVPGGPAEGR | 0.000 | 0.000 | 0.000 | 0.070 | 0.000 | 0.000 | 0.249 | 0.682 | ||
| 1 spectrum, VGDSFYIR | 0.000 | 0.000 | 0.000 | 0.000 | 0.000 | 0.334 | 0.354 | 0.312 | ||
| 1 spectrum, HALLDVTPSAIER | 0.218 | 0.000 | 0.090 | 0.000 | 0.000 | 0.298 | 0.370 | 0.024 | ||
| 1 spectrum, AEQLASLEAAQR | 0.133 | 0.000 | 0.060 | 0.205 | 0.000 | 0.000 | 0.216 | 0.386 | ||
| 1 spectrum, SEGQLTLLVLR | 0.000 | 0.000 | 0.000 | 0.000 | 0.000 | 0.418 | 0.266 | 0.316 | ||
| 1 spectrum, AIAEPESPGESR | 0.000 | 0.000 | 0.111 | 0.530 | 0.000 | 0.000 | 0.128 | 0.231 | ||
| 3 spectra, GVIPNQSR | 0.207 | 0.000 | 0.000 | 0.058 | 0.000 | 0.000 | 0.154 | 0.581 | ||
| 3 spectra, AAGLGPGASTGSNPR | 0.000 | 0.000 | 0.000 | 0.099 | 0.000 | 0.000 | 0.176 | 0.725 | ||
| 2 spectra, GDVFHVVDTLYR | 0.085 | 0.000 | 0.000 | 0.167 | 0.000 | 0.000 | 0.293 | 0.455 |
| Plot | Mito | Lyso or Perox | ER | Golgi | PM | Cytosol | Nucleus | ||||||
| Expt B |
3 peptides |
4 spectra |
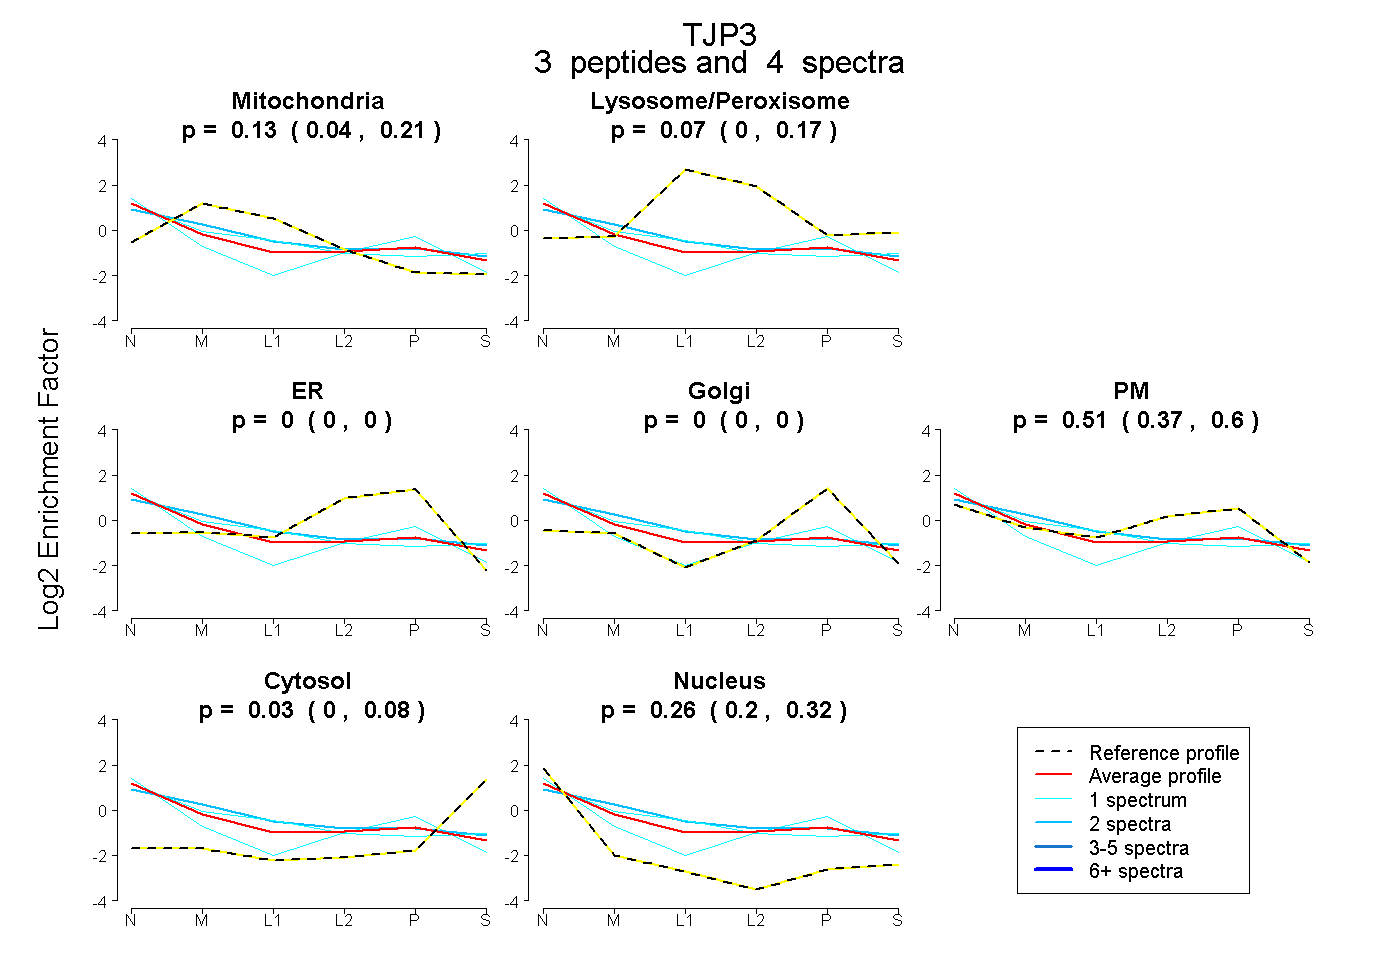 |
0.134 0.041 | 0.209 |
0.067 0.000 | 0.166 |
0.000 0.000 | 0.000 |
0.000 0.000 | 0.000 |
0.508 0.367 | 0.601 |
0.032 0.000 | 0.081 |
0.260 0.202 | 0.318 |
|||
| Plot | Lyso | Other | |||||||||||
| Expt C |
4 peptides |
8 spectra |
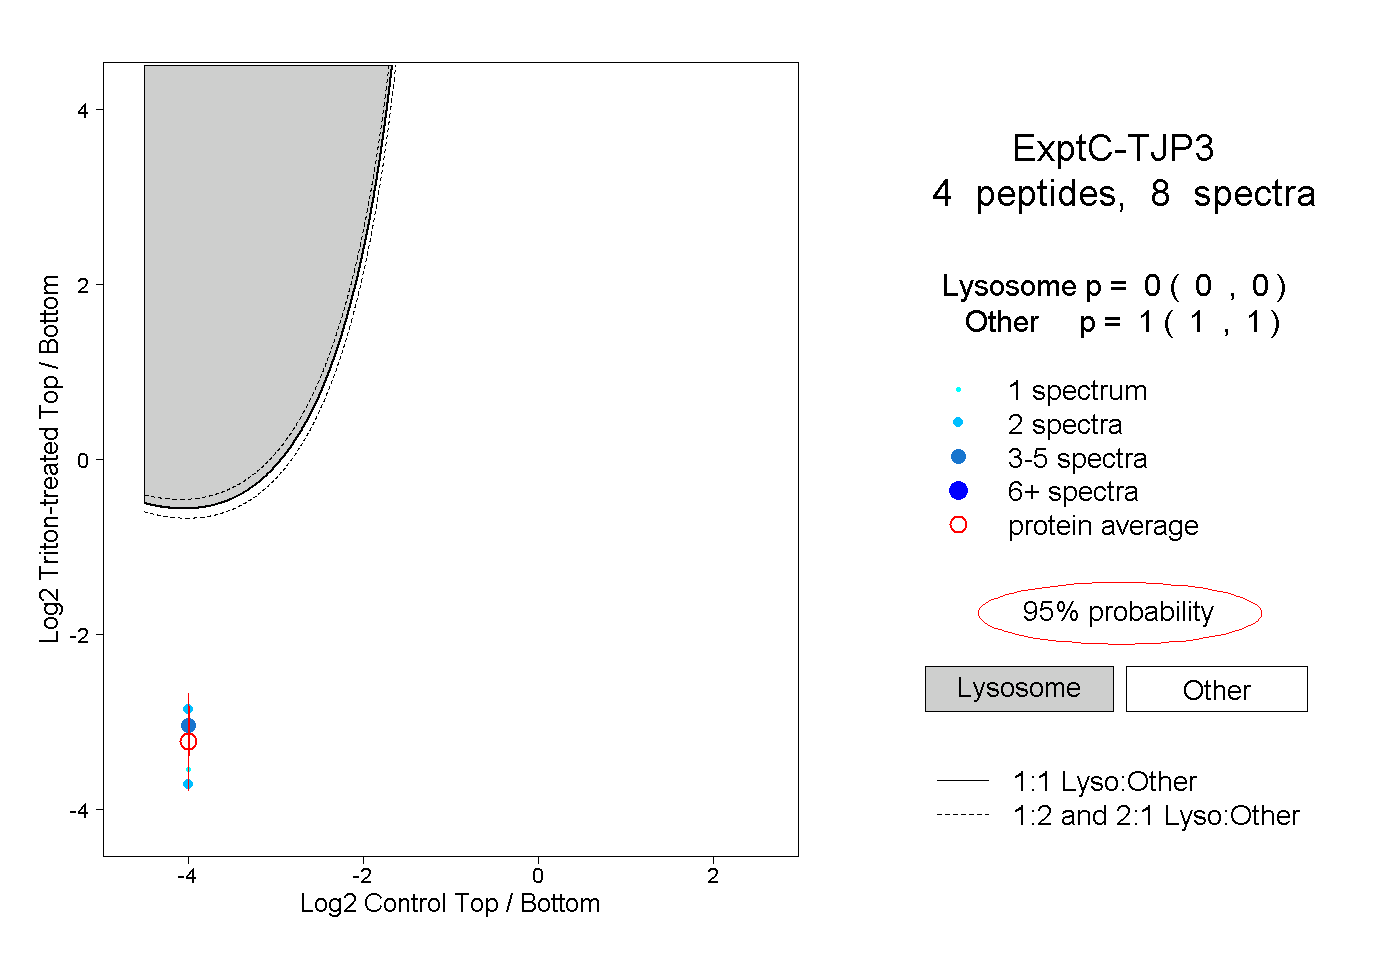 |
0.000 0.000 | 0.000 |
1.000 1.000 | 1.000 |