 4
4peptides
spectra
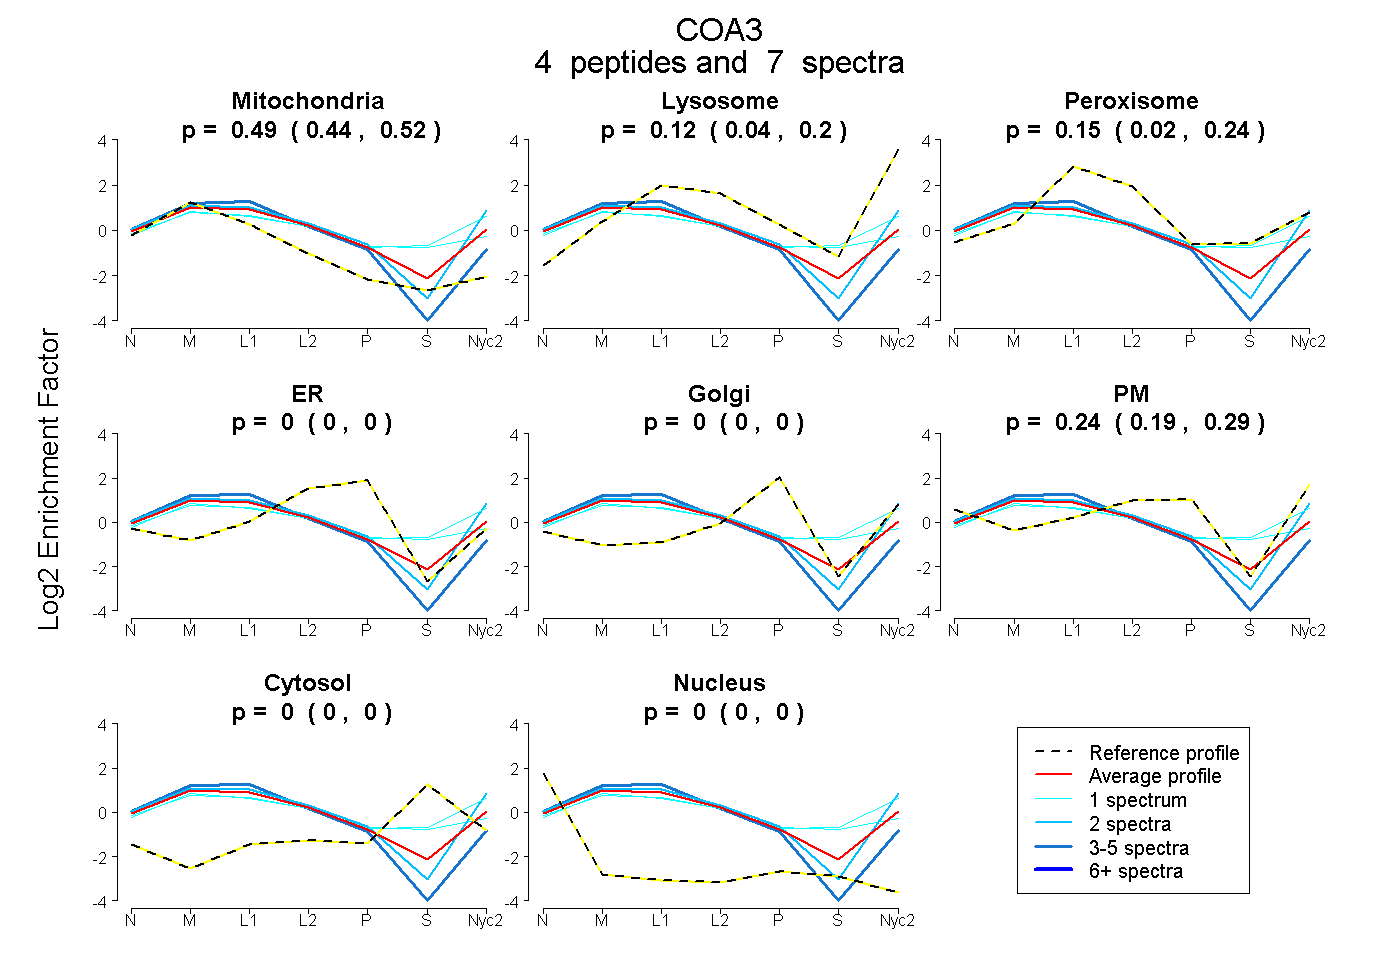
0.444 | 0.518
0.037 | 0.200
0.024 | 0.244
0.000 | 0.000
0.000 | 0.000
0.192 | 0.285
0.000 | 0.000
0.000 | 0.000
4peptides
spectra
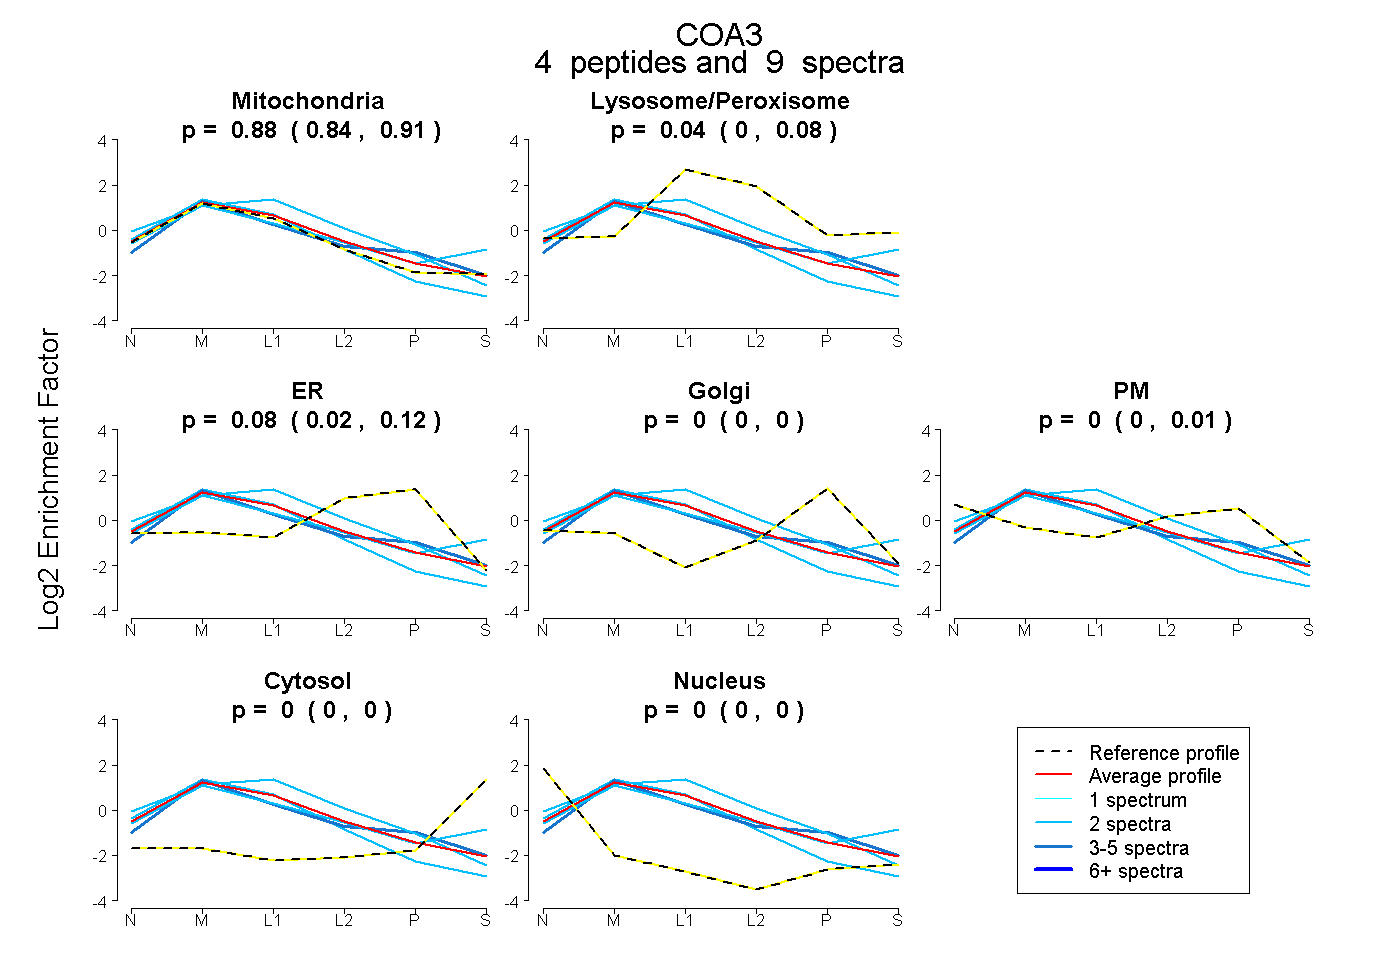
0.840 | 0.912
0.000 | 0.082
0.022 | 0.117
0.000 | 0.000
0.000 | 0.007
0.000 | 0.000
0.000 | 0.000
4peptides
spectra
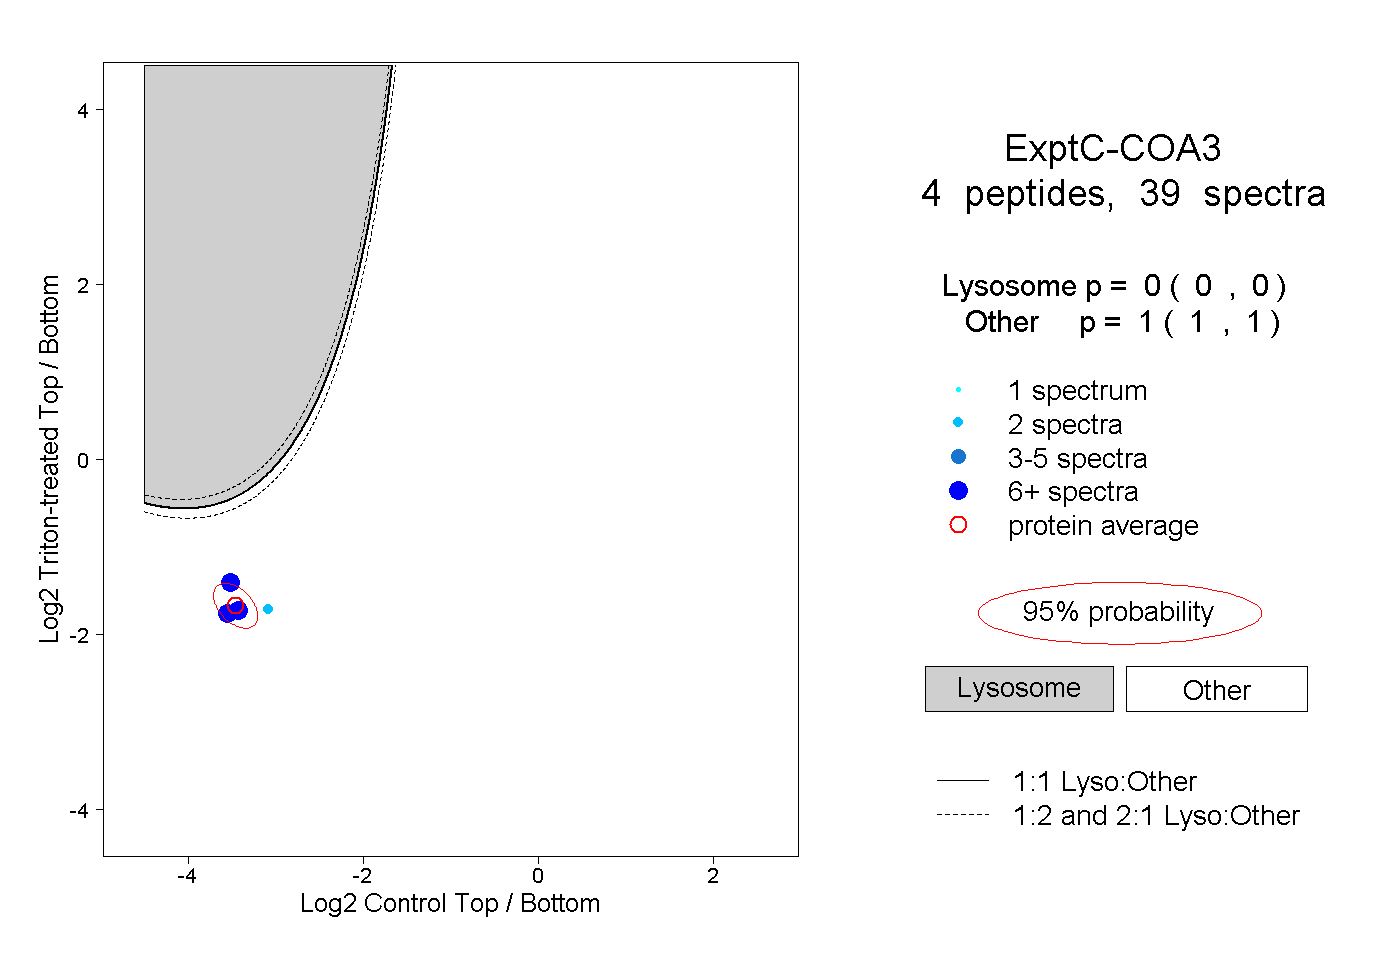
0.000 | 0.000
1.000 | 1.000
2peptides
spectra
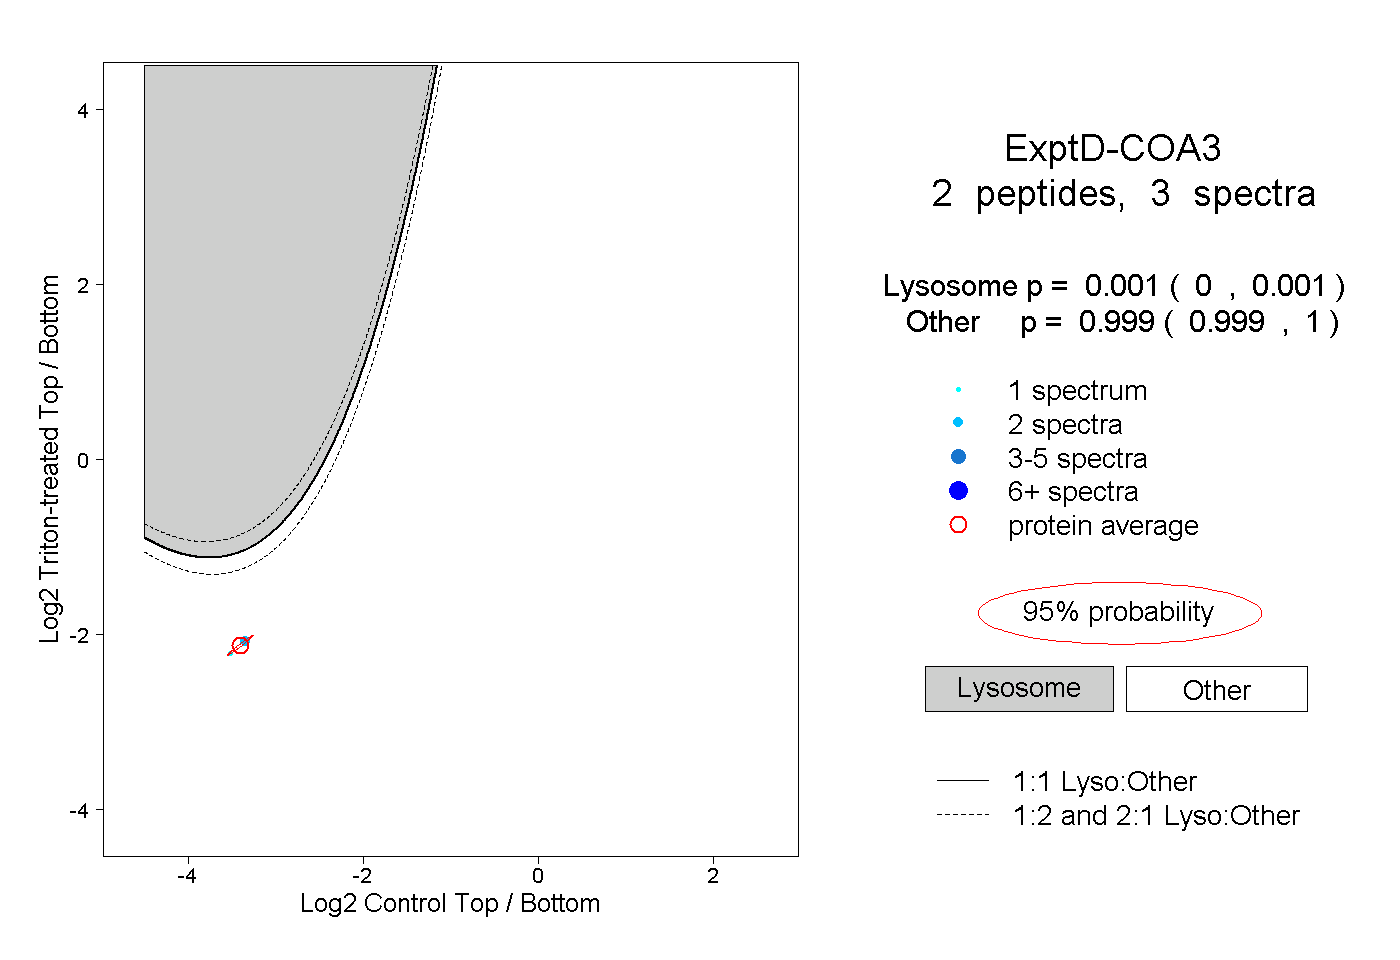
0.000 | 0.001
0.999 | 1.000