 4
4peptides
spectra
0.444 | 0.518
0.037 | 0.200
0.024 | 0.244
0.000 | 0.000
0.000 | 0.000
0.192 | 0.285
0.000 | 0.000
0.000 | 0.000
| Plot | Mito | Lyso | Perox | ER | Golgi | PM | Cytosol | Nucleus | |||||
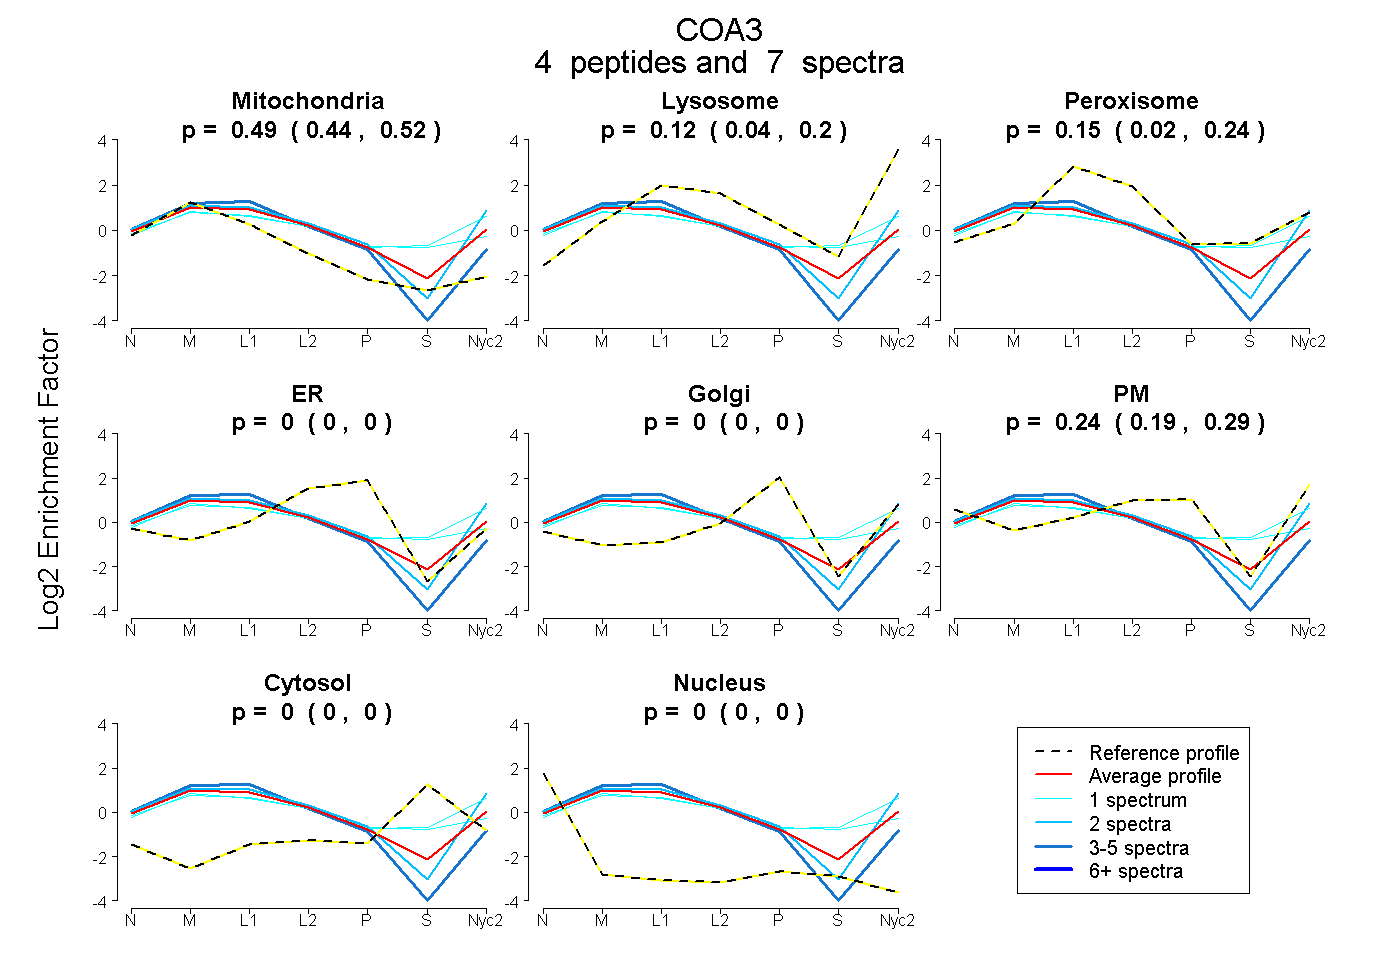
| Expt A |
4 peptides |
7 spectra |
|
0.487 0.444 | 0.518 |
0.124 0.037 | 0.200 |
0.145 0.024 | 0.244 |
0.000 0.000 | 0.000 |
0.000 0.000 | 0.000 |
0.244 0.192 | 0.285 |
0.000 0.000 | 0.000 |
0.000 0.000 | 0.000 |
| 3 spectra, LTPAQLQFMR | 0.630 | 0.020 | 0.031 | 0.109 | 0.000 | 0.210 | 0.000 | 0.000 | ||
| 1 spectrum, SGNAPFAQR | 0.305 | 0.231 | 0.195 | 0.000 | 0.000 | 0.122 | 0.147 | 0.000 | ||
| 2 spectra, QVQLAQWQK | 0.428 | 0.244 | 0.000 | 0.000 | 0.000 | 0.328 | 0.000 | 0.000 | ||
| 1 spectrum, FLDELEDEAK | 0.363 | 0.034 | 0.331 | 0.000 | 0.030 | 0.101 | 0.141 | 0.000 |
| Plot | Mito | Lyso or Perox | ER | Golgi | PM | Cytosol | Nucleus | ||||||
| Expt B |
4 peptides |
9 spectra |
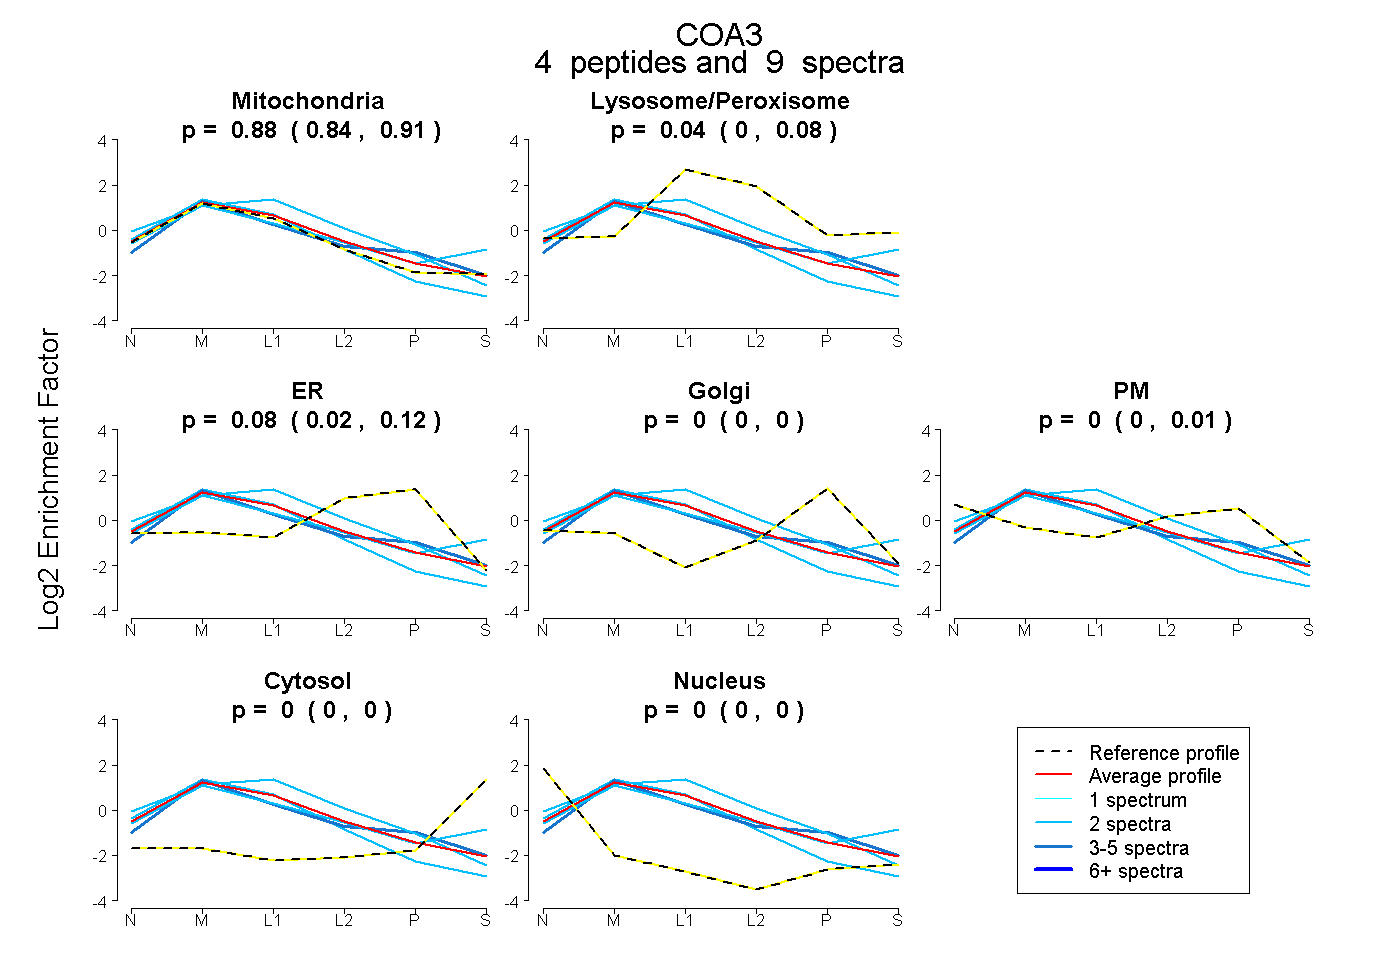 |
0.881 0.840 | 0.912 |
0.043 0.000 | 0.082 |
0.076 0.022 | 0.117 |
0.000 0.000 | 0.000 |
0.000 0.000 | 0.007 |
0.000 0.000 | 0.000 |
0.000 0.000 | 0.000 |
|||
| Plot | Lyso | Other | |||||||||||
| Expt C |
4 peptides |
39 spectra |
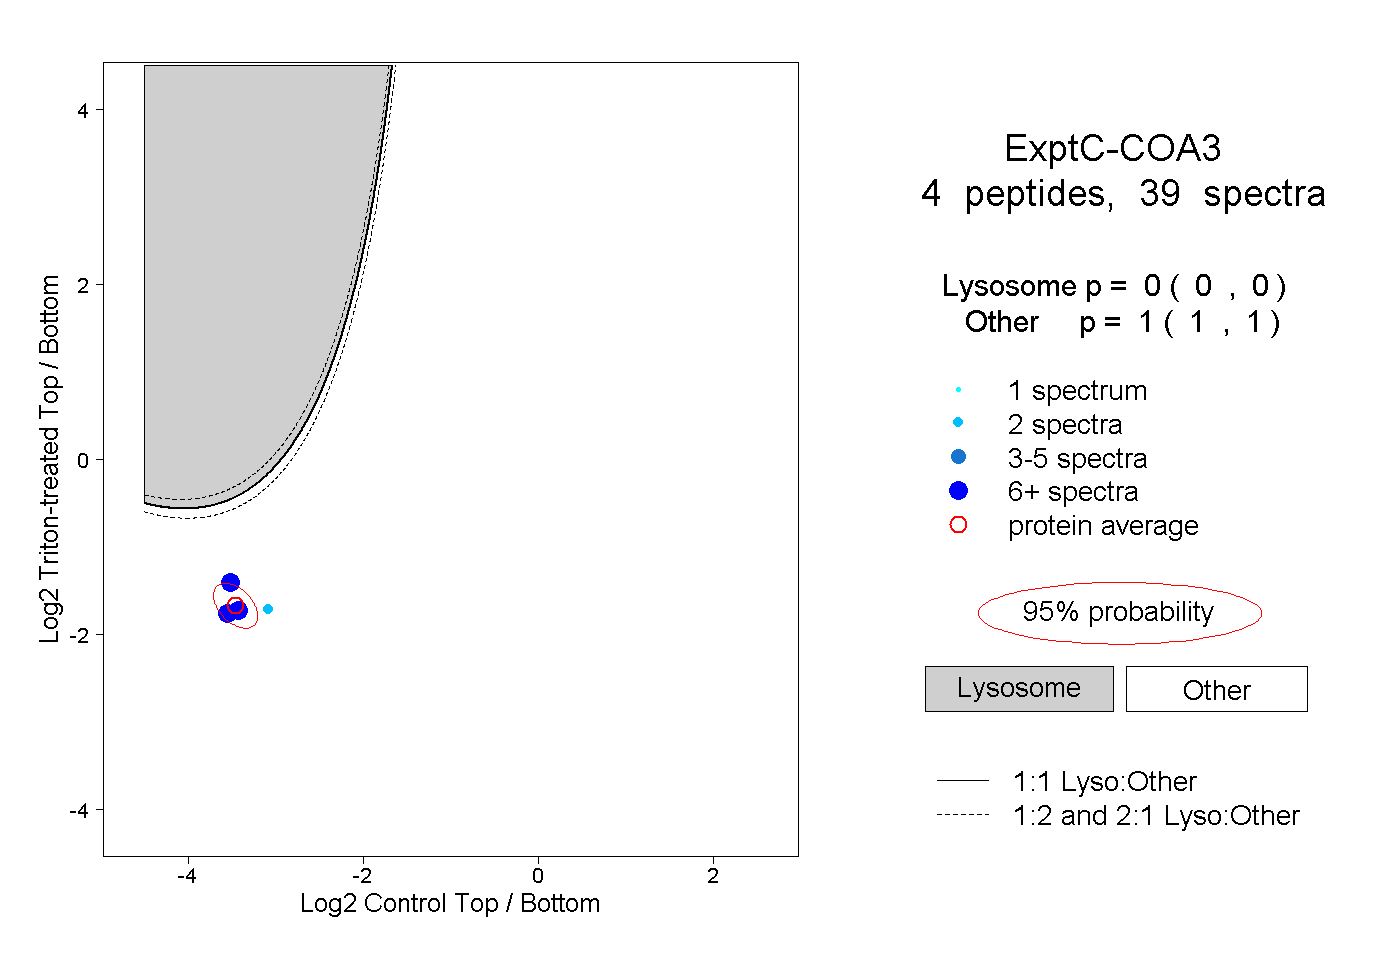 |
0.000 0.000 | 0.000 |
1.000 1.000 | 1.000 |
||||||||
| Plot | Lyso | Other | |||||||||||
| Expt D |
2 peptides |
3 spectra |
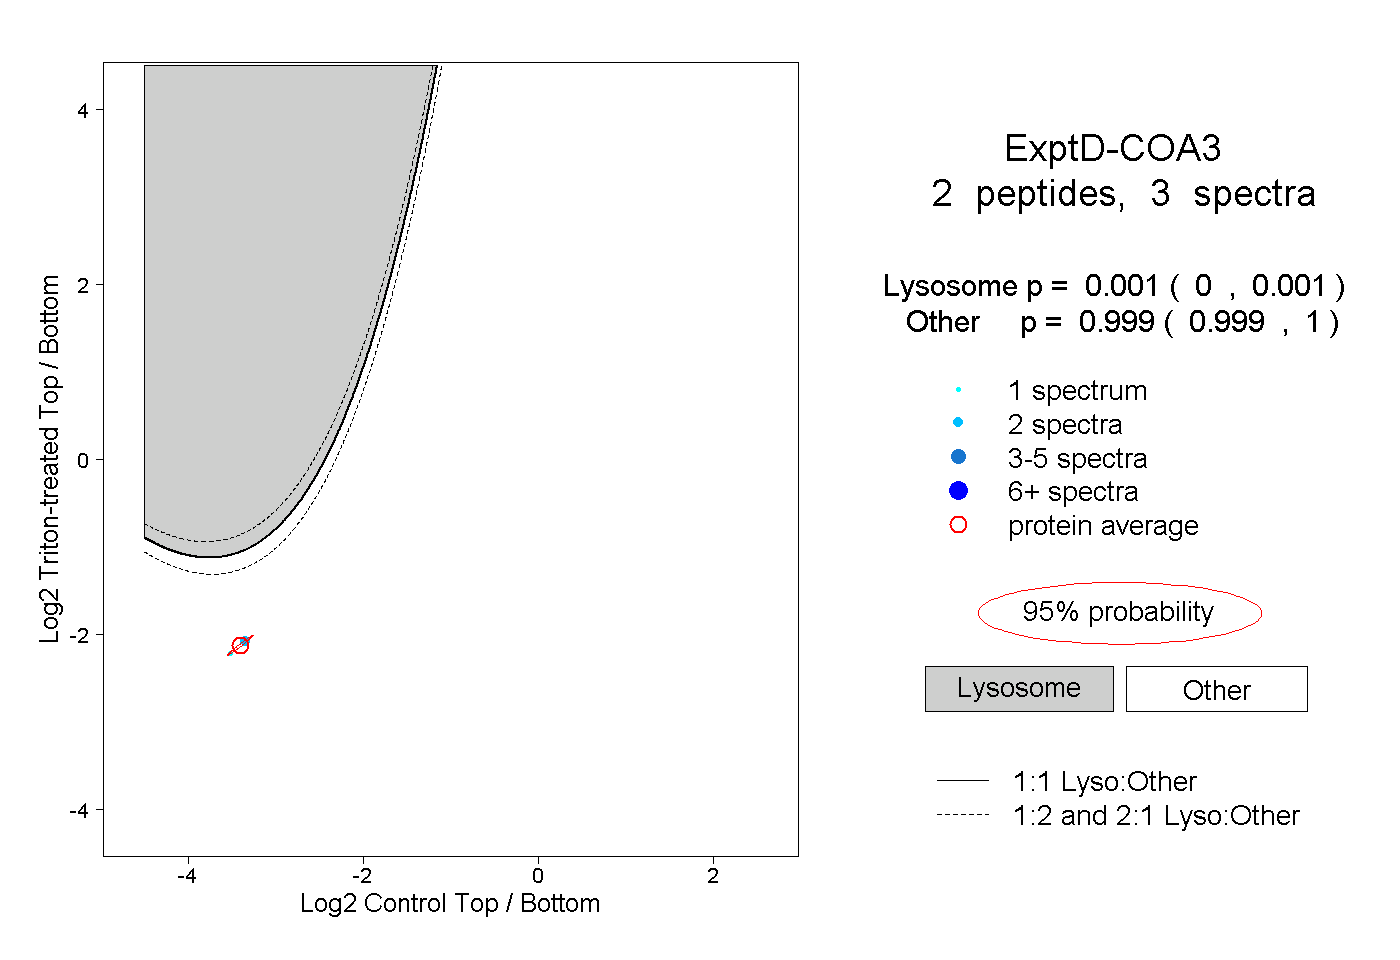 |
0.001 0.000 | 0.001 |
0.999 0.999 | 1.000 |