 5
5peptides
spectra
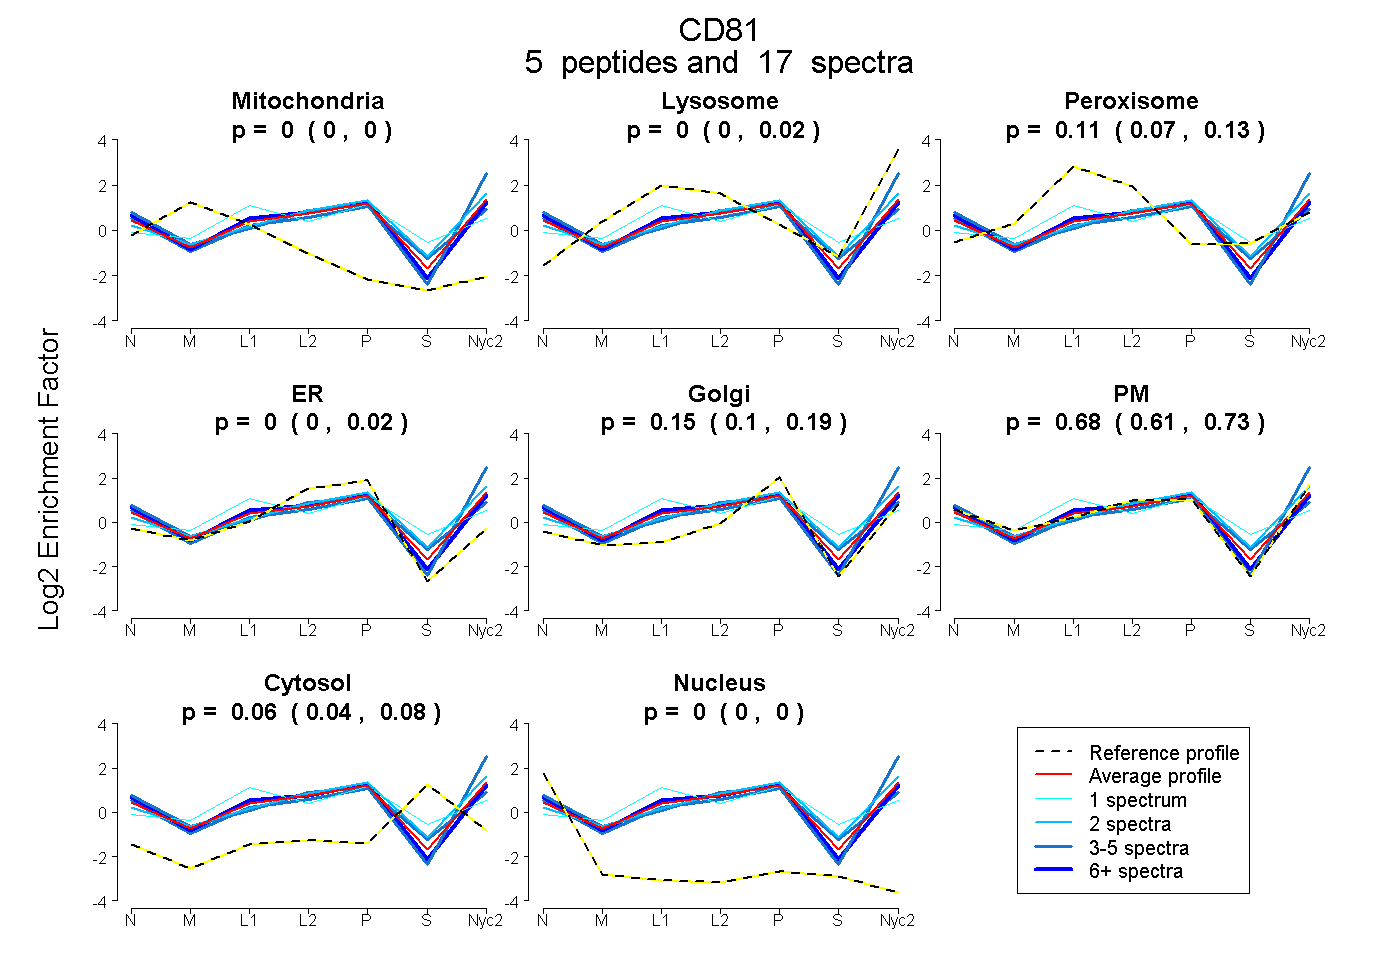
0.000 | 0.000
0.000 | 0.018
0.069 | 0.134
0.000 | 0.018
0.097 | 0.191
0.608 | 0.734
0.044 | 0.077
0.000 | 0.000
4peptides
spectra
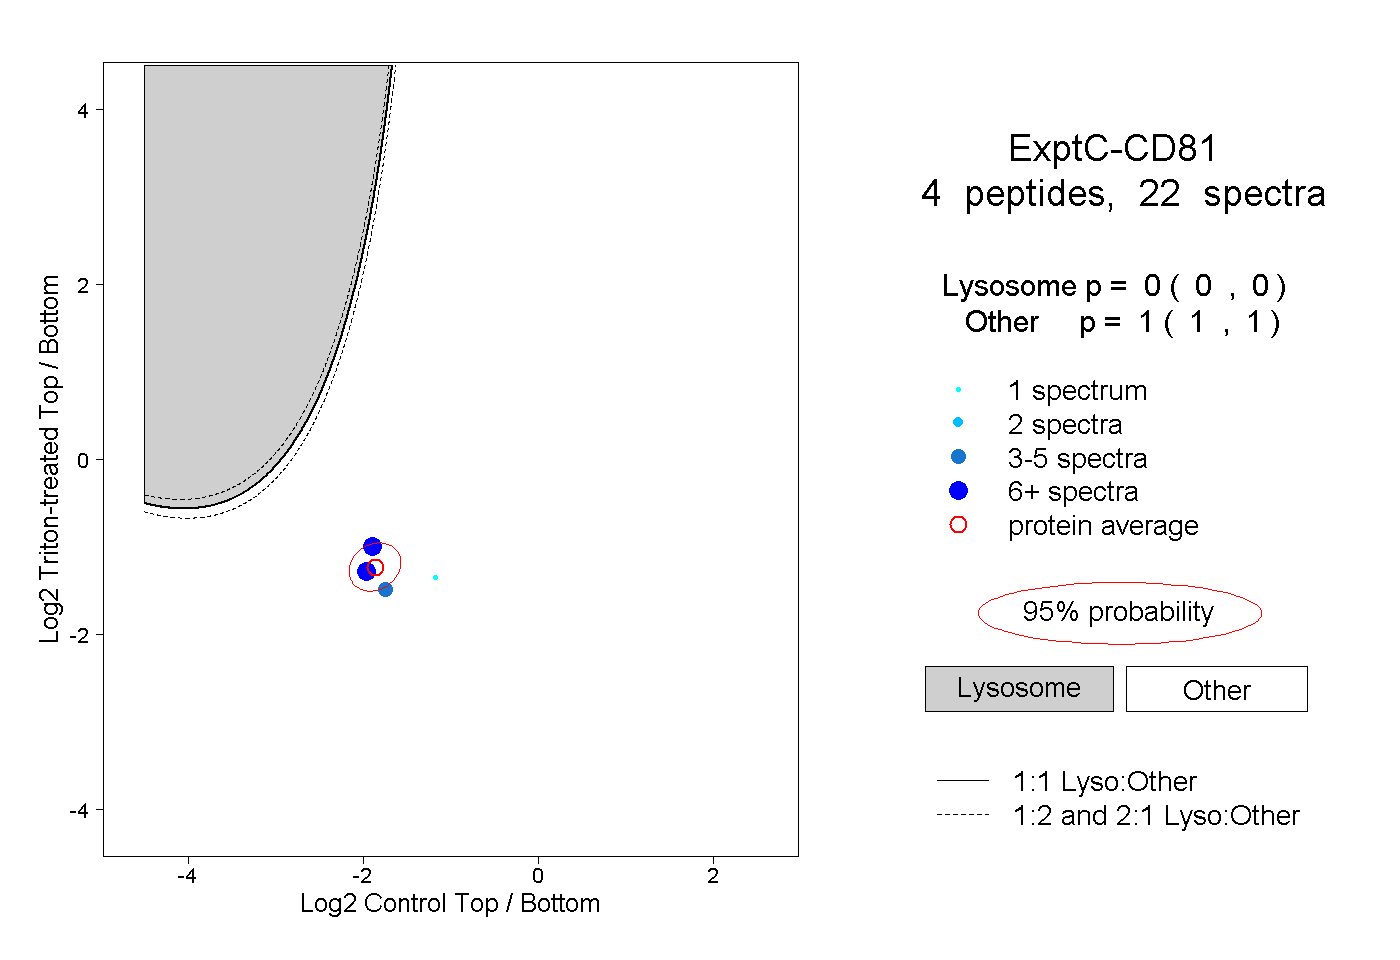
0.000 | 0.000
1.000 | 1.000
2peptides
spectra
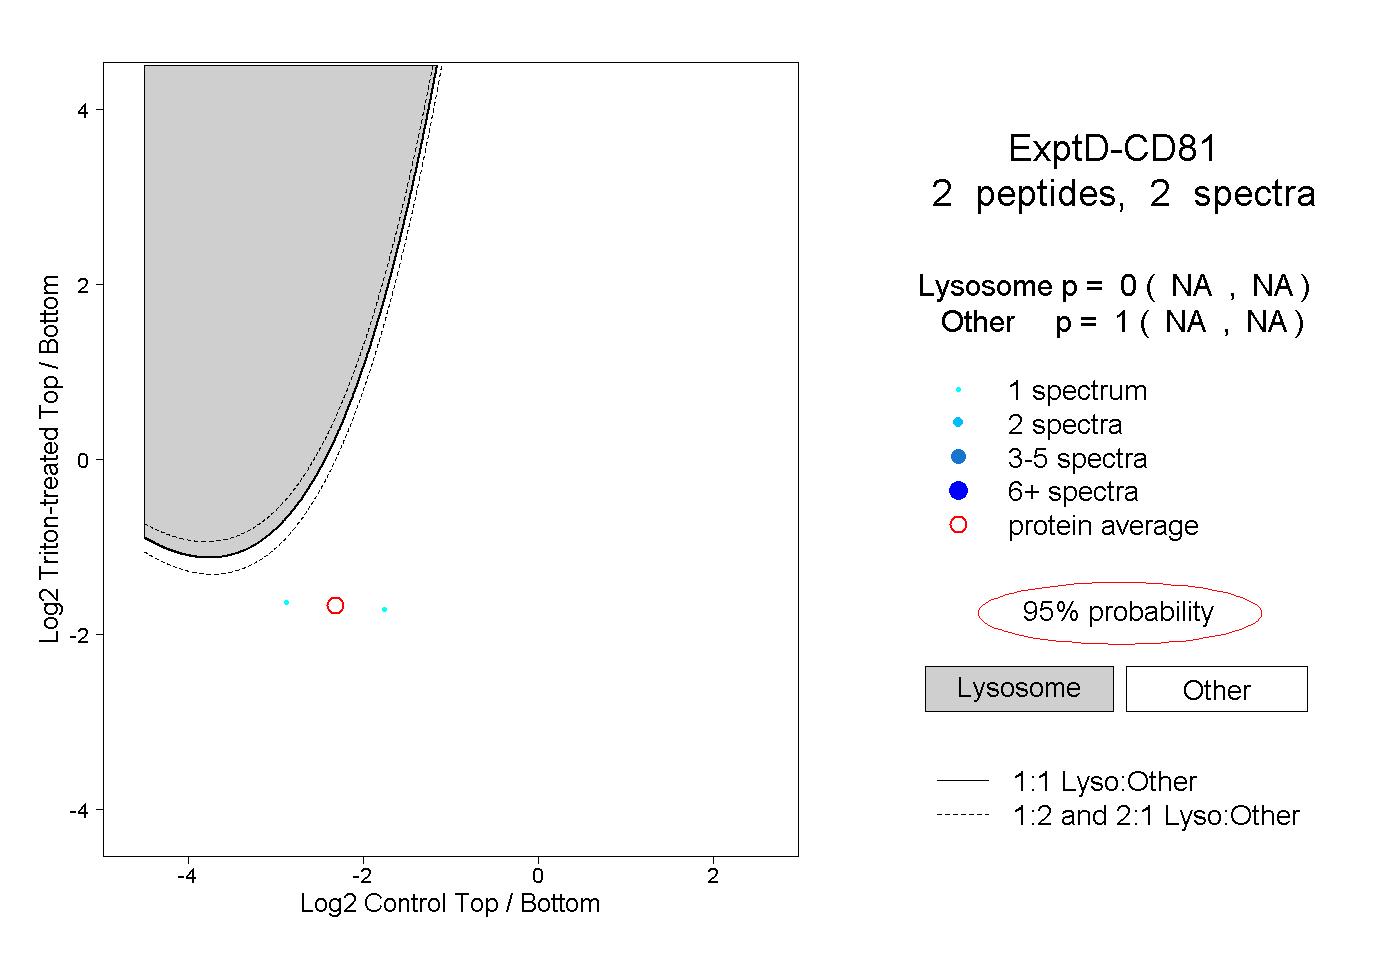
NA | NA
NA | NA