 5
5peptides
spectra
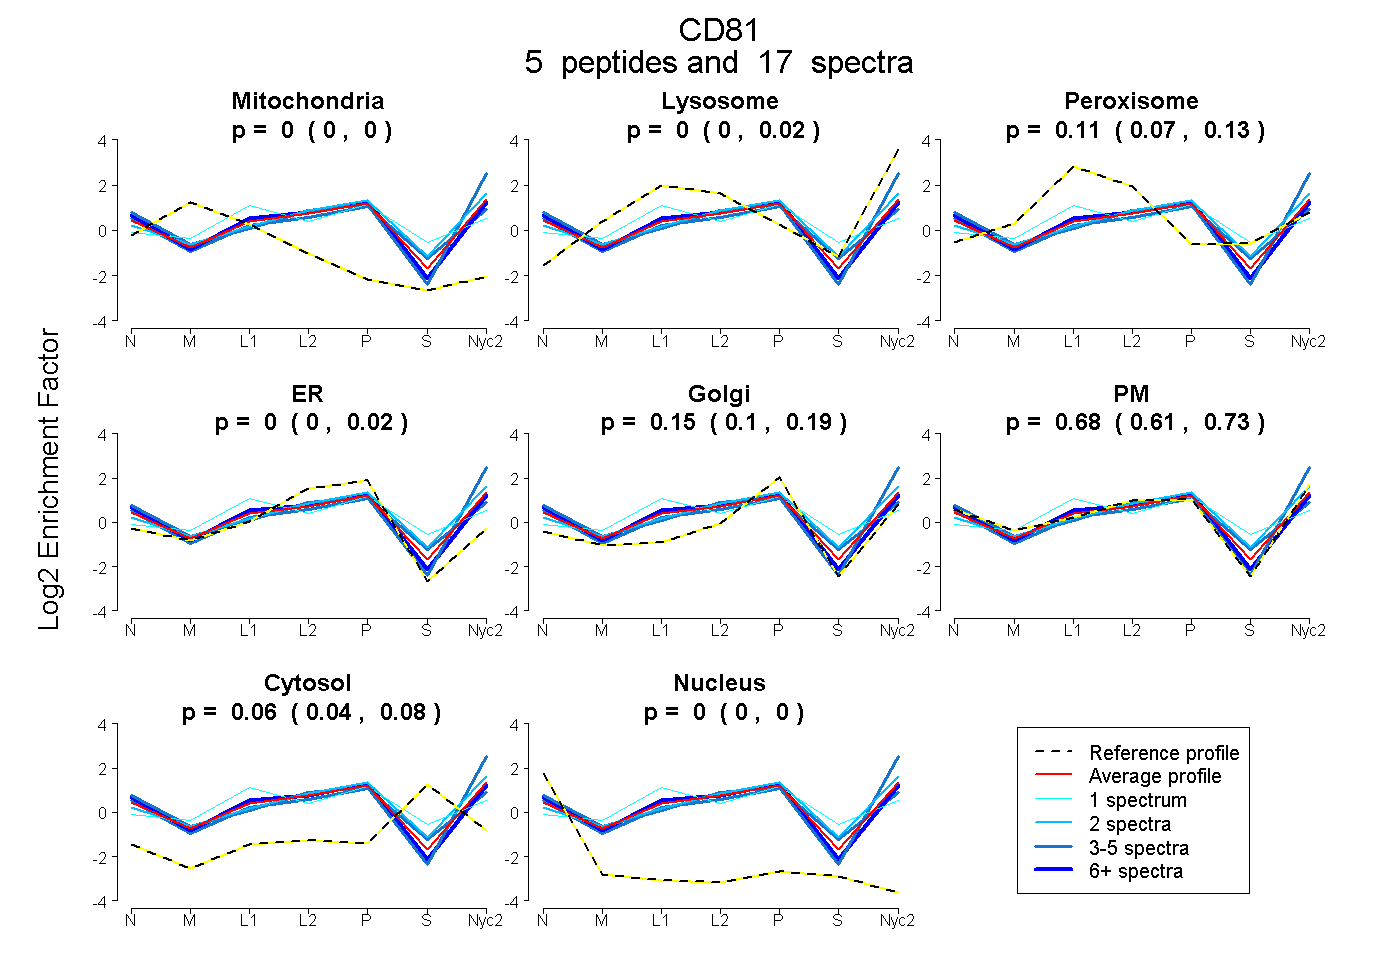
0.000 | 0.000
0.000 | 0.018
0.069 | 0.134
0.000 | 0.018
0.097 | 0.191
0.608 | 0.734
0.044 | 0.077
0.000 | 0.000
| Plot | Mito | Lyso | Perox | ER | Golgi | PM | Cytosol | Nucleus | |||||
| Expt A |
5 peptides |
17 spectra |
|
0.000 0.000 | 0.000 |
0.000 0.000 | 0.018 |
0.110 0.069 | 0.134 |
0.000 0.000 | 0.018 |
0.151 0.097 | 0.191 |
0.677 0.608 | 0.734 |
0.062 0.044 | 0.077 |
0.000 0.000 | 0.000 |
| 1 spectrum, TFHETLNCCGSNTLTTLTTTVLR | 0.000 | 0.000 | 0.474 | 0.000 | 0.441 | 0.000 | 0.085 | 0.000 | ||
| 4 spectra, EDCHQK | 0.000 | 0.000 | 0.051 | 0.104 | 0.005 | 0.655 | 0.185 | 0.000 | ||
| 4 spectra, IDELFSGK | 0.000 | 0.047 | 0.000 | 0.000 | 0.000 | 0.953 | 0.000 | 0.000 | ||
| 2 spectra, QFYDQALQQAVMDDDANNAK | 0.000 | 0.141 | 0.024 | 0.000 | 0.158 | 0.568 | 0.109 | 0.000 | ||
| 6 spectra, GVEGCTK | 0.000 | 0.000 | 0.086 | 0.082 | 0.117 | 0.696 | 0.000 | 0.019 |
| Plot | Lyso | Other | |||||||||||
| Expt C |
4 peptides |
22 spectra |
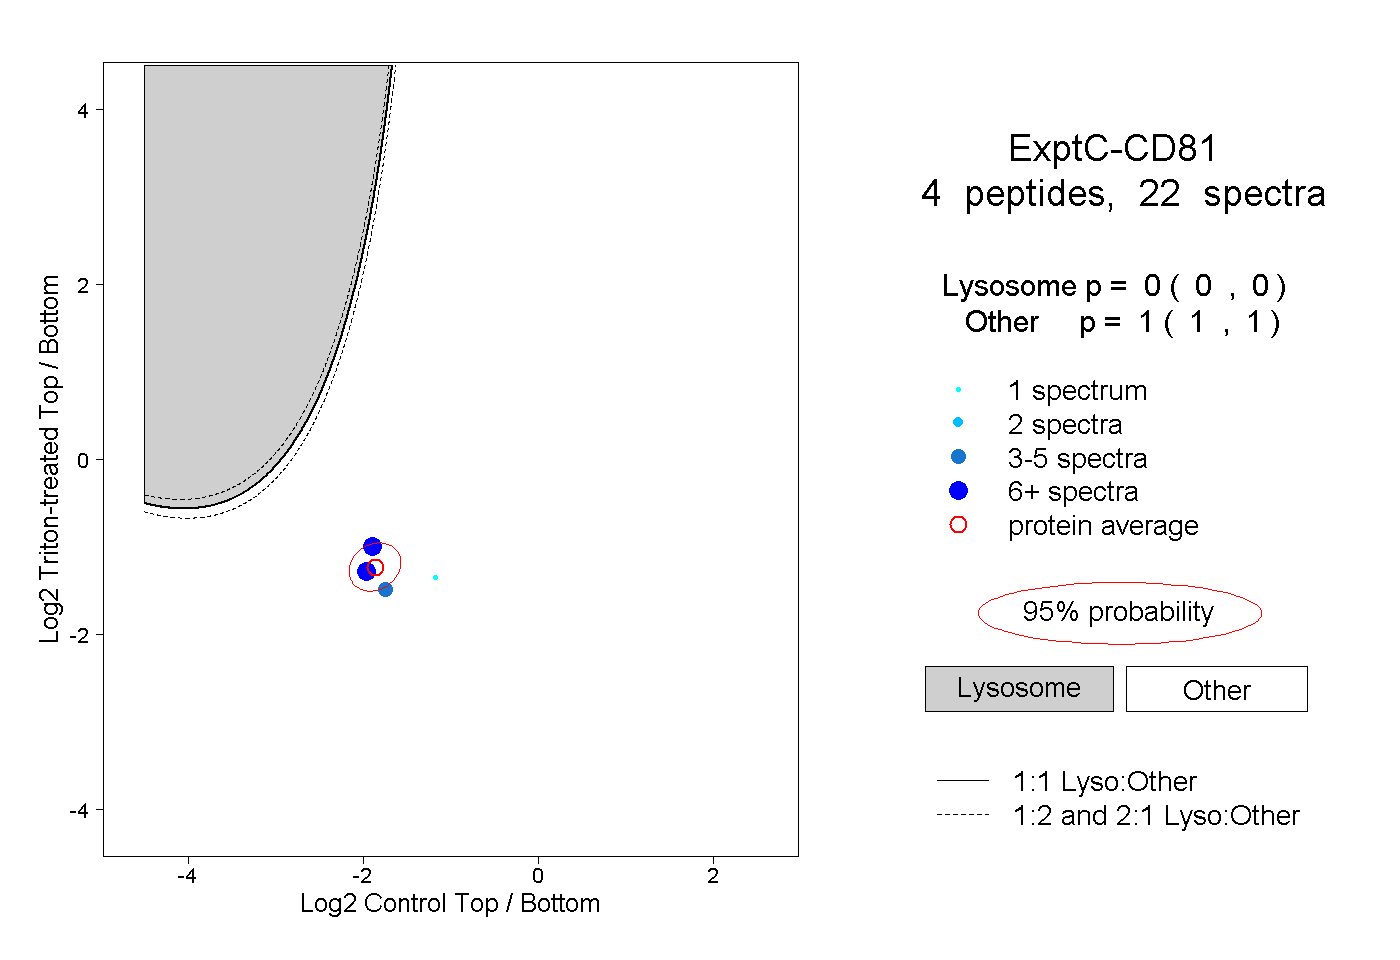 |
0.000 0.000 | 0.000 |
1.000 1.000 | 1.000 |
||||||||
| Plot | Lyso | Other | |||||||||||
| Expt D |
2 peptides |
2 spectra |
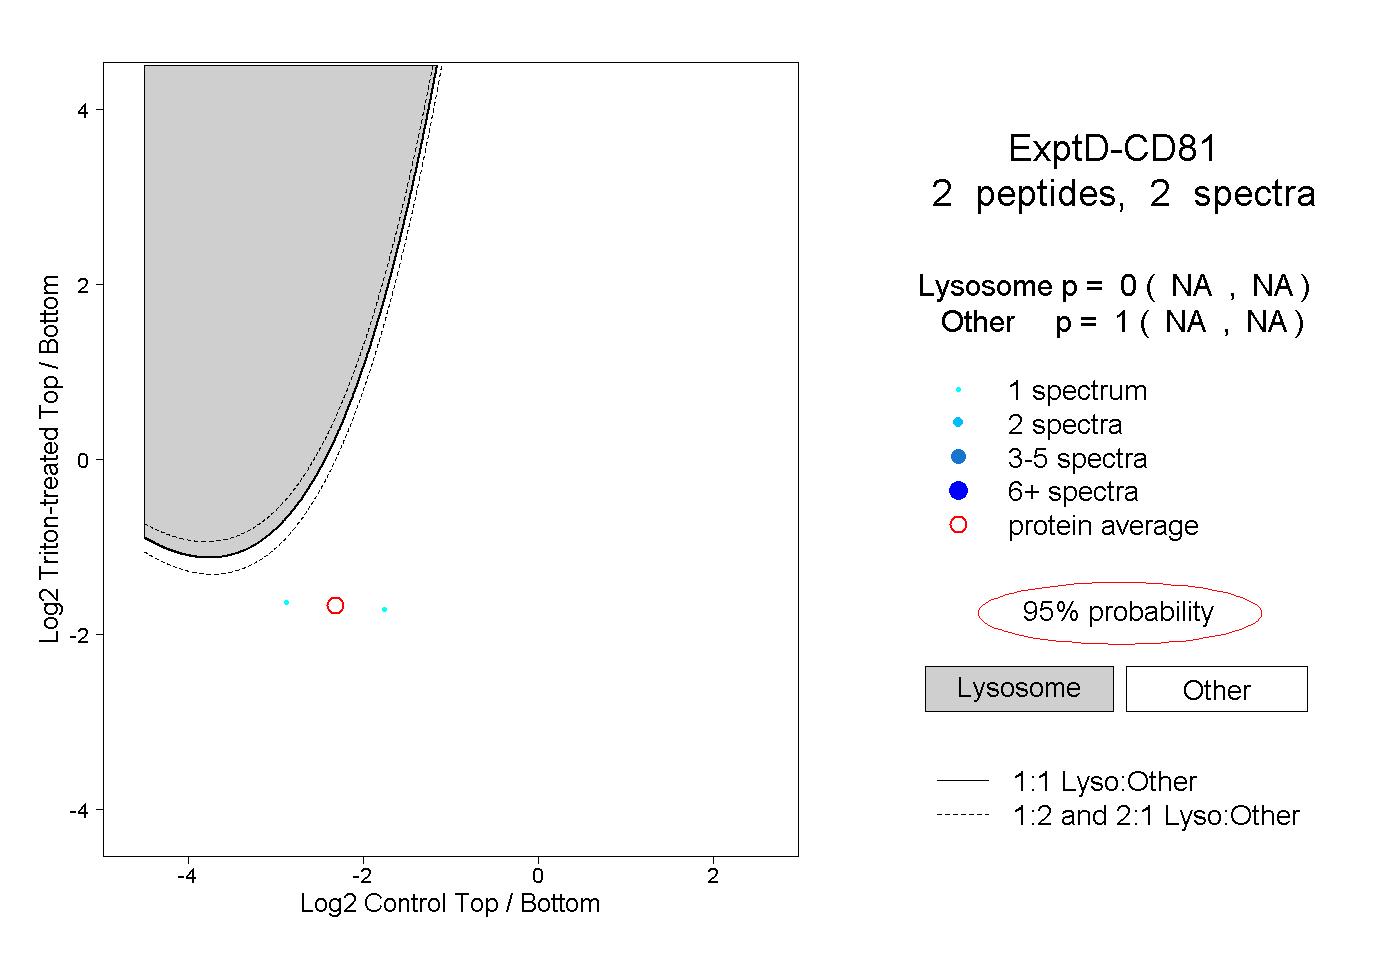 |
0.000 NA | NA |
1.000 NA | NA |