 9
9peptides
spectra
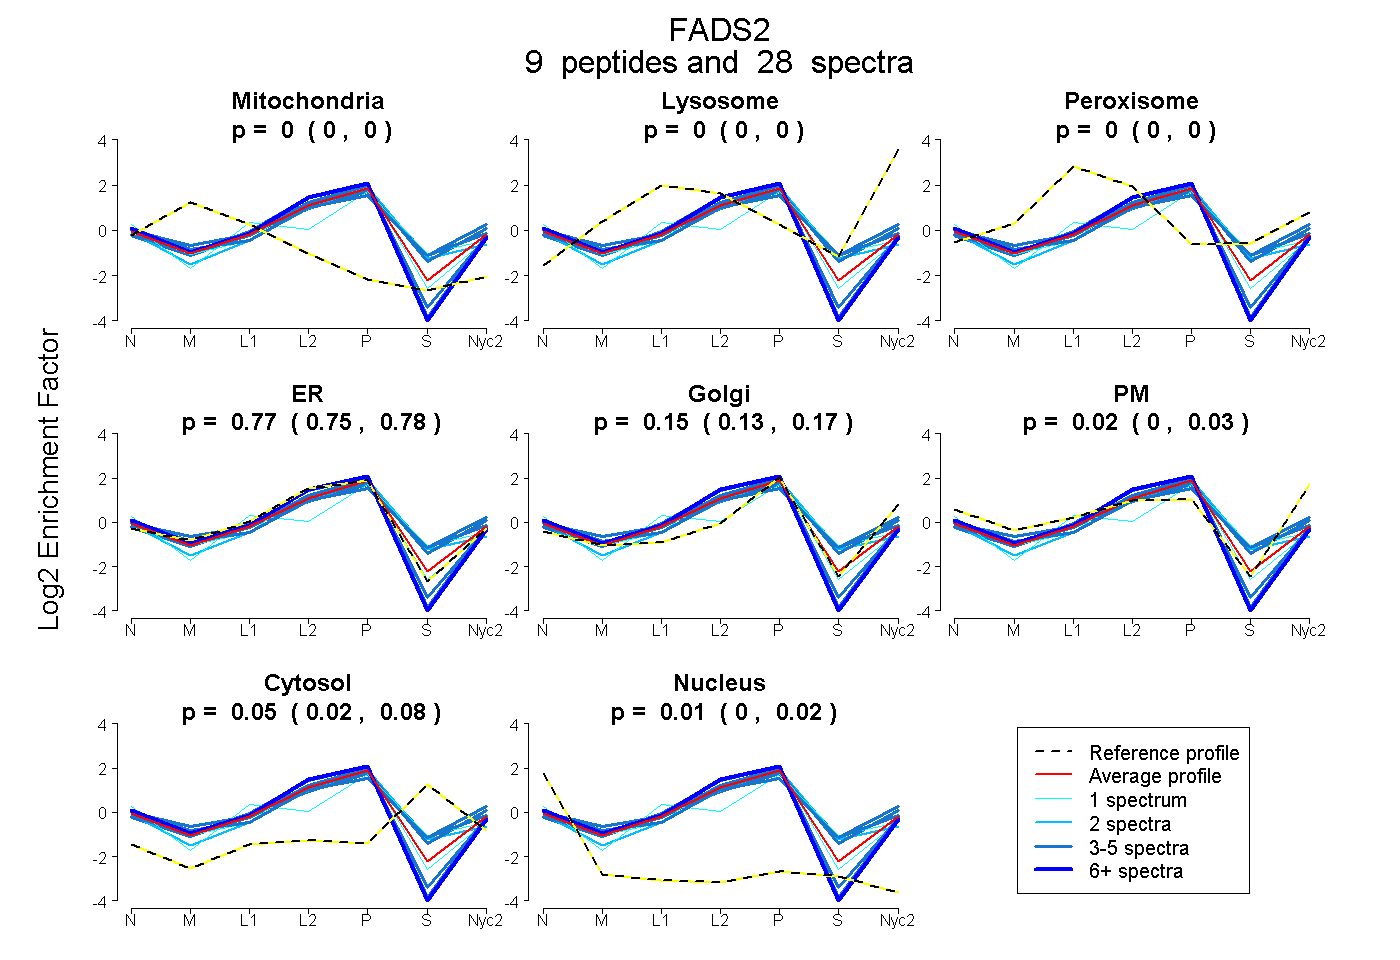
0.000 | 0.000
0.000 | 0.000
0.000 | 0.000
0.748 | 0.784
0.129 | 0.171
0.005 | 0.028
0.024 | 0.075
0.000 | 0.024
5peptides
spectra
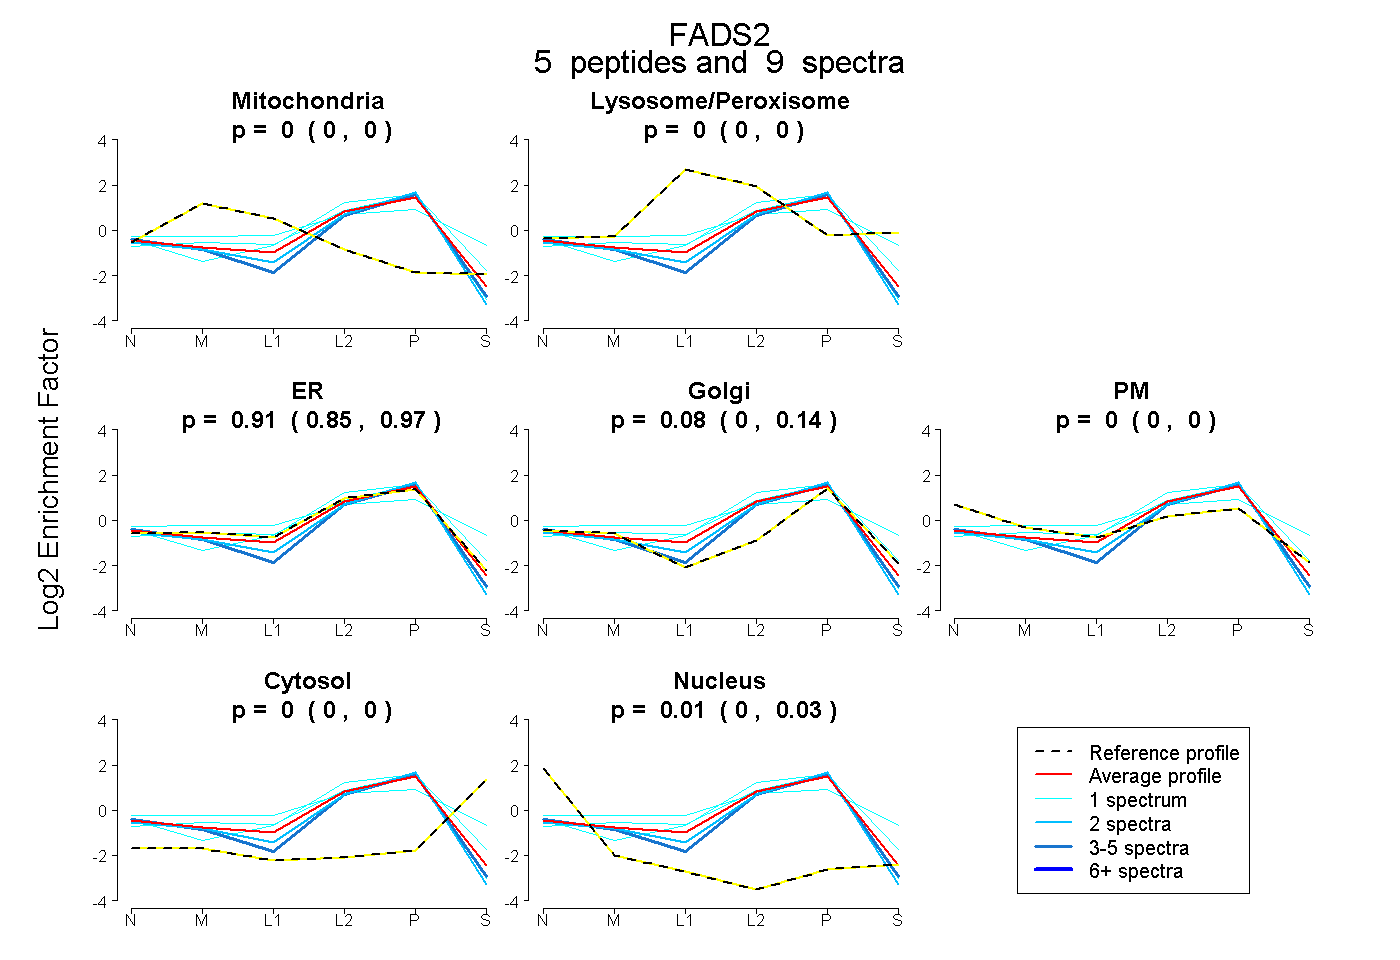
0.000 | 0.000
0.000 | 0.000
0.850 | 0.967
0.000 | 0.138
0.000 | 0.000
0.000 | 0.000
0.000 | 0.027
11peptides
spectra
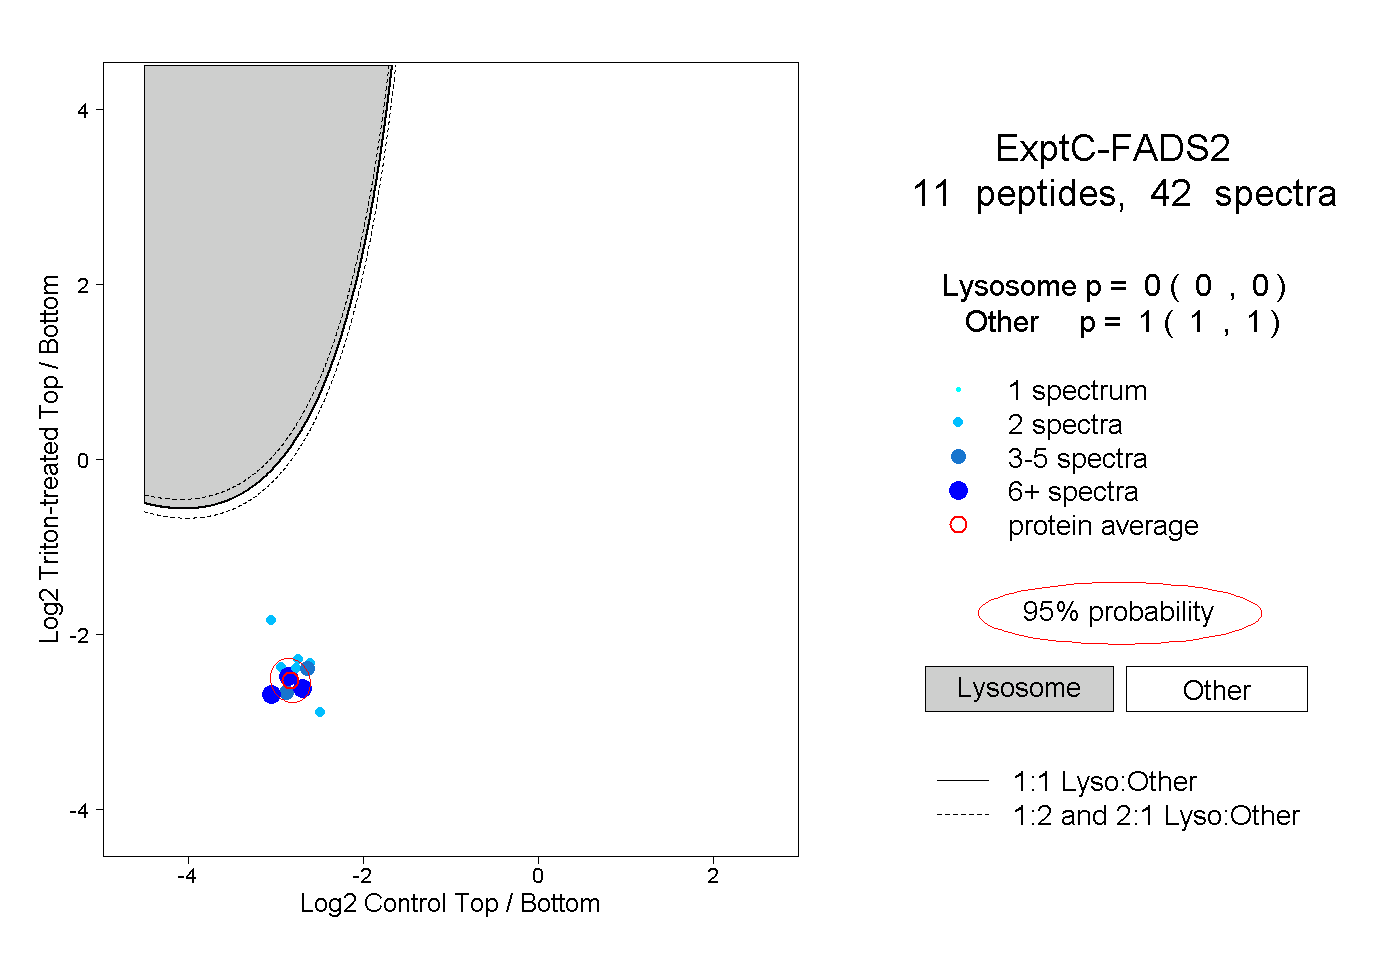
0.000 | 0.000
1.000 | 1.000
3peptides
spectra
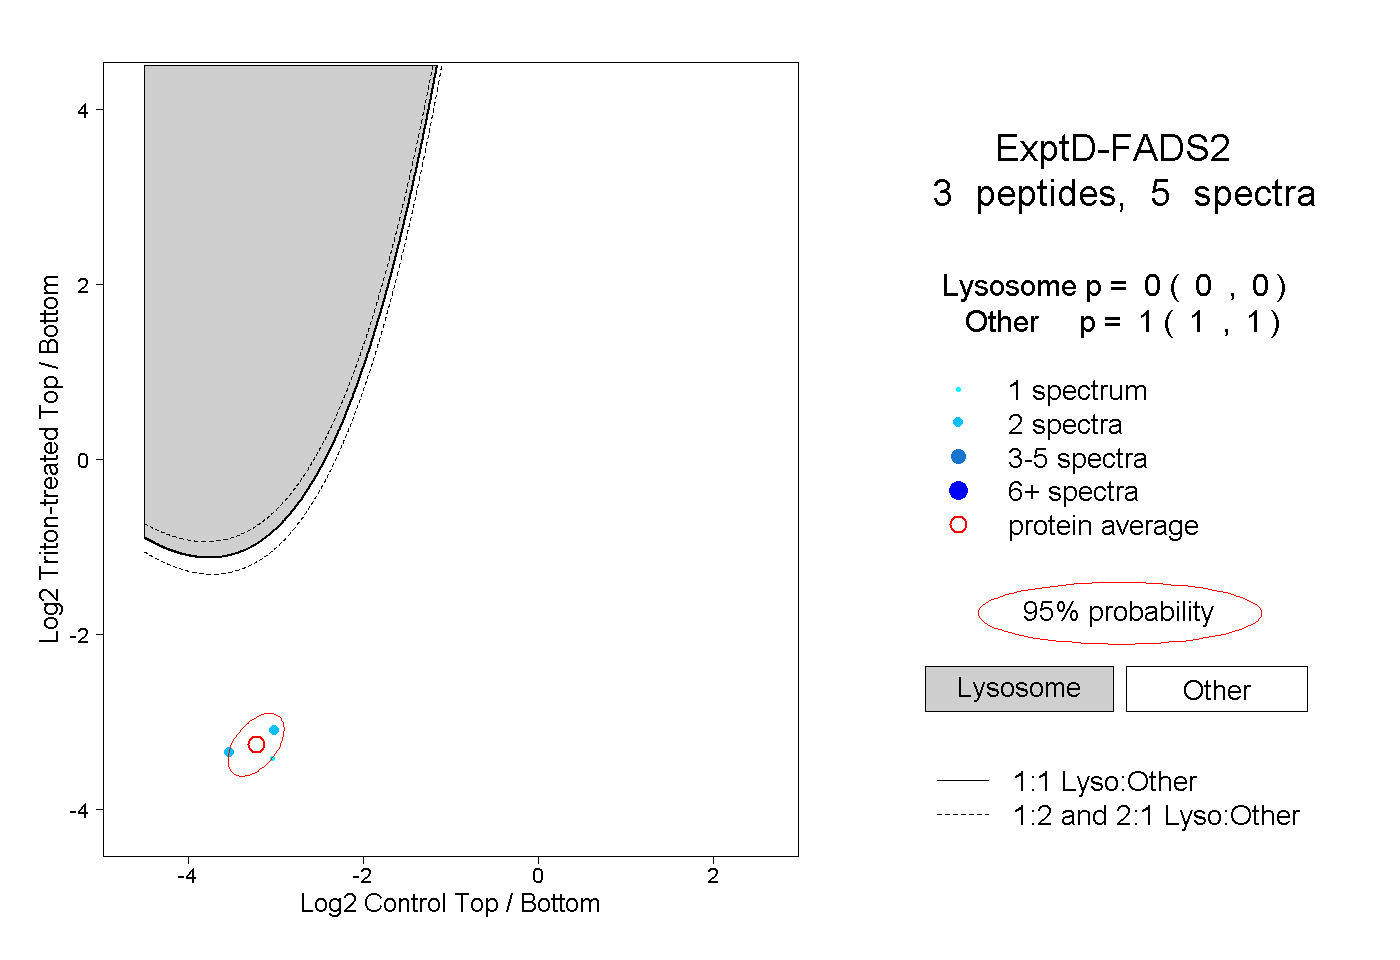
0.000 | 0.000
1.000 | 1.000