 9
9peptides
spectra
0.000 | 0.000
0.000 | 0.000
0.000 | 0.000
0.748 | 0.784
0.129 | 0.171
0.005 | 0.028
0.024 | 0.075
0.000 | 0.024
| Plot | Mito | Lyso | Perox | ER | Golgi | PM | Cytosol | Nucleus | |||||
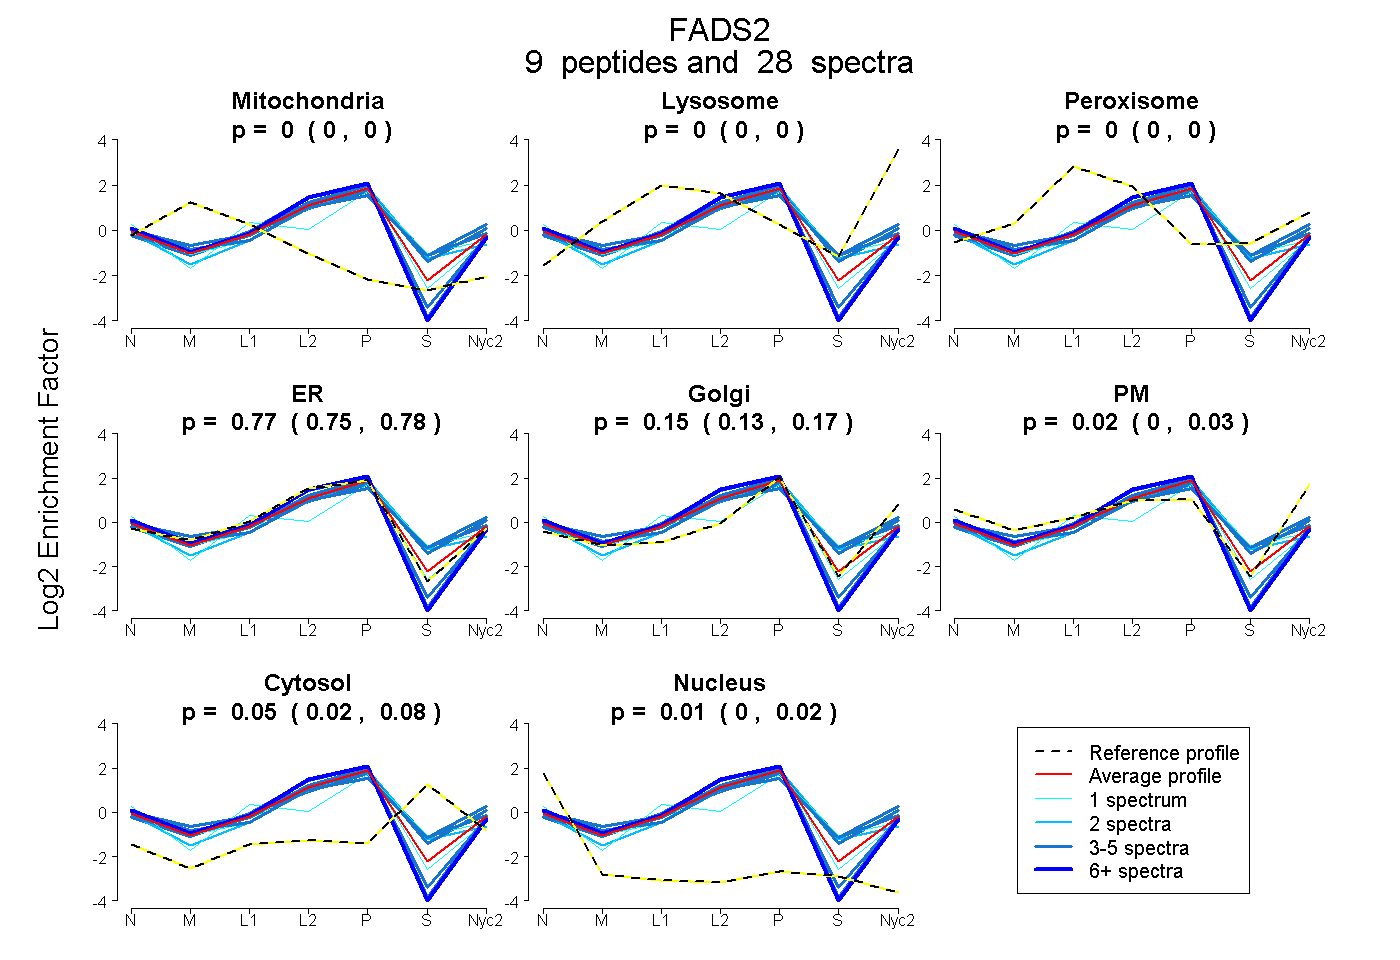
| Expt A |
9 peptides |
28 spectra |
|
0.000 0.000 | 0.000 |
0.000 0.000 | 0.000 |
0.000 0.000 | 0.000 |
0.768 0.748 | 0.784 |
0.151 0.129 | 0.171 |
0.017 0.005 | 0.028 |
0.052 0.024 | 0.075 |
0.012 0.000 | 0.024 |
| 6 spectra, WLVIDR | 0.000 | 0.000 | 0.000 | 0.975 | 0.000 | 0.000 | 0.000 | 0.025 | ||
| 3 spectra, WEEIQK | 0.000 | 0.000 | 0.000 | 0.631 | 0.000 | 0.156 | 0.213 | 0.000 | ||
| 3 spectra, ALLDIVSSLK | 0.000 | 0.046 | 0.060 | 0.499 | 0.233 | 0.004 | 0.158 | 0.000 | ||
| 3 spectra, IAPLVK | 0.000 | 0.000 | 0.000 | 0.983 | 0.001 | 0.000 | 0.000 | 0.017 | ||
| 1 spectrum, SIWNHIVHK | 0.000 | 0.000 | 0.061 | 0.475 | 0.218 | 0.000 | 0.228 | 0.018 | ||
| 4 spectra, SSQITEDFR | 0.000 | 0.000 | 0.000 | 0.893 | 0.068 | 0.012 | 0.000 | 0.027 | ||
| 2 spectra, FVIGHLK | 0.000 | 0.000 | 0.000 | 0.759 | 0.020 | 0.000 | 0.221 | 0.000 | ||
| 5 spectra, HGIEYQEKPLLR | 0.000 | 0.016 | 0.034 | 0.633 | 0.147 | 0.040 | 0.130 | 0.000 | ||
| 1 spectrum, SGELWLDAYLHK | 0.000 | 0.000 | 0.000 | 0.905 | 0.061 | 0.000 | 0.000 | 0.034 |
| Plot | Mito | Lyso or Perox | ER | Golgi | PM | Cytosol | Nucleus | ||||||
| Expt B |
5 peptides |
9 spectra |
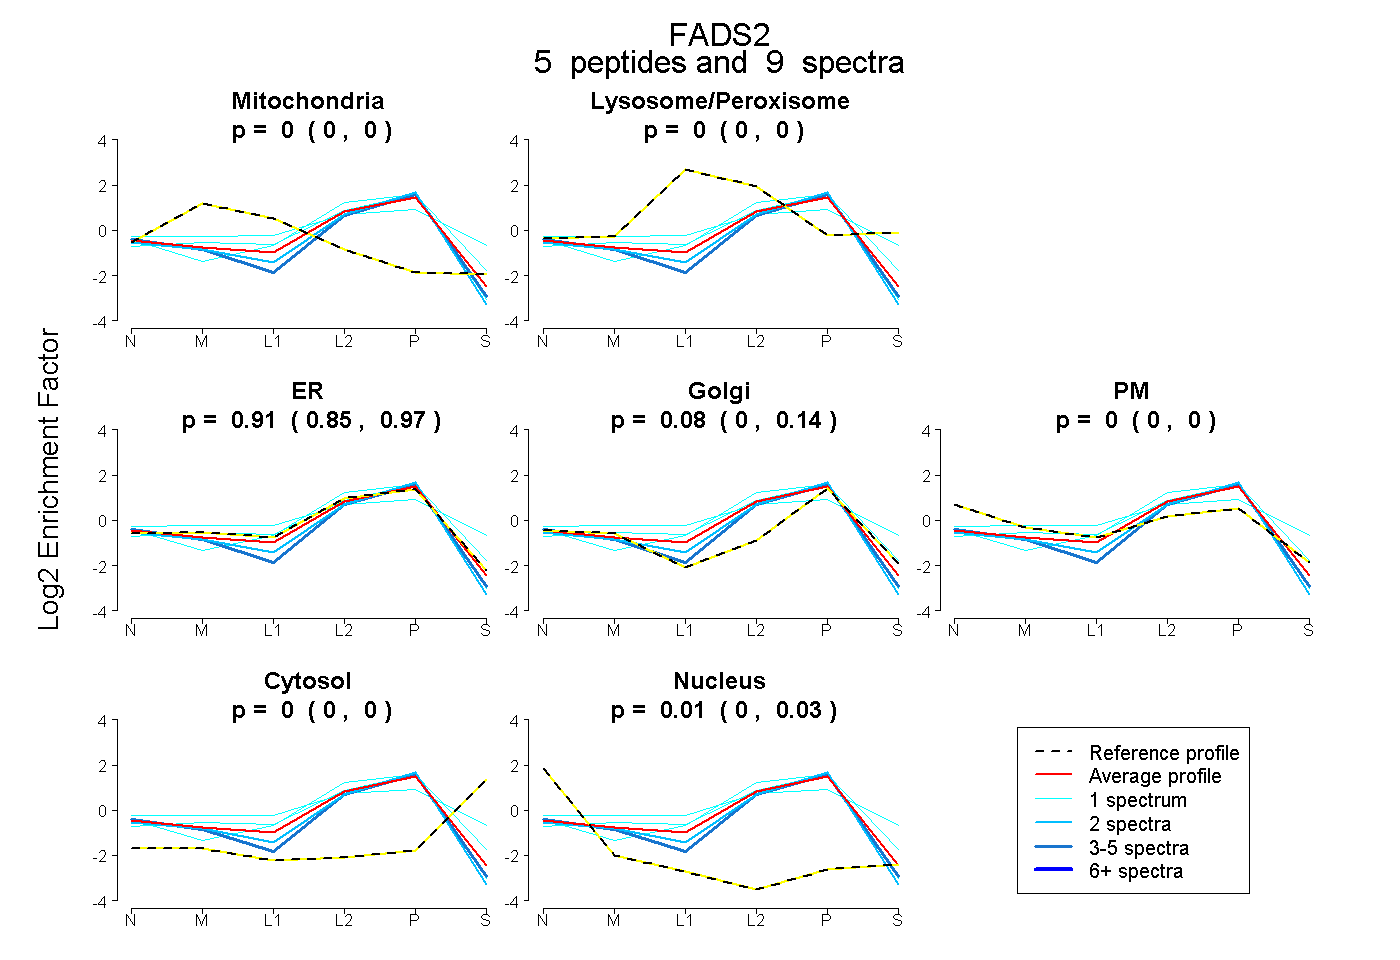 |
0.000 0.000 | 0.000 |
0.000 0.000 | 0.000 |
0.908 0.850 | 0.967 |
0.082 0.000 | 0.138 |
0.000 0.000 | 0.000 |
0.000 0.000 | 0.000 |
0.009 0.000 | 0.027 |
|||
| Plot | Lyso | Other | |||||||||||
| Expt C |
11 peptides |
42 spectra |
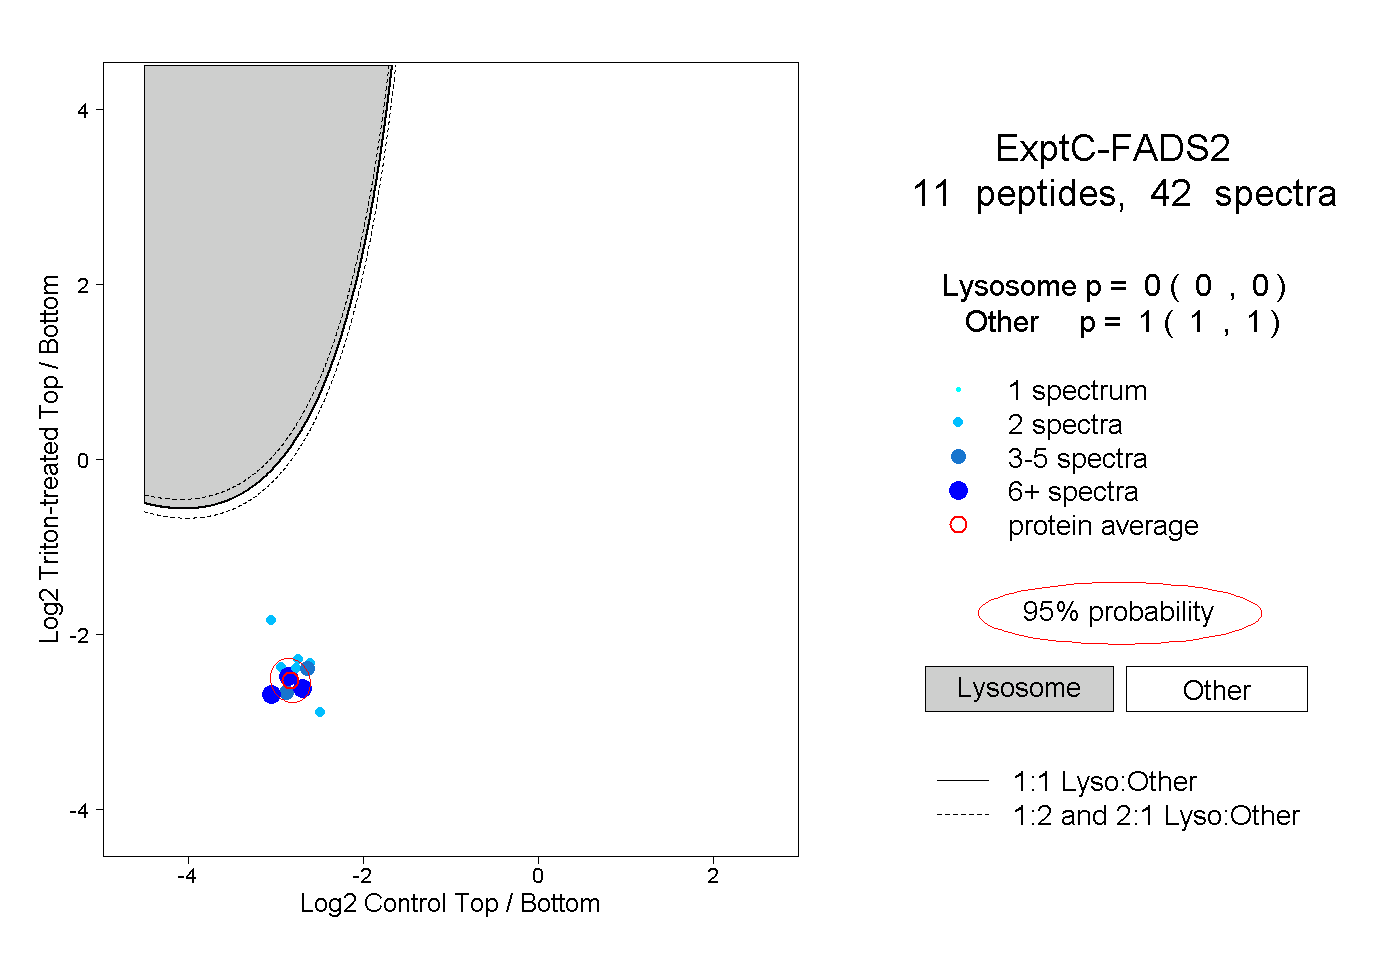 |
0.000 0.000 | 0.000 |
1.000 1.000 | 1.000 |
||||||||
| Plot | Lyso | Other | |||||||||||
| Expt D |
3 peptides |
5 spectra |
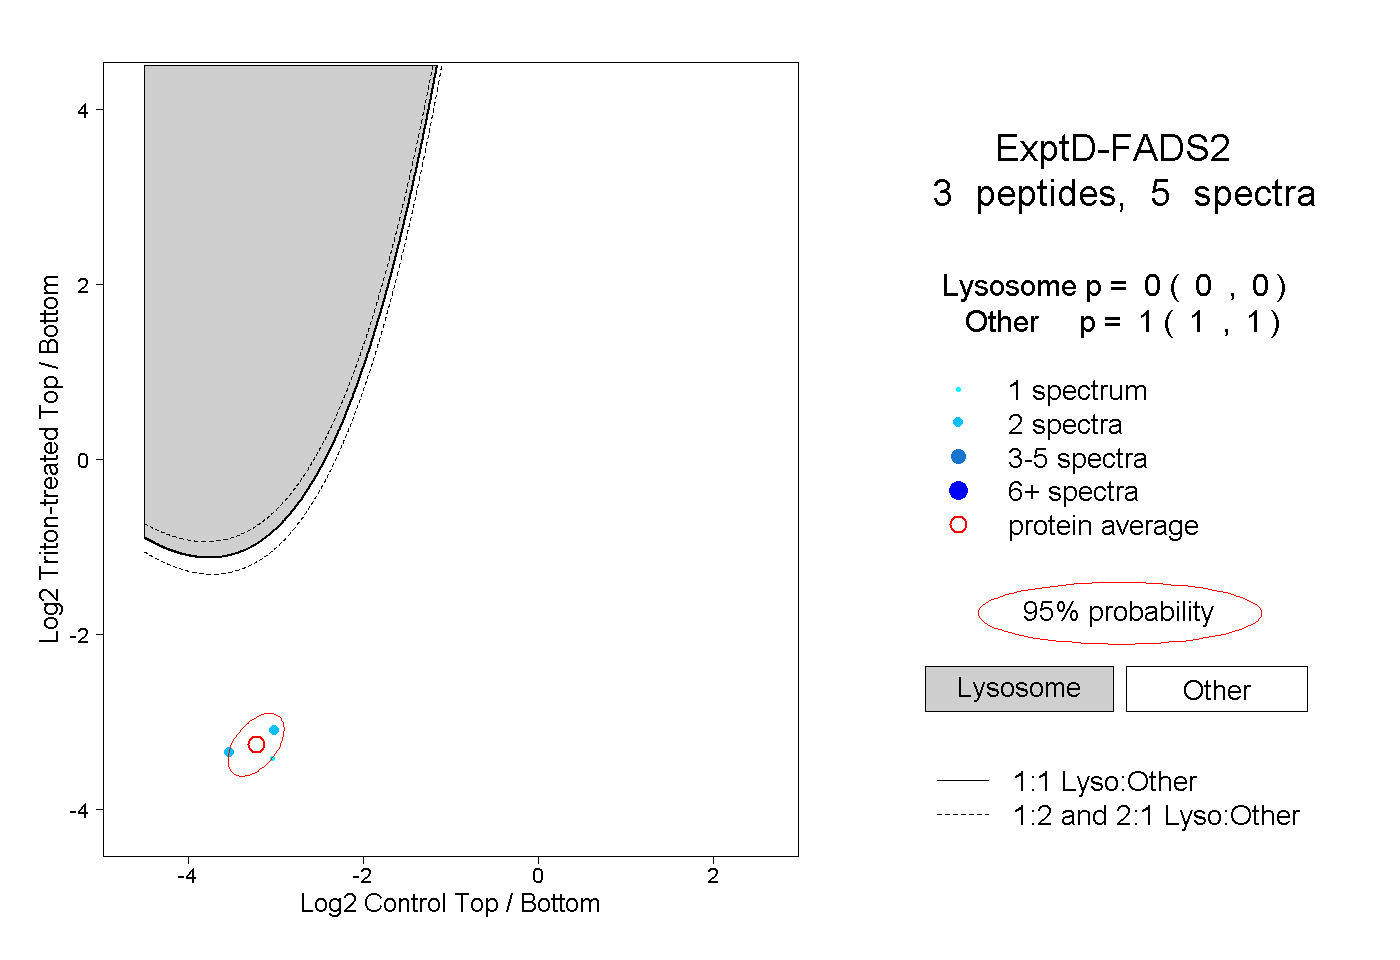 |
0.000 0.000 | 0.000 |
1.000 1.000 | 1.000 |