 12
12peptides
spectra
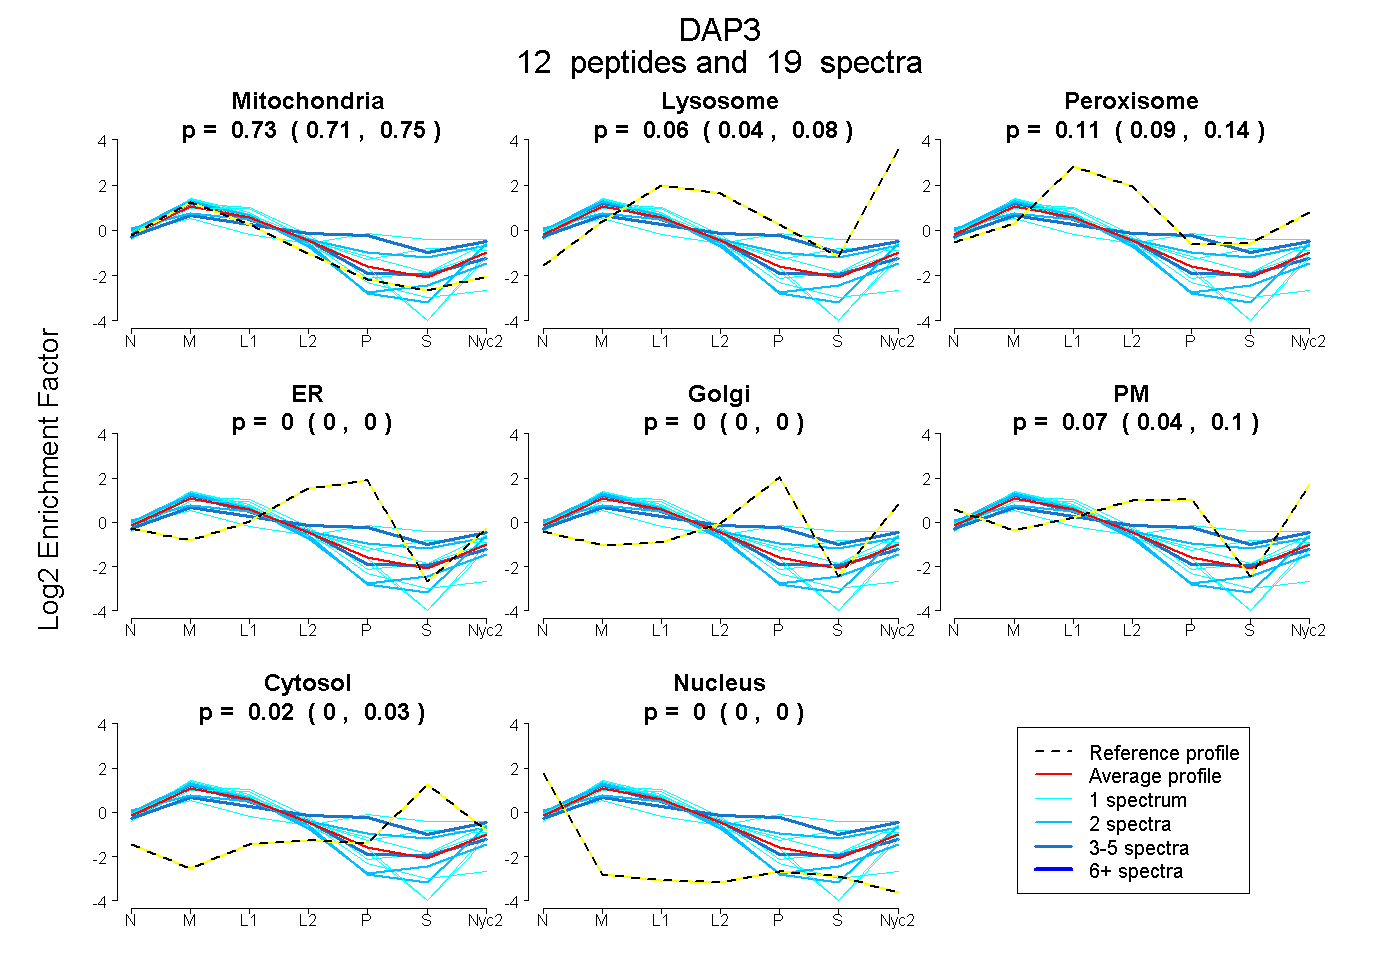
0.708 | 0.747
0.039 | 0.082
0.088 | 0.136
0.000 | 0.000
0.000 | 0.000
0.044 | 0.098
0.003 | 0.034
0.000 | 0.000
3peptides
spectra
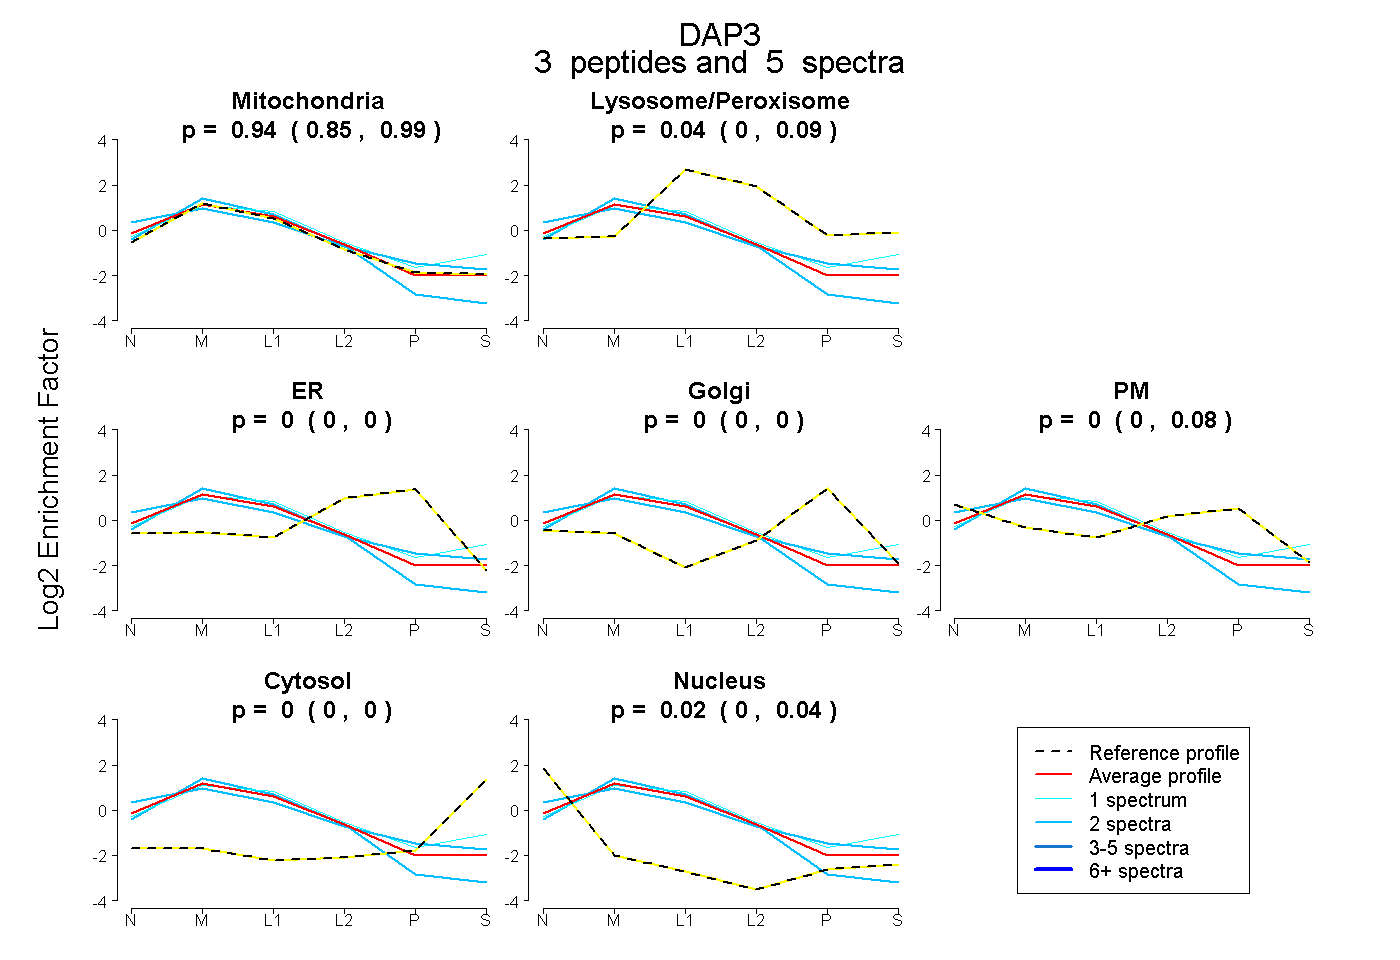
0.846 | 0.986
0.000 | 0.089
0.000 | 0.000
0.000 | 0.000
0.000 | 0.077
0.000 | 0.000
0.000 | 0.043
16peptides
spectra
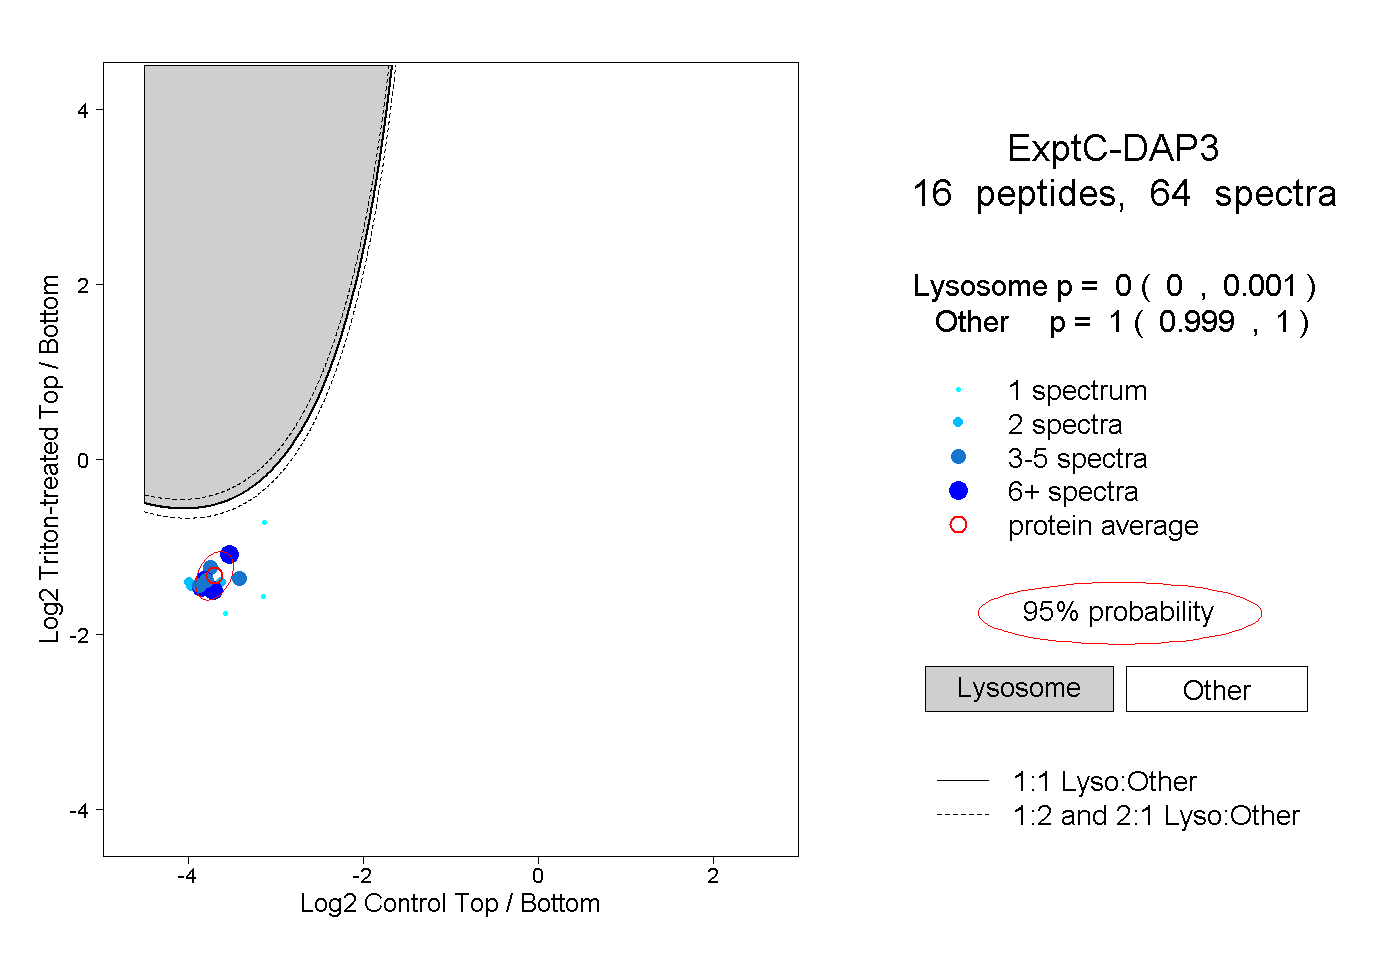
0.000 | 0.001
0.999 | 1.000
5peptides
spectra
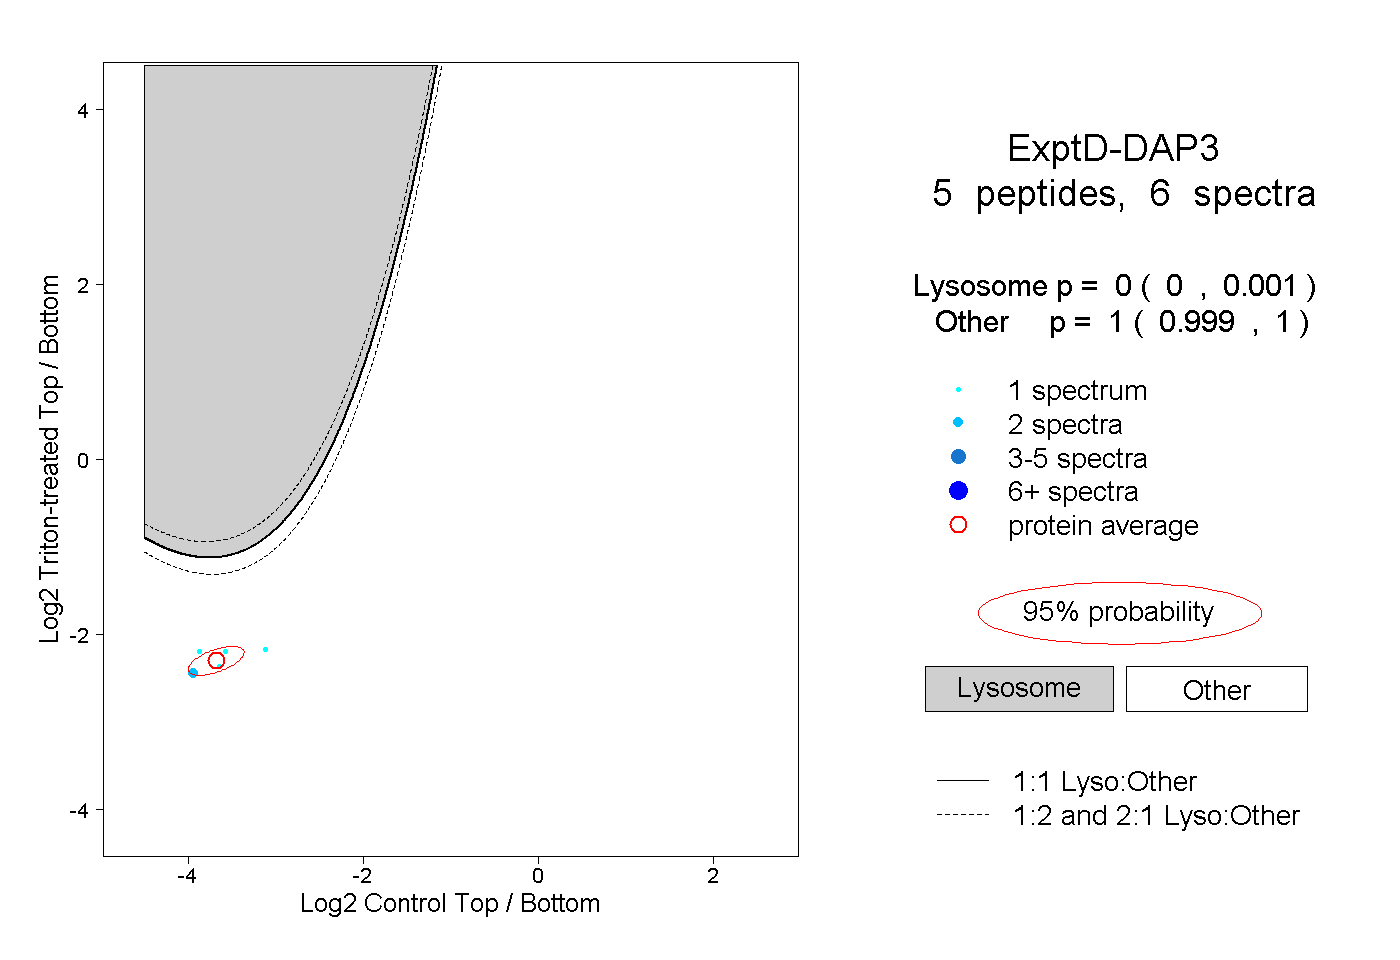
0.000 | 0.001
0.999 | 1.000