 12
12peptides
spectra
0.708 | 0.747
0.039 | 0.082
0.088 | 0.136
0.000 | 0.000
0.000 | 0.000
0.044 | 0.098
0.003 | 0.034
0.000 | 0.000
| Plot | Mito | Lyso | Perox | ER | Golgi | PM | Cytosol | Nucleus | |||||
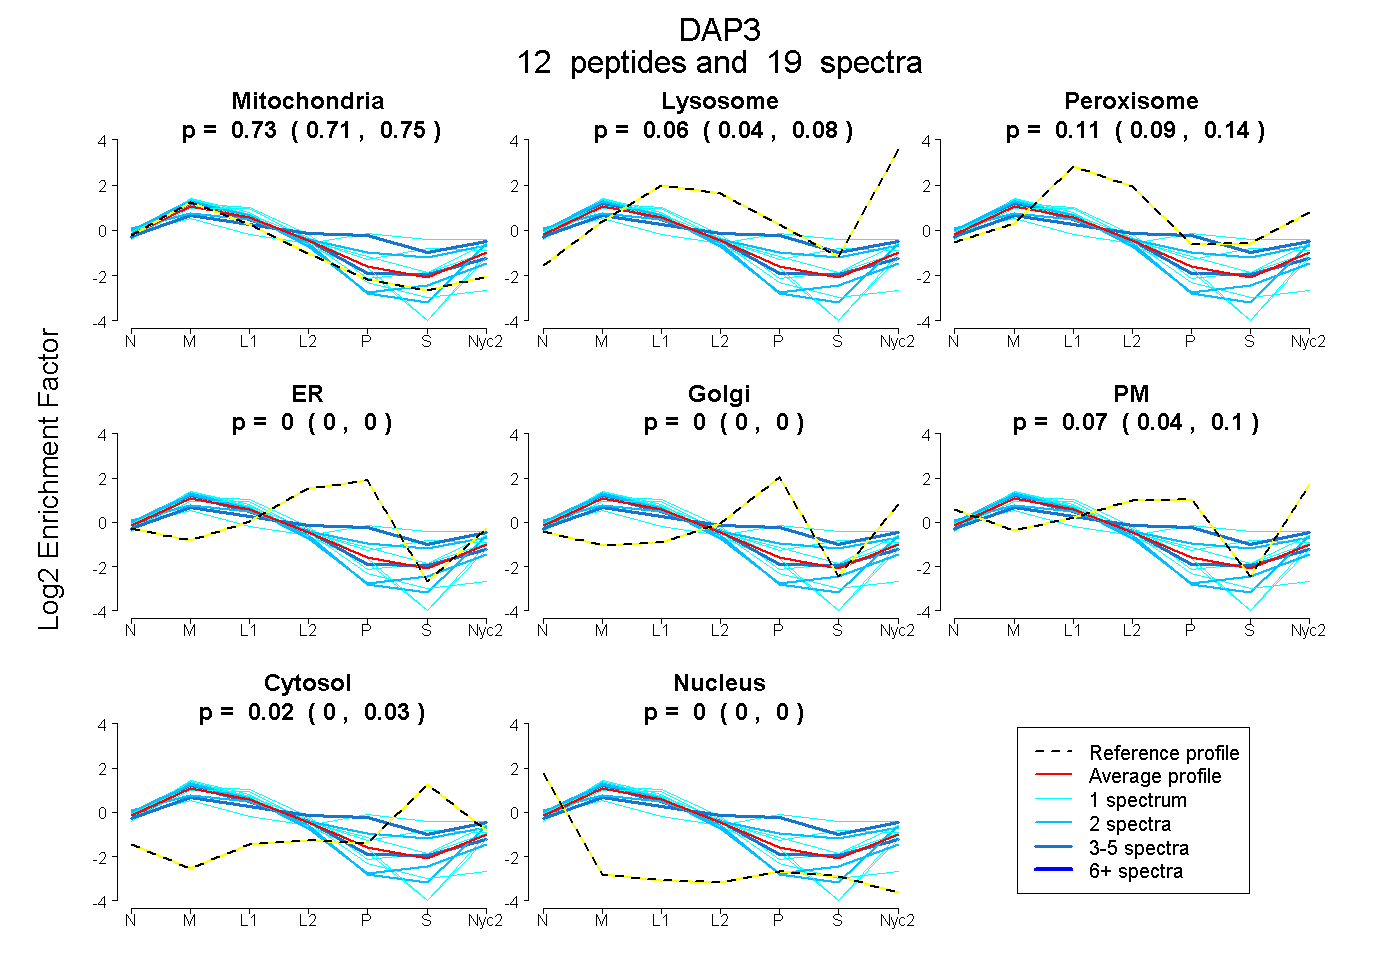
| Expt A |
12 peptides |
19 spectra |
|
0.730 0.708 | 0.747 |
0.063 0.039 | 0.082 |
0.113 0.088 | 0.136 |
0.000 0.000 | 0.000 |
0.000 0.000 | 0.000 |
0.074 0.044 | 0.098 |
0.020 0.003 | 0.034 |
0.000 0.000 | 0.000 |
| 3 spectra, FLSNCNPEQLER | 0.774 | 0.055 | 0.133 | 0.000 | 0.000 | 0.000 | 0.038 | 0.000 | ||
| 1 spectrum, TLSLCHAVHFCAK | 0.515 | 0.000 | 0.346 | 0.000 | 0.000 | 0.000 | 0.139 | 0.000 | ||
| 1 spectrum, FDQPLEASTWLK | 0.840 | 0.048 | 0.000 | 0.000 | 0.000 | 0.112 | 0.000 | 0.000 | ||
| 1 spectrum, YVWNK | 0.647 | 0.100 | 0.086 | 0.000 | 0.000 | 0.147 | 0.021 | 0.000 | ||
| 2 spectra, TLIAPEELALVR | 0.906 | 0.000 | 0.094 | 0.000 | 0.000 | 0.000 | 0.000 | 0.000 | ||
| 1 spectrum, NTNFAHPAVR | 0.305 | 0.002 | 0.181 | 0.000 | 0.225 | 0.041 | 0.247 | 0.000 | ||
| 1 spectrum, NCGELLQSTYNK | 0.815 | 0.000 | 0.000 | 0.000 | 0.000 | 0.185 | 0.000 | 0.000 | ||
| 2 spectra, GSPLGEVVEQGLTR | 0.861 | 0.139 | 0.000 | 0.000 | 0.000 | 0.000 | 0.000 | 0.000 | ||
| 2 spectra, YLLYGEK | 0.501 | 0.000 | 0.196 | 0.000 | 0.000 | 0.167 | 0.136 | 0.000 | ||
| 3 spectra, TVFPHGLPPR | 0.364 | 0.000 | 0.270 | 0.000 | 0.249 | 0.000 | 0.116 | 0.000 | ||
| 1 spectrum, FLGQIK | 0.703 | 0.000 | 0.297 | 0.000 | 0.000 | 0.000 | 0.000 | 0.000 | ||
| 1 spectrum, TFGEACLMVR | 1.000 | 0.000 | 0.000 | 0.000 | 0.000 | 0.000 | 0.000 | 0.000 |
| Plot | Mito | Lyso or Perox | ER | Golgi | PM | Cytosol | Nucleus | ||||||
| Expt B |
3 peptides |
5 spectra |
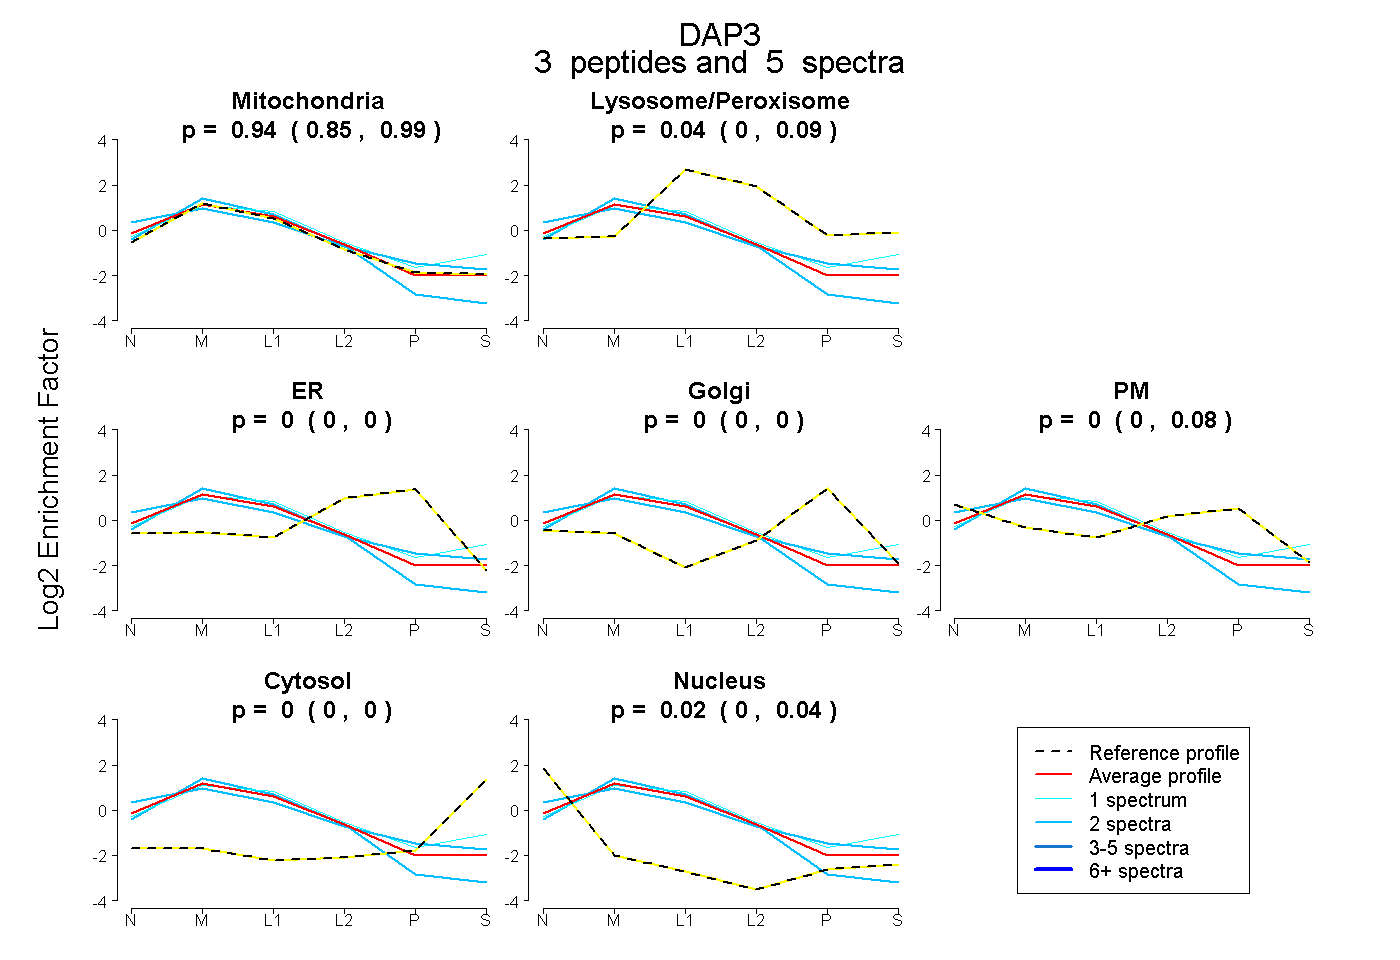 |
0.937 0.846 | 0.986 |
0.039 0.000 | 0.089 |
0.000 0.000 | 0.000 |
0.000 0.000 | 0.000 |
0.000 0.000 | 0.077 |
0.000 0.000 | 0.000 |
0.024 0.000 | 0.043 |
|||
| Plot | Lyso | Other | |||||||||||
| Expt C |
16 peptides |
64 spectra |
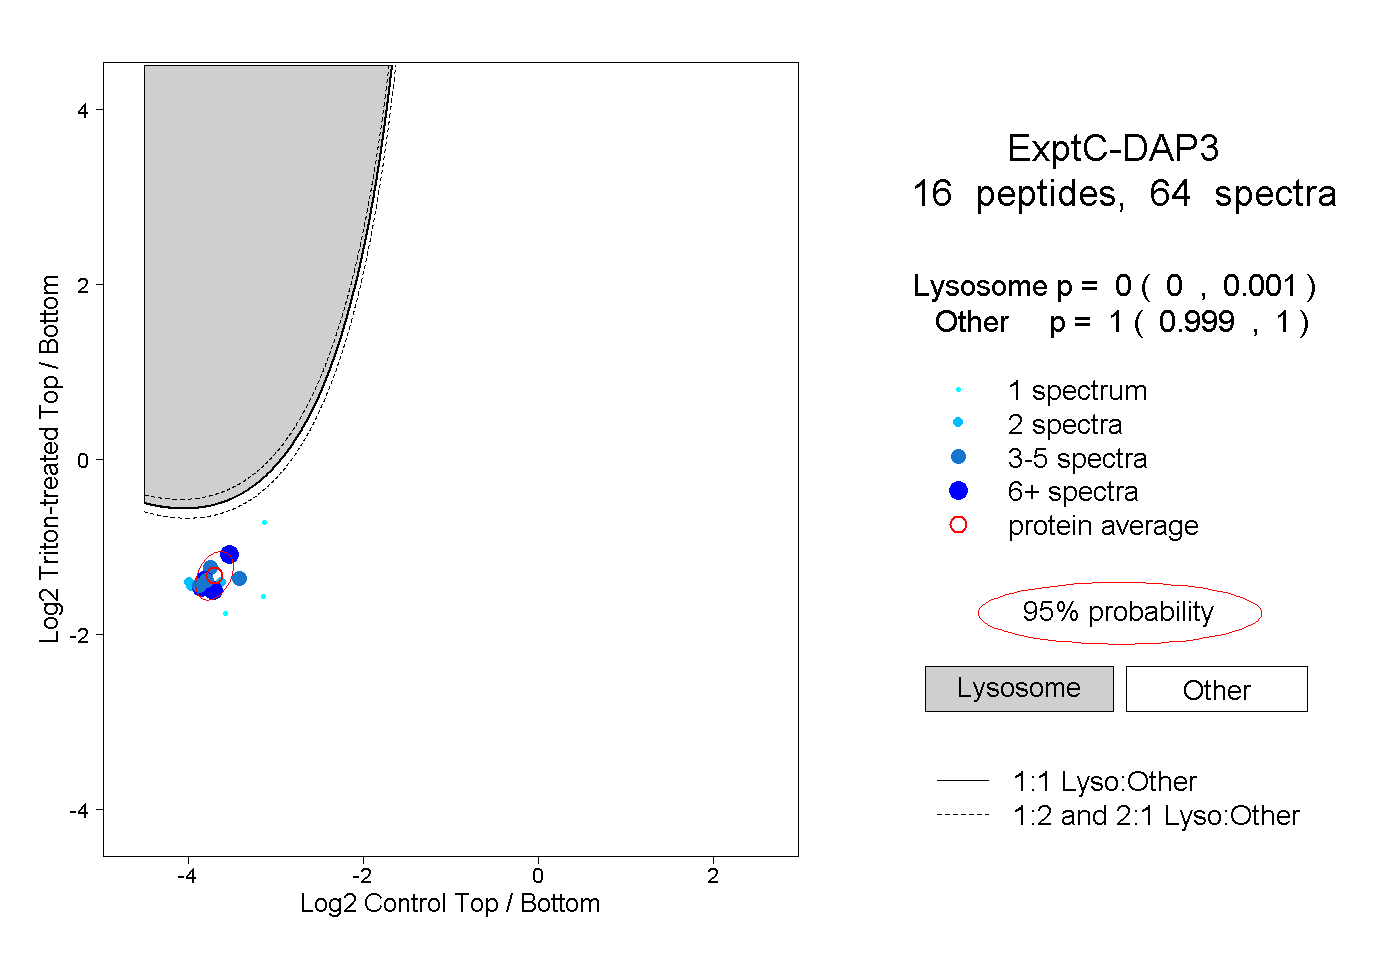 |
0.000 0.000 | 0.001 |
1.000 0.999 | 1.000 |
||||||||
| Plot | Lyso | Other | |||||||||||
| Expt D |
5 peptides |
6 spectra |
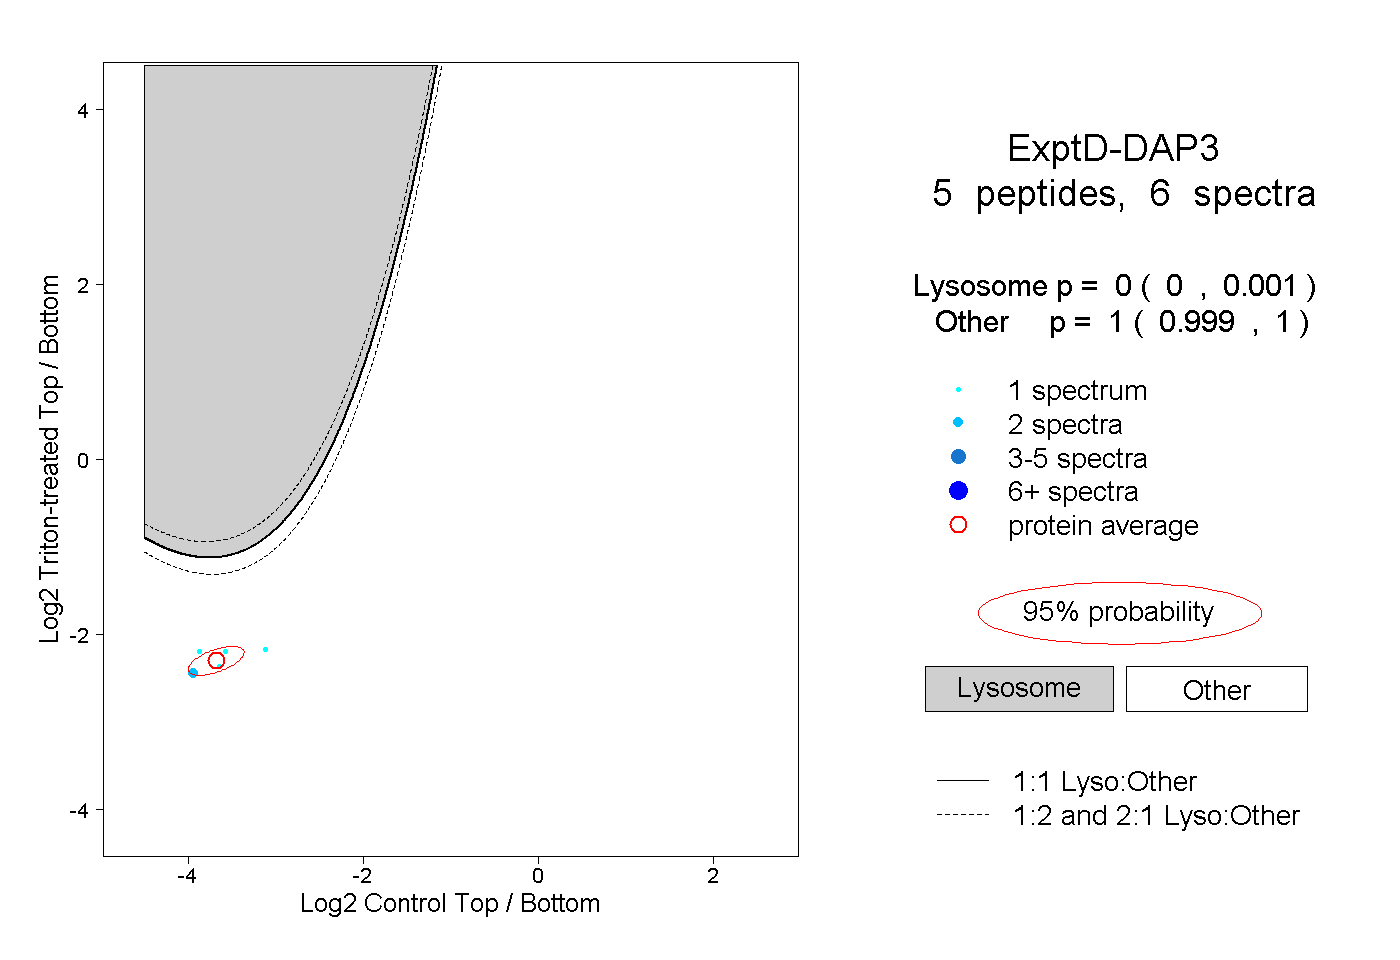 |
0.000 0.000 | 0.001 |
1.000 0.999 | 1.000 |