 14
14peptides
spectra
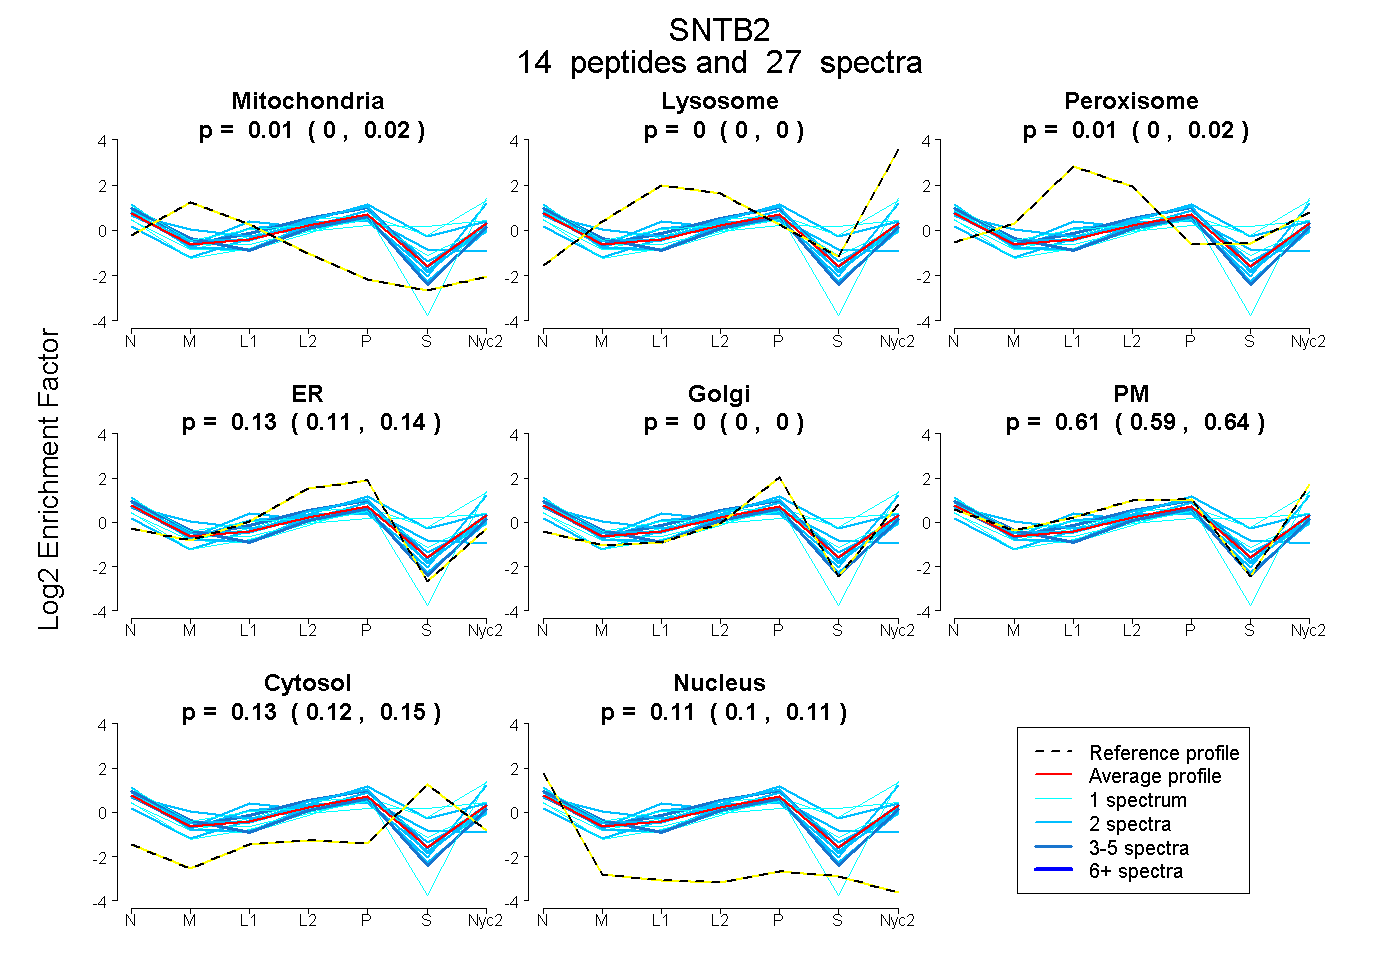
0.000 | 0.016
0.000 | 0.000
0.000 | 0.024
0.106 | 0.143
0.000 | 0.000
0.589 | 0.635
0.119 | 0.147
0.096 | 0.115
3peptides
spectra
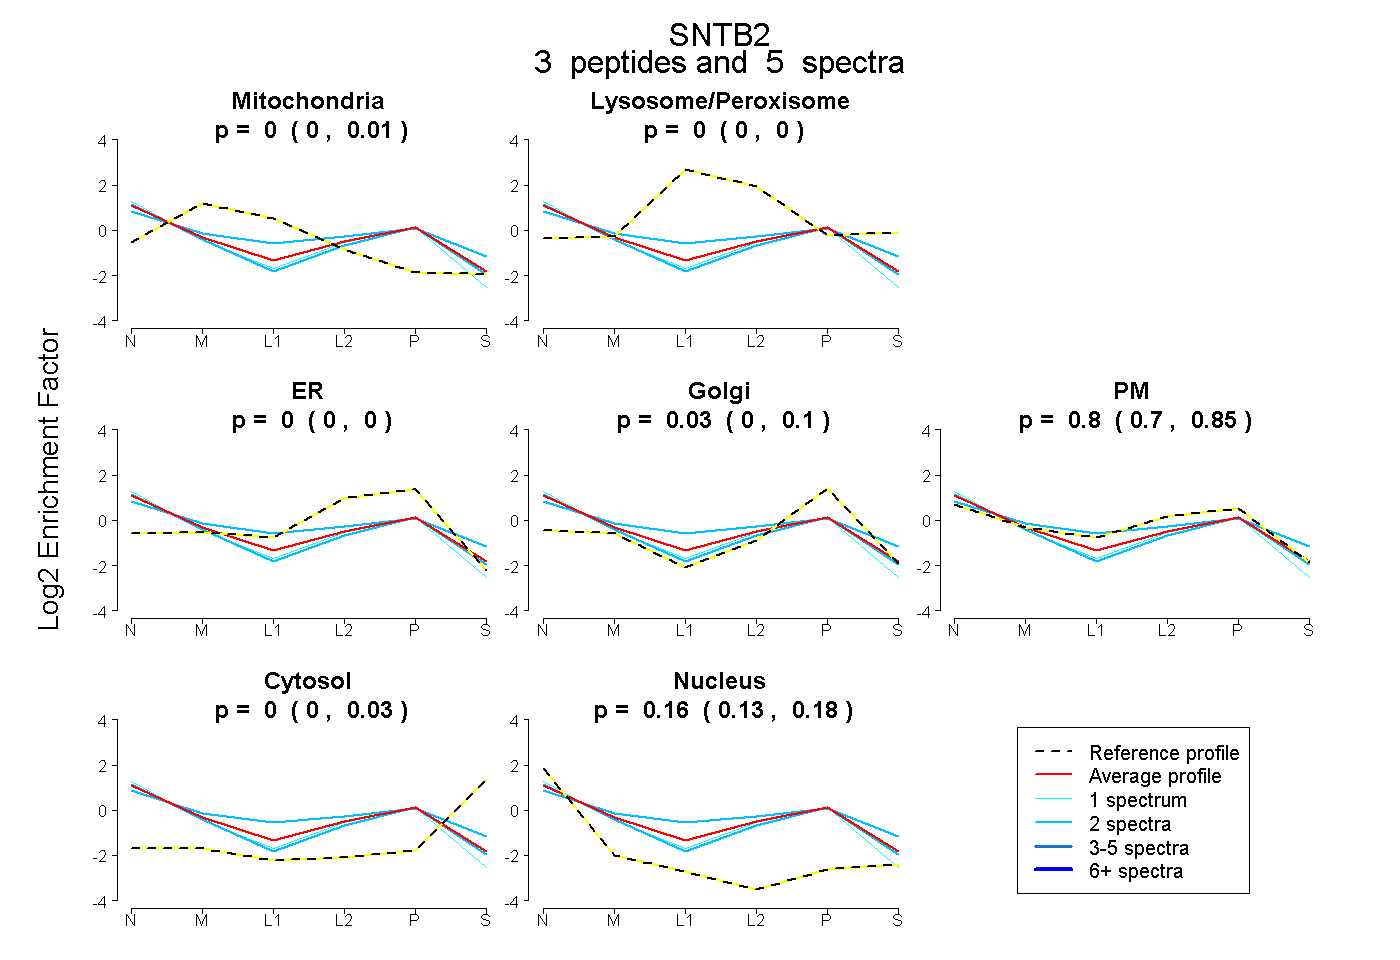
0.000 | 0.011
0.000 | 0.000
0.000 | 0.000
0.000 | 0.103
0.701 | 0.847
0.000 | 0.033
0.130 | 0.181
7peptides
spectra
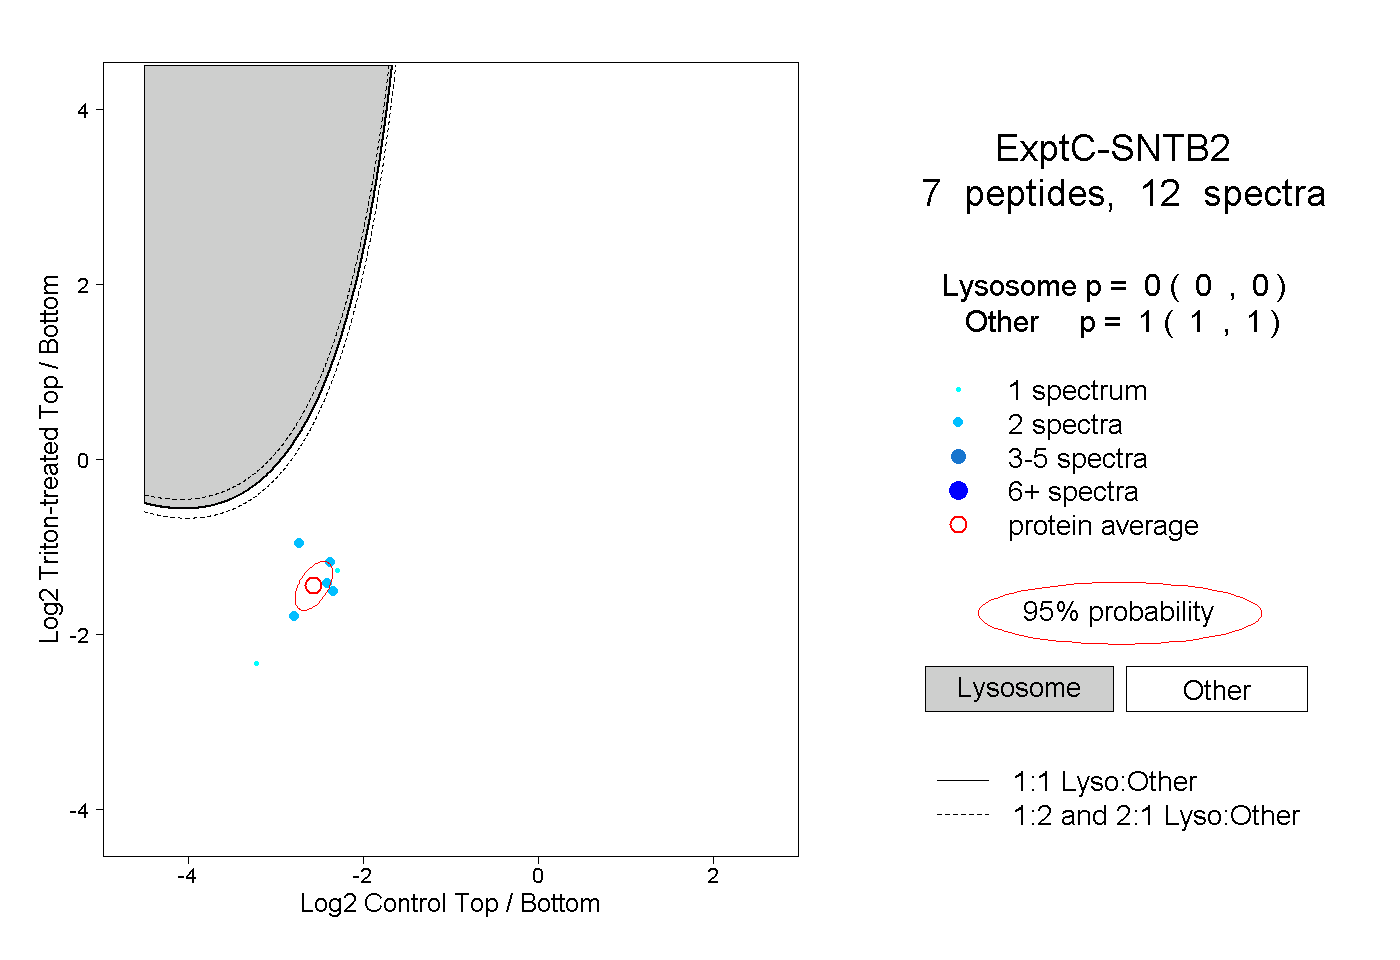
0.000 | 0.000
1.000 | 1.000
1peptide
spectrum
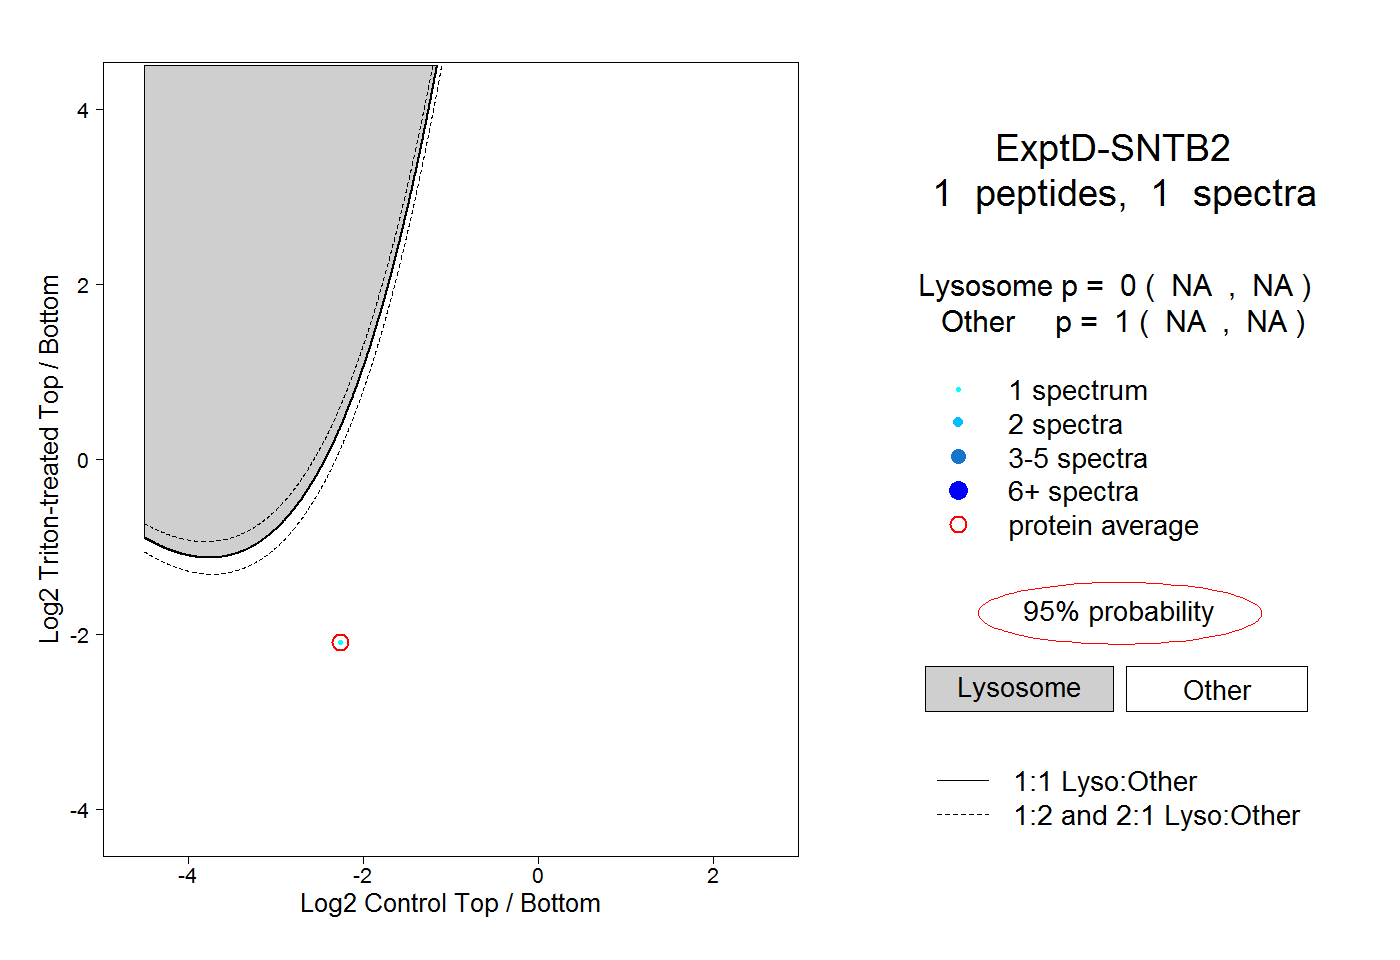
NA | NA
NA | NA