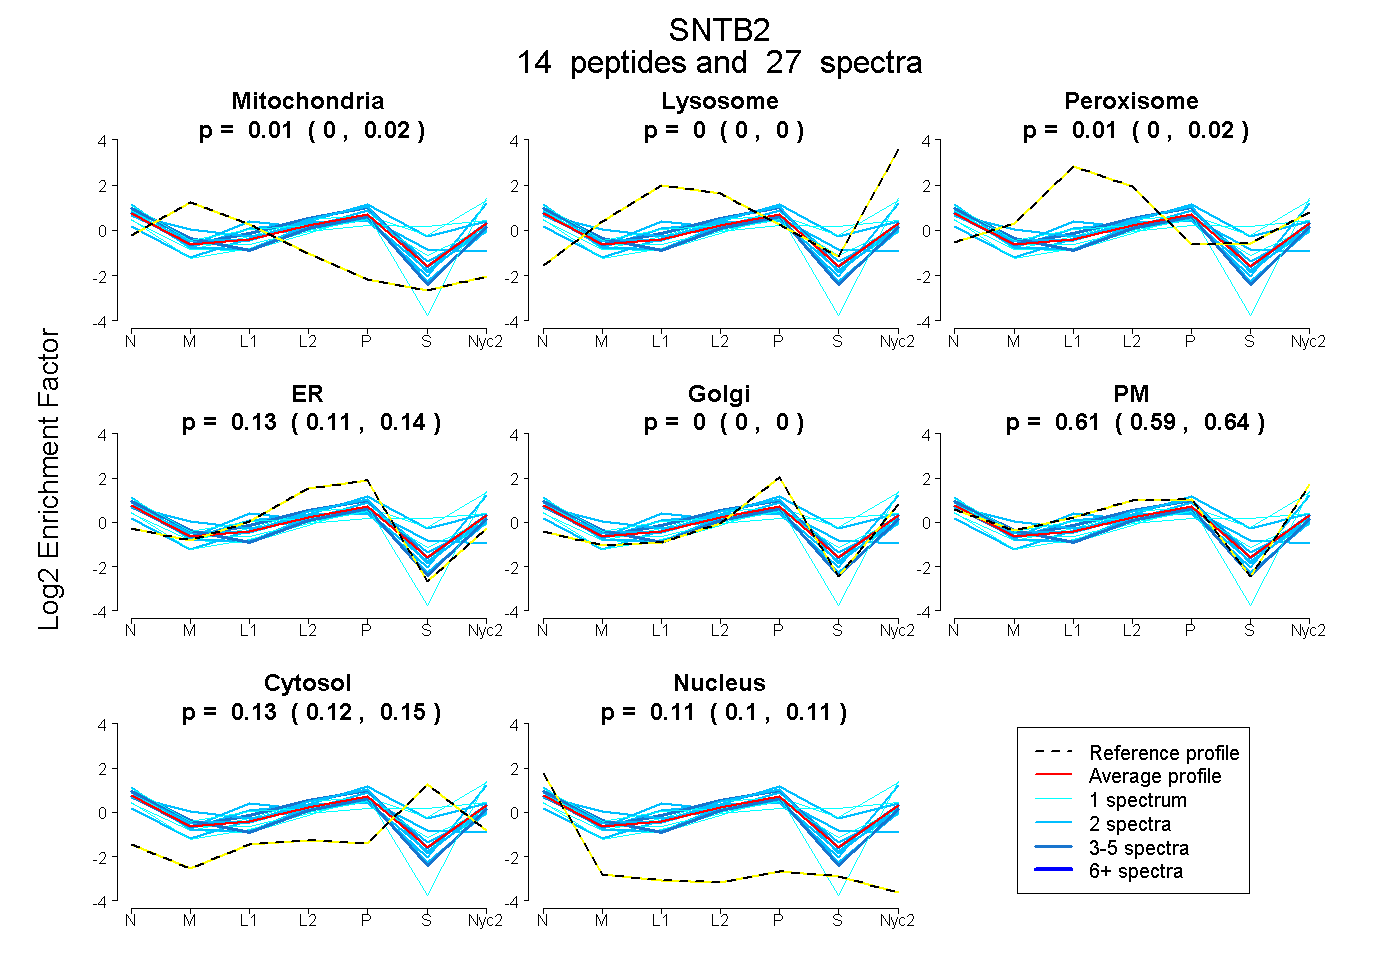
 14
14peptides
spectra
0.000 | 0.016
0.000 | 0.000
0.000 | 0.024
0.106 | 0.143
0.000 | 0.000
0.589 | 0.635
0.119 | 0.147
0.096 | 0.115
| Plot | Mito | Lyso | Perox | ER | Golgi | PM | Cytosol | Nucleus | |||||
| Expt A |
14 peptides |
27 spectra |
|
0.007 0.000 | 0.016 |
0.000 0.000 | 0.000 |
0.011 0.000 | 0.024 |
0.128 0.106 | 0.143 |
0.000 0.000 | 0.000 |
0.614 0.589 | 0.635 |
0.135 0.119 | 0.147 |
0.106 0.096 | 0.115 |
| 1 spectrum, NTLILR | 0.000 | 0.000 | 0.000 | 0.000 | 0.000 | 0.506 | 0.494 | 0.000 | ||
| 2 spectra, IFPGLAADQSR | 0.000 | 0.000 | 0.000 | 0.173 | 0.000 | 0.592 | 0.000 | 0.235 | ||
| 1 spectrum, QEAGGLGISIK | 0.016 | 0.000 | 0.002 | 0.049 | 0.000 | 0.610 | 0.210 | 0.112 | ||
| 1 spectrum, SPSLGSDLTFATR | 0.000 | 0.000 | 0.000 | 0.000 | 0.000 | 0.897 | 0.000 | 0.103 | ||
| 5 spectra, QGIEMHLFR | 0.055 | 0.000 | 0.000 | 0.077 | 0.119 | 0.564 | 0.000 | 0.184 | ||
| 2 spectra, EVTPYIK | 0.000 | 0.000 | 0.315 | 0.058 | 0.328 | 0.155 | 0.000 | 0.144 | ||
| 2 spectra, FTVHYEHGFTITR | 0.000 | 0.000 | 0.061 | 0.000 | 0.000 | 0.797 | 0.040 | 0.102 | ||
| 3 spectra, MPILISK | 0.000 | 0.000 | 0.038 | 0.244 | 0.000 | 0.533 | 0.111 | 0.074 | ||
| 1 spectrum, AGLVELLLR | 0.000 | 0.000 | 0.000 | 0.097 | 0.112 | 0.500 | 0.101 | 0.191 | ||
| 2 spectra, GLGPPSPPAPPR | 0.000 | 0.000 | 0.047 | 0.164 | 0.122 | 0.335 | 0.332 | 0.000 | ||
| 1 spectrum, HIAWLAEQAK | 0.000 | 0.089 | 0.005 | 0.000 | 0.000 | 0.596 | 0.311 | 0.000 | ||
| 2 spectra, LIELHSPDSR | 0.043 | 0.000 | 0.130 | 0.407 | 0.000 | 0.099 | 0.193 | 0.129 | ||
| 2 spectra, MSADDGIR | 0.212 | 0.000 | 0.000 | 0.055 | 0.069 | 0.545 | 0.072 | 0.046 | ||
| 2 spectra, NLSMPDLENR | 0.025 | 0.000 | 0.000 | 0.239 | 0.050 | 0.532 | 0.068 | 0.087 |
| Plot | Mito | Lyso or Perox | ER | Golgi | PM | Cytosol | Nucleus | ||||||
| Expt B |
3 peptides |
5 spectra |
 |
0.000 0.000 | 0.011 |
0.000 0.000 | 0.000 |
0.000 0.000 | 0.000 |
0.032 0.000 | 0.103 |
0.804 0.701 | 0.847 |
0.000 0.000 | 0.033 |
0.164 0.130 | 0.181 |
|||
| Plot | Lyso | Other | |||||||||||
| Expt C |
7 peptides |
12 spectra |
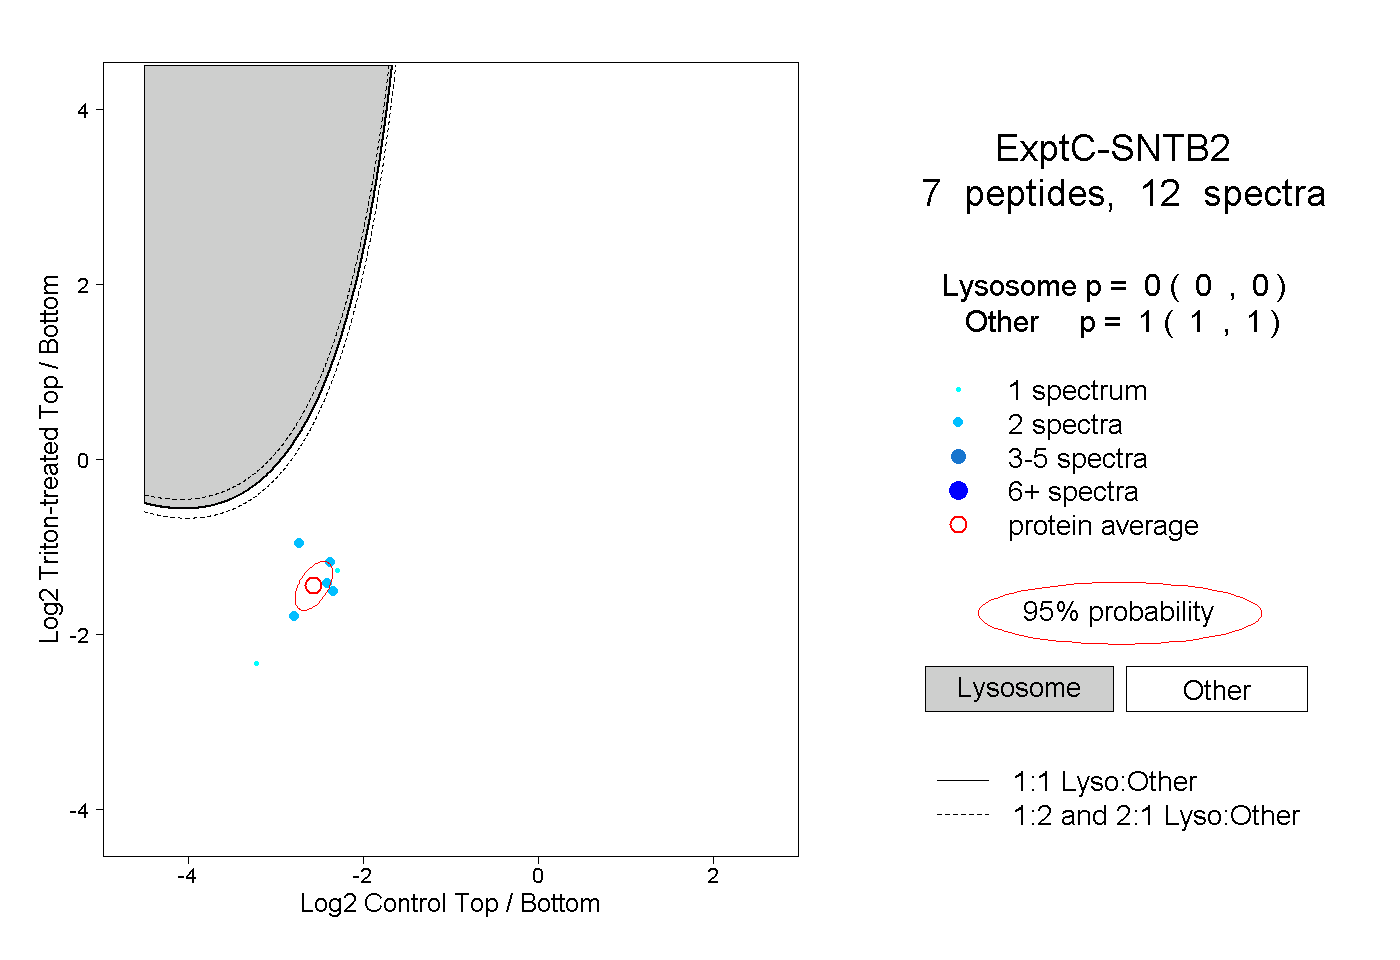 |
0.000 0.000 | 0.000 |
1.000 1.000 | 1.000 |
||||||||
| Plot | Lyso | Other | |||||||||||
| Expt D |
1 peptide |
1 spectrum |
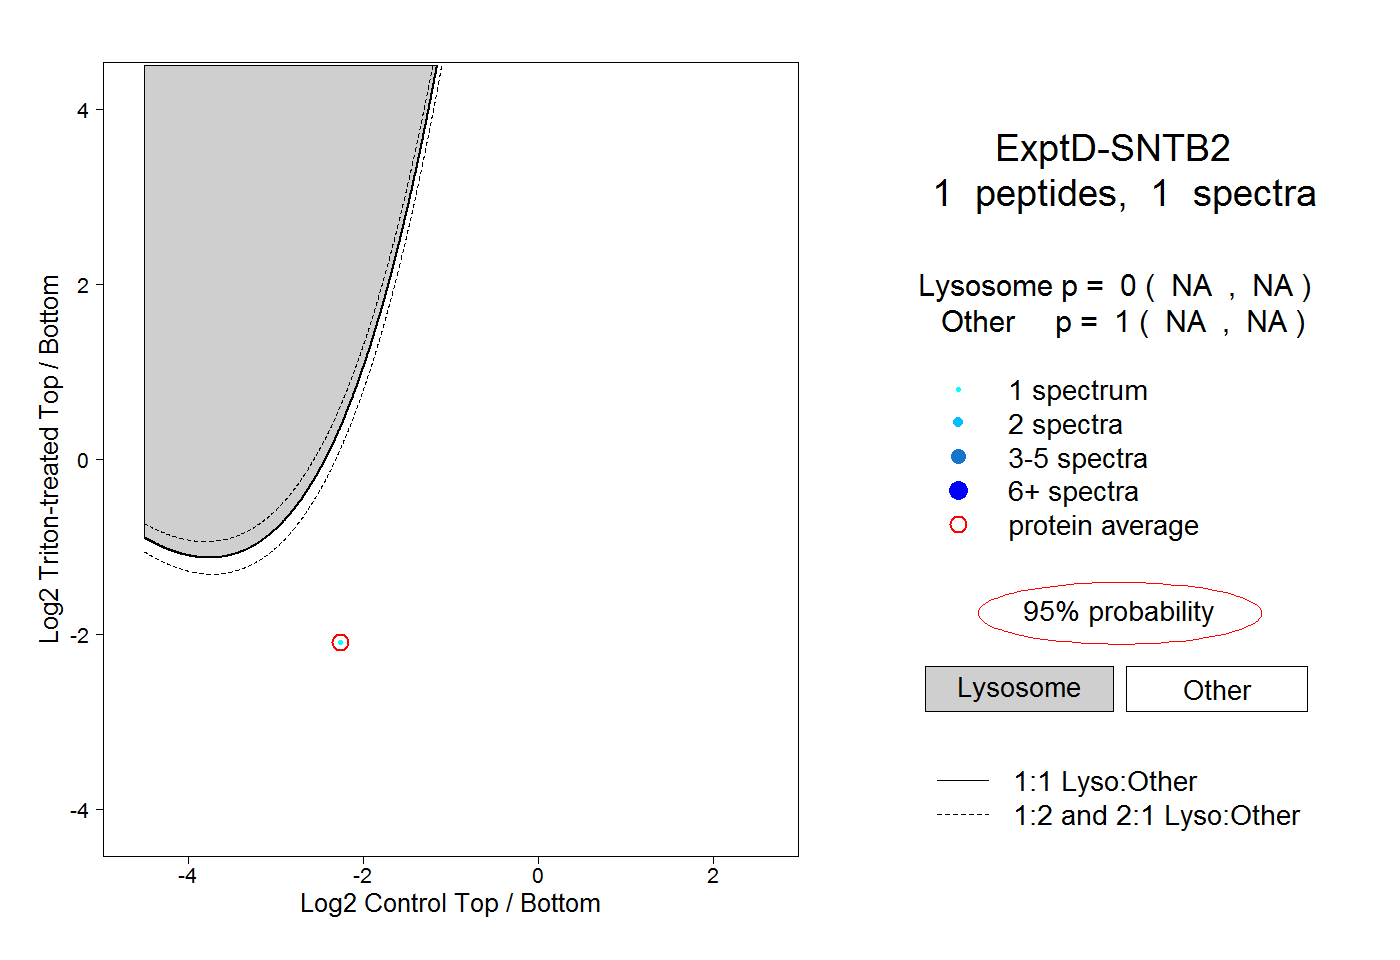 |
0.000 NA | NA |
1.000 NA | NA |