 14
14peptides
spectra
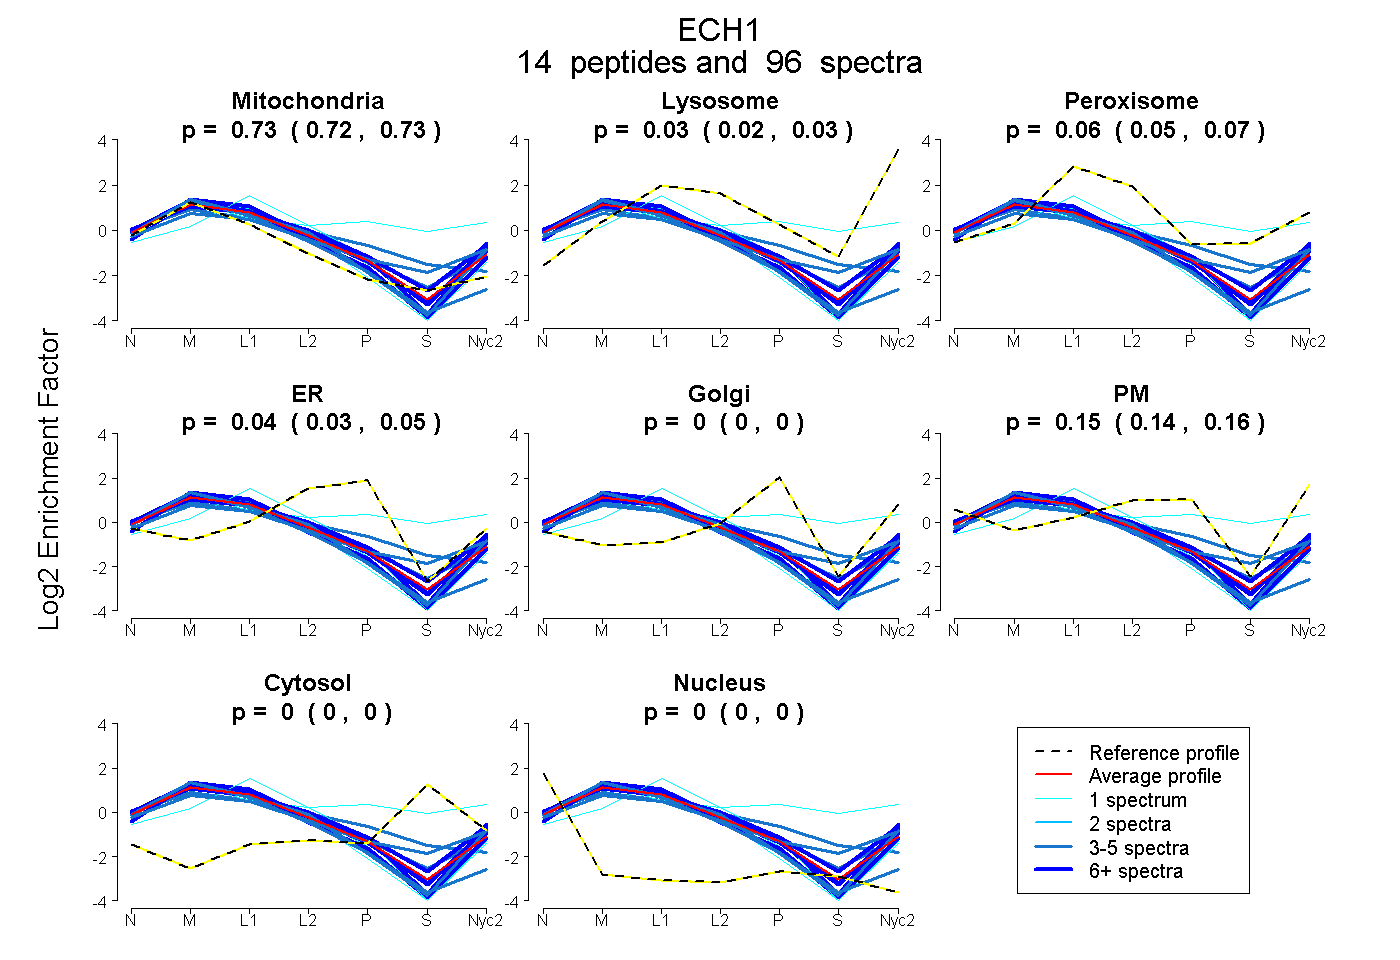
0.722 | 0.730
0.020 | 0.034
0.048 | 0.068
0.028 | 0.045
0.000 | 0.000
0.141 | 0.159
0.000 | 0.000
0.000 | 0.000
14peptides
spectra
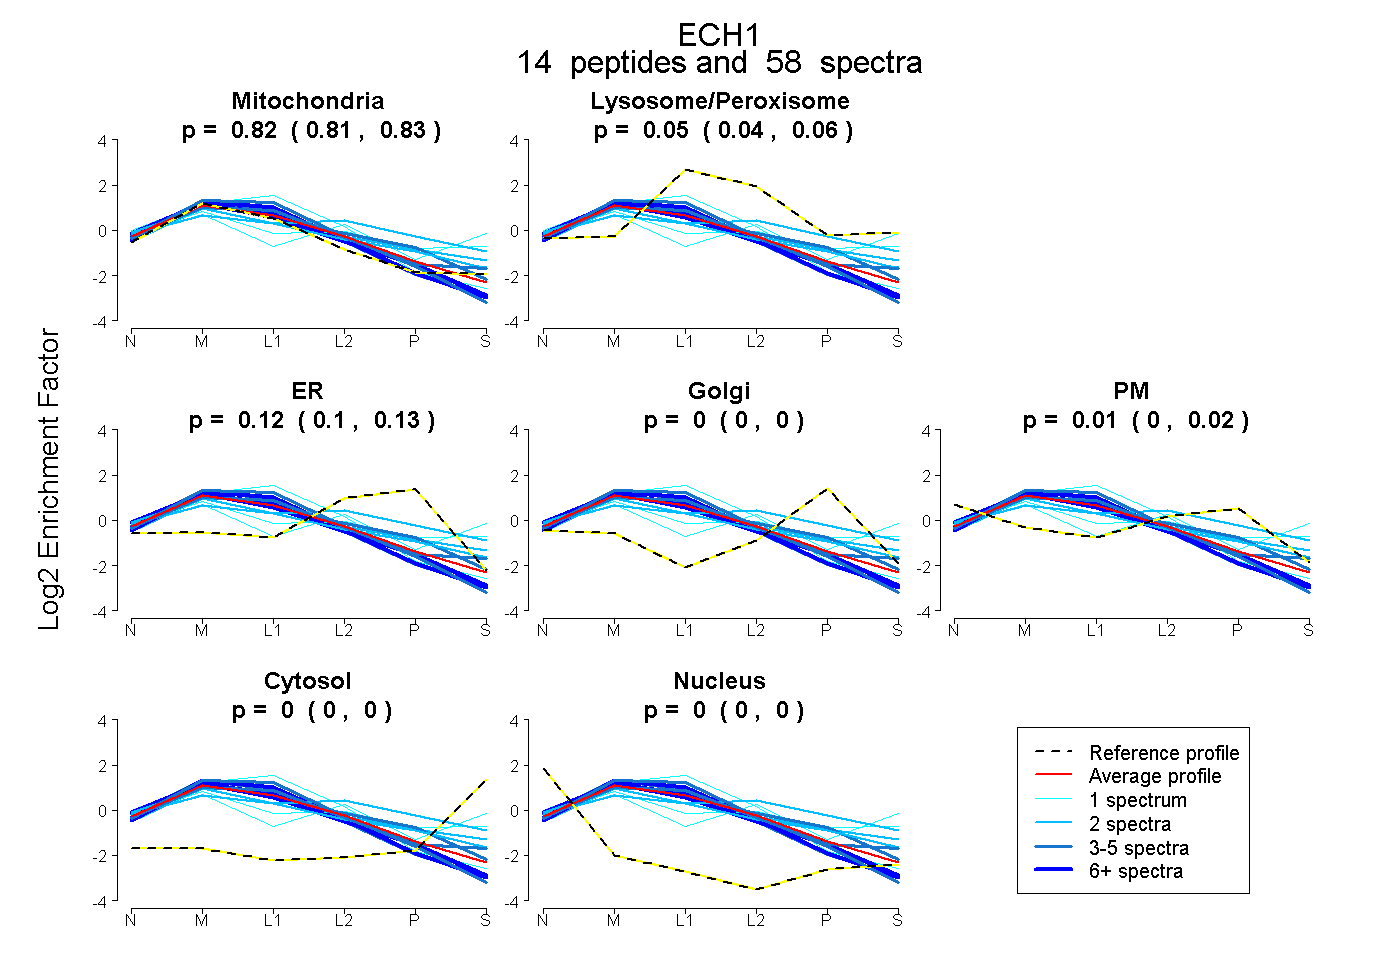
0.815 | 0.831
0.039 | 0.059
0.101 | 0.128
0.000 | 0.000
0.000 | 0.023
0.000 | 0.000
0.000 | 0.000
14peptides
spectra
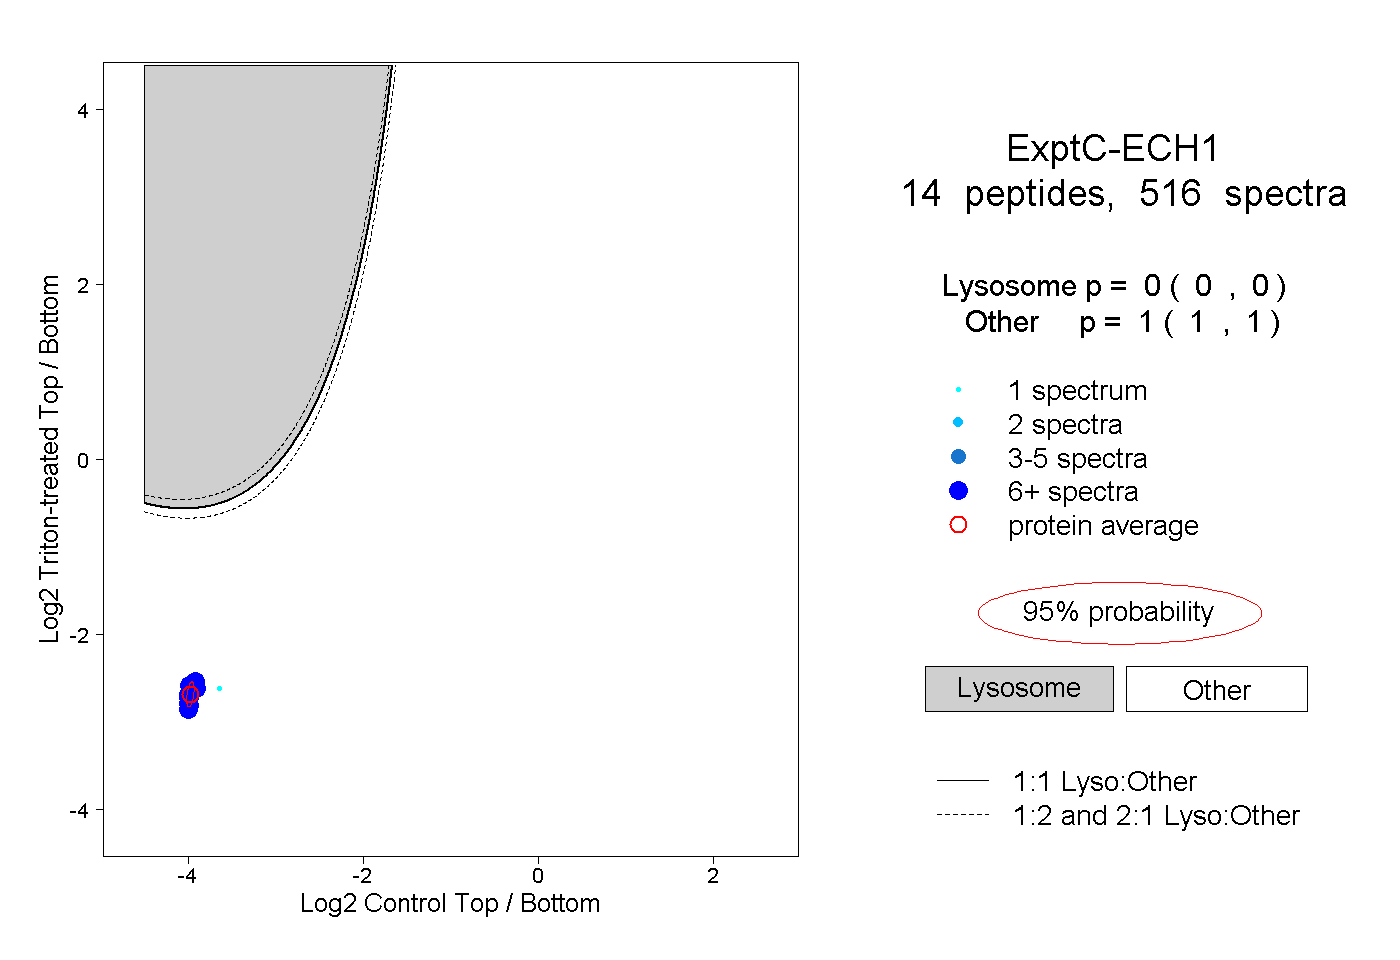
0.000 | 0.000
1.000 | 1.000
11peptides
spectra
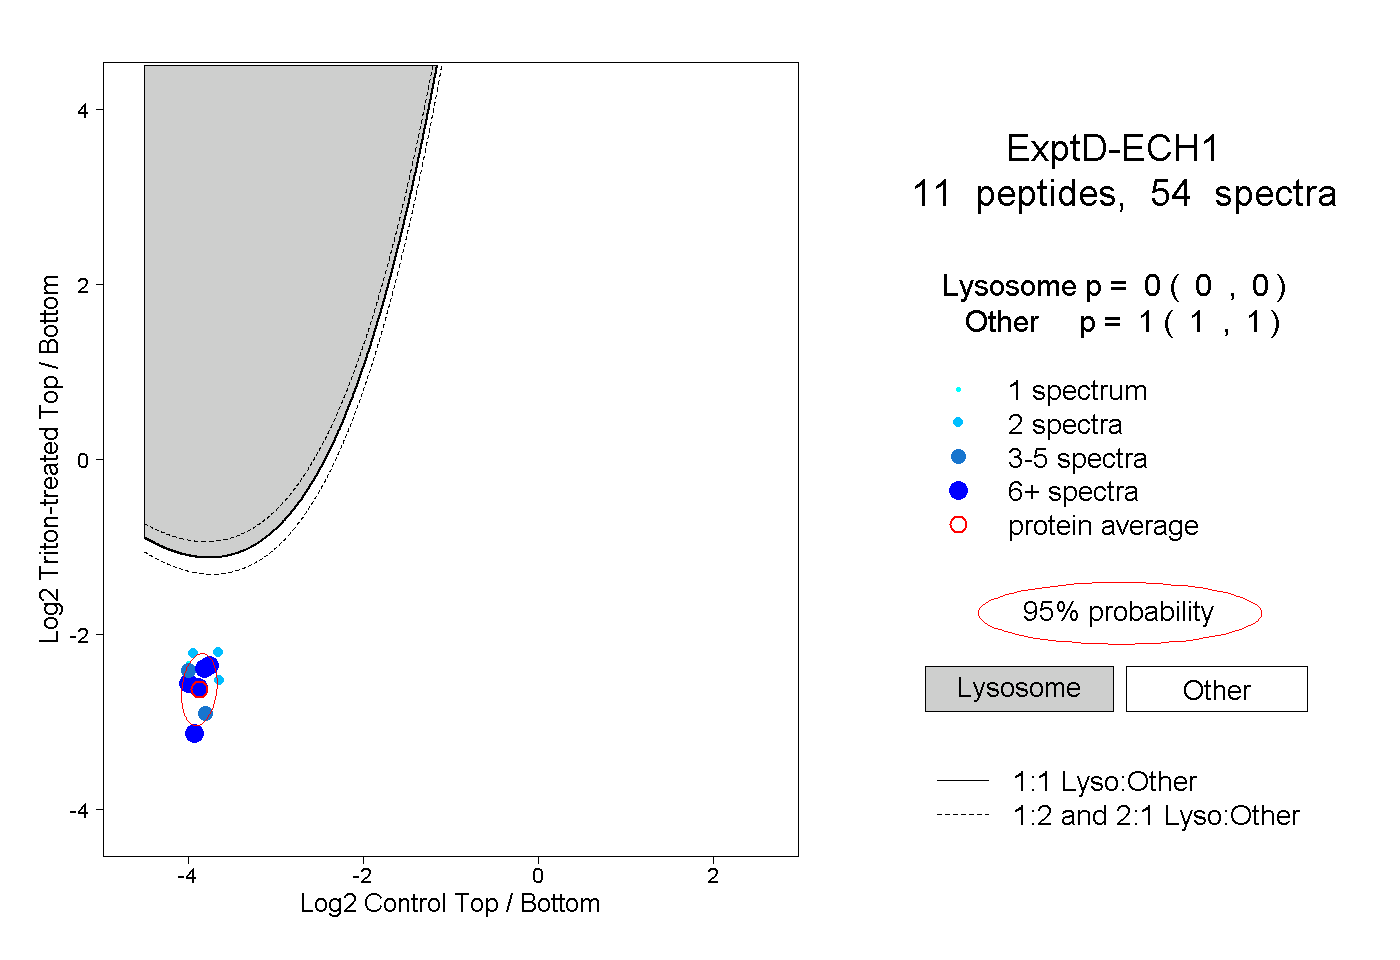
0.000 | 0.000
1.000 | 1.000