 2
2peptides
spectra
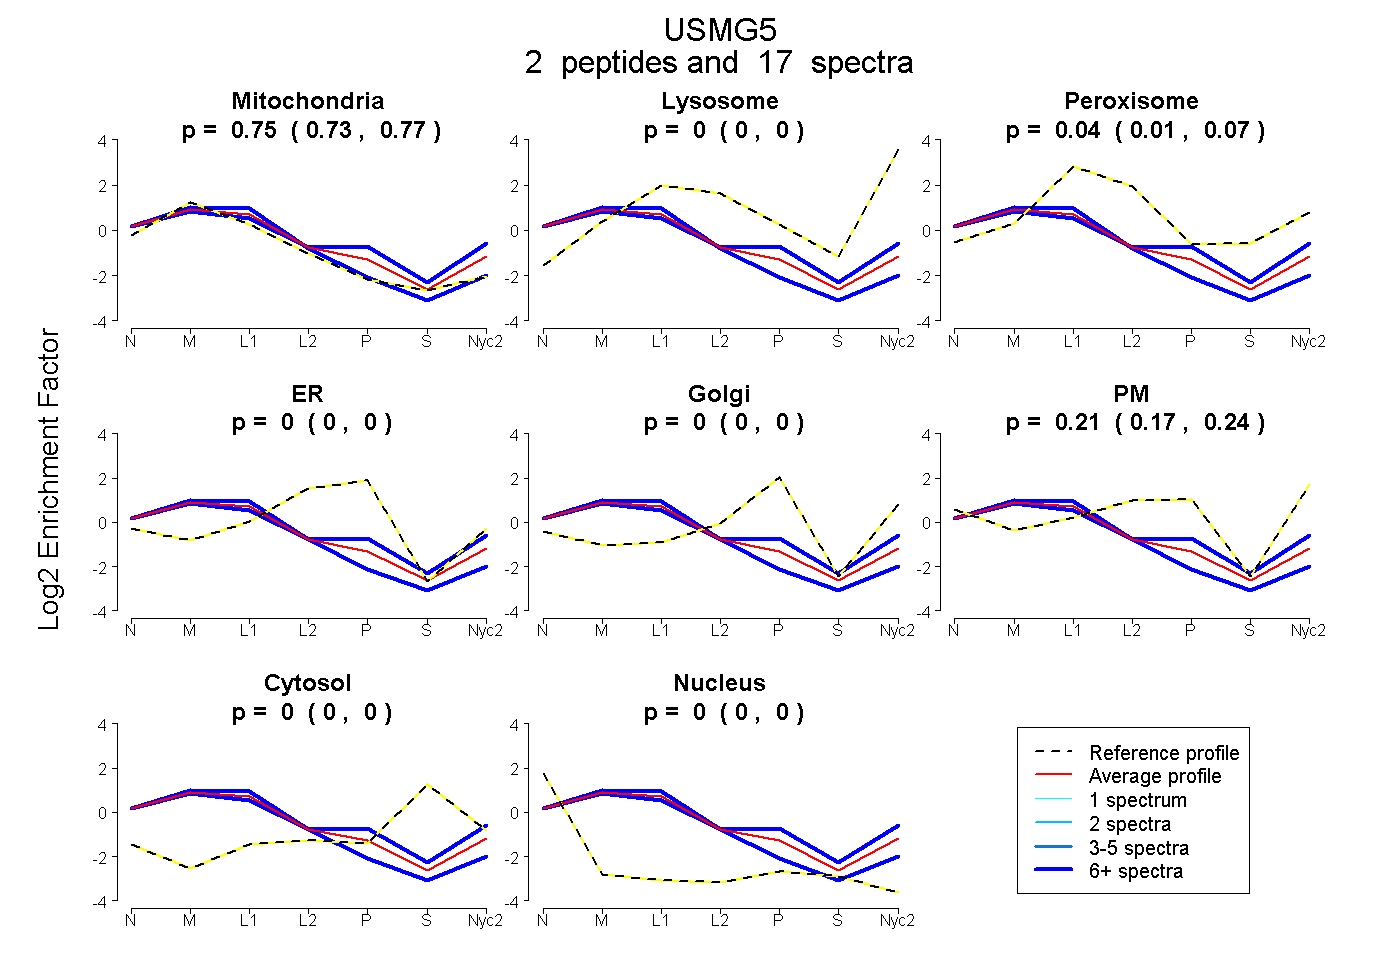
0.726 | 0.772
0.000 | 0.000
0.012 | 0.065
0.000 | 0.000
0.000 | 0.000
0.168 | 0.236
0.000 | 0.000
0.000 | 0.004
2peptides
spectra
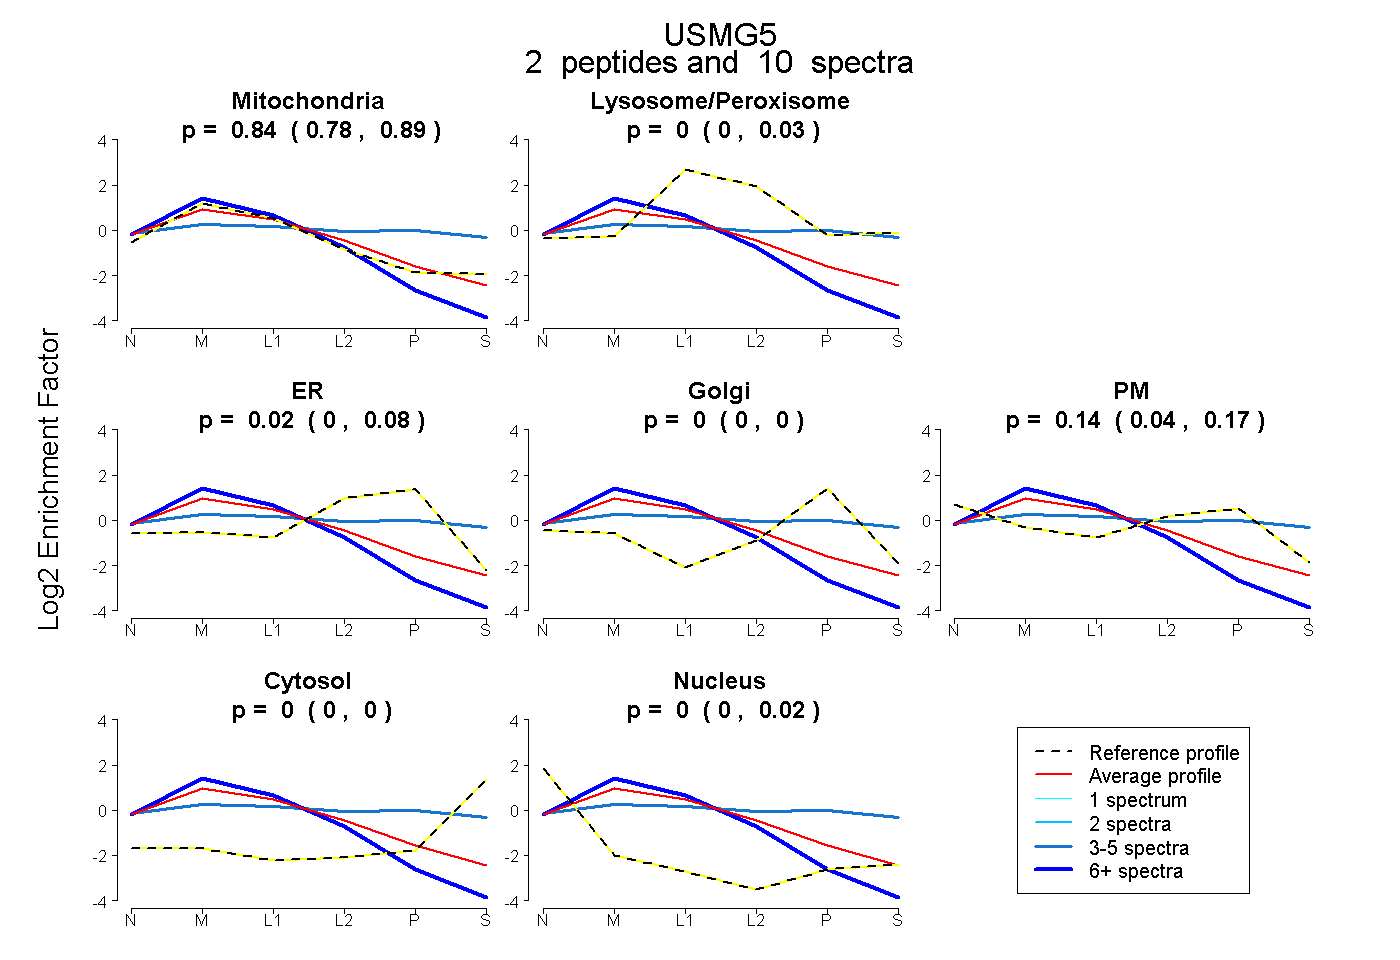
0.782 | 0.885
0.000 | 0.035
0.000 | 0.083
0.000 | 0.000
0.040 | 0.168
0.000 | 0.000
0.000 | 0.021
2peptides
spectra
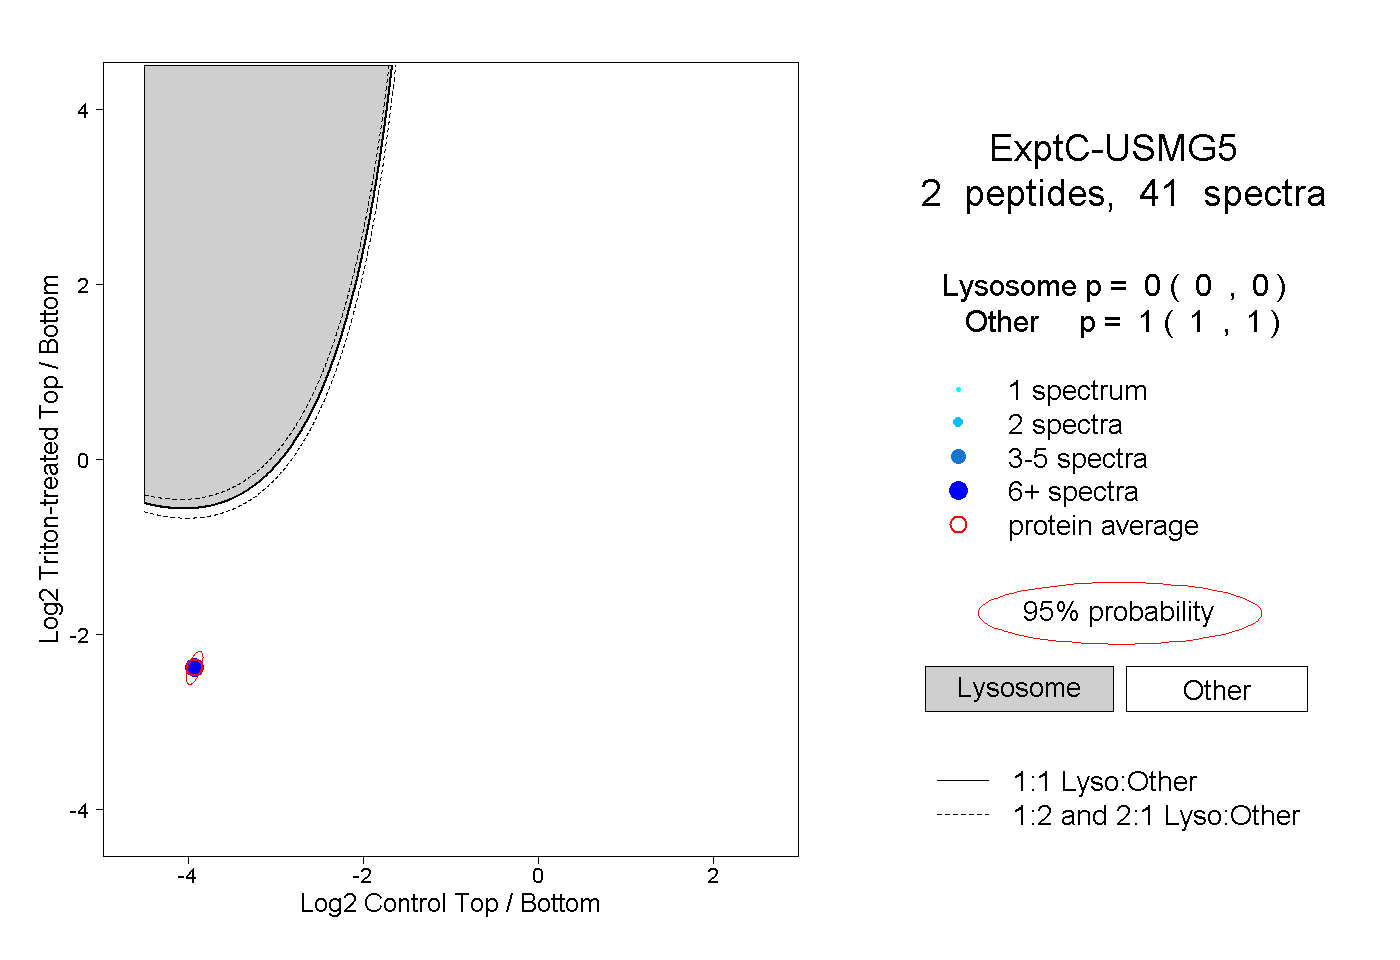
0.000 | 0.000
1.000 | 1.000
1peptide
spectrum
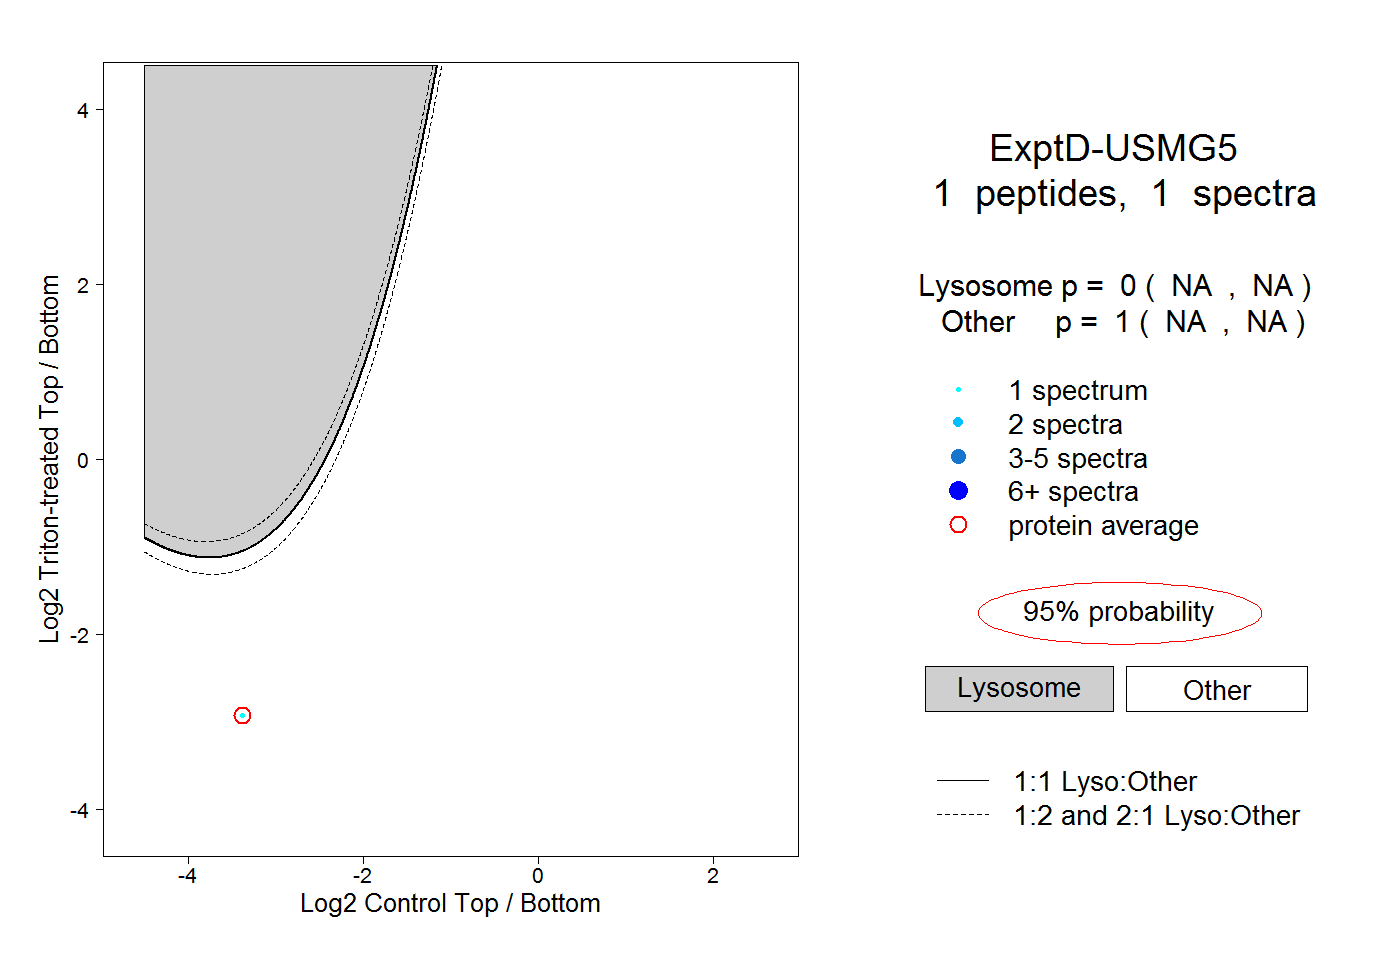
NA | NA
NA | NA