 2
2peptides
spectra
0.726 | 0.772
0.000 | 0.000
0.012 | 0.065
0.000 | 0.000
0.000 | 0.000
0.168 | 0.236
0.000 | 0.000
0.000 | 0.004
| Plot | Mito | Lyso | Perox | ER | Golgi | PM | Cytosol | Nucleus | |||||
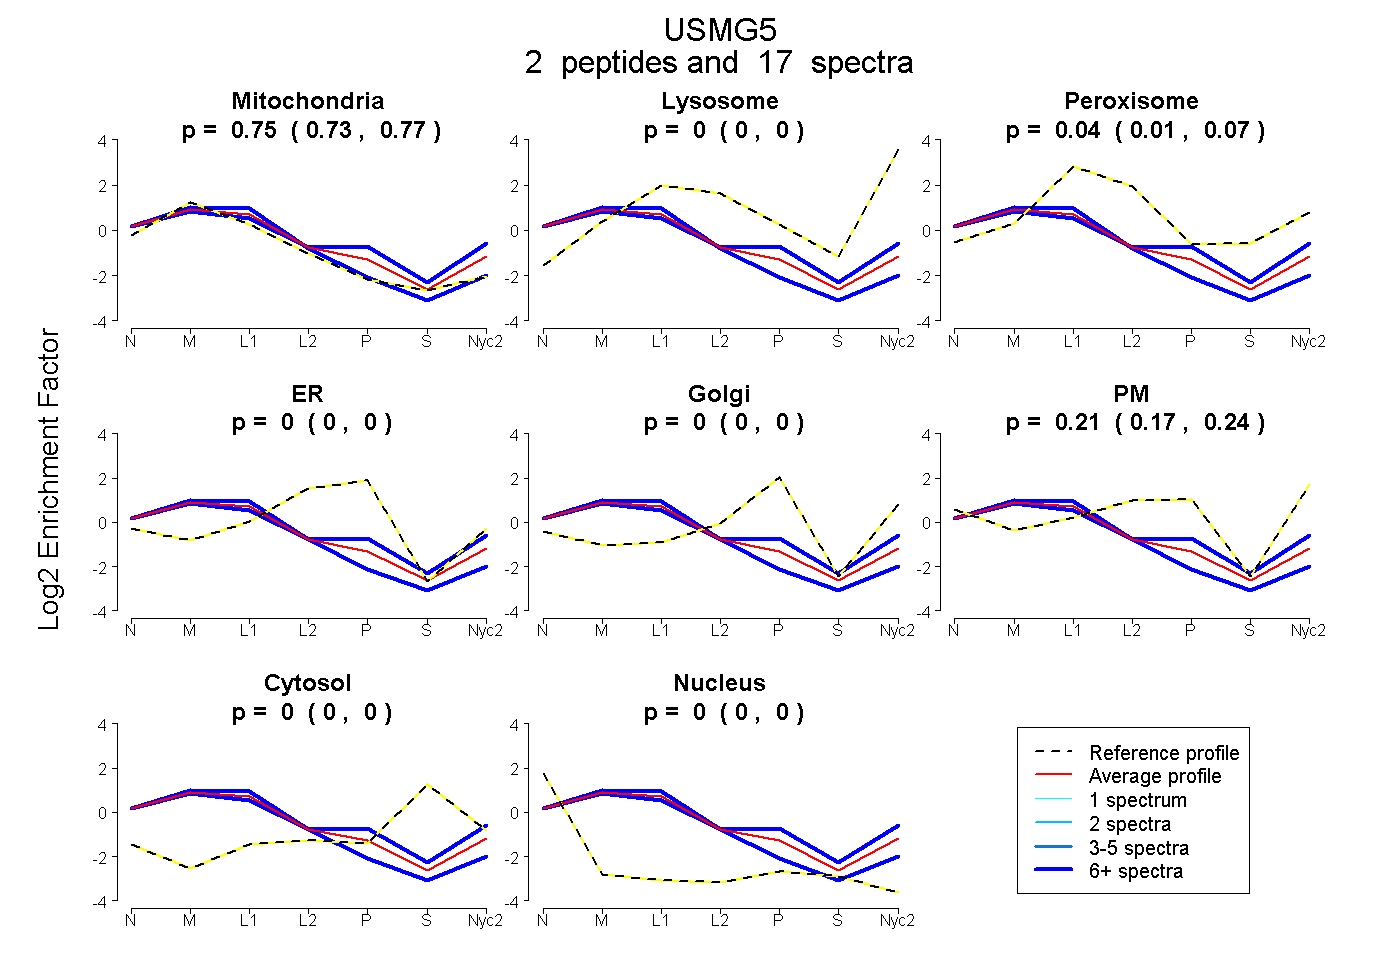
| Expt A |
2 peptides |
17 spectra |
|
0.754 0.726 | 0.772 |
0.000 0.000 | 0.000 |
0.039 0.012 | 0.065 |
0.000 0.000 | 0.000 |
0.000 0.000 | 0.000 |
0.207 0.168 | 0.236 |
0.000 0.000 | 0.000 |
0.000 0.000 | 0.004 |
| 7 spectra, AGPESDGQFQFTGIK | 0.931 | 0.000 | 0.062 | 0.003 | 0.000 | 0.000 | 0.000 | 0.003 | ||
| 10 spectra, YFNSYTLTGR | 0.626 | 0.030 | 0.023 | 0.000 | 0.066 | 0.255 | 0.000 | 0.000 |
| Plot | Mito | Lyso or Perox | ER | Golgi | PM | Cytosol | Nucleus | ||||||
| Expt B |
2 peptides |
10 spectra |
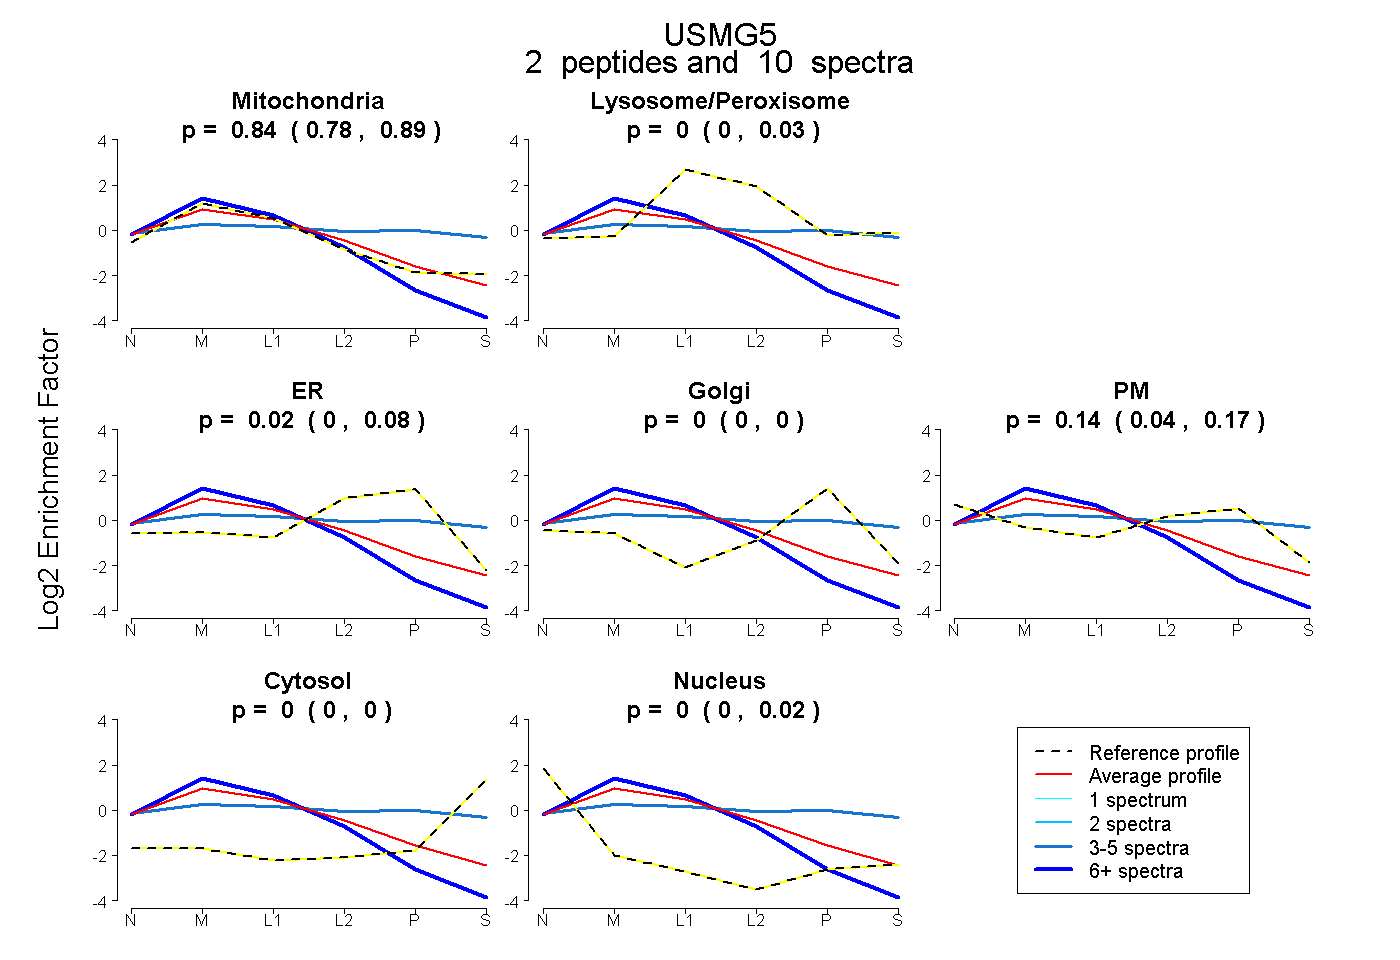 |
0.844 0.782 | 0.885 |
0.000 0.000 | 0.035 |
0.016 0.000 | 0.083 |
0.000 0.000 | 0.000 |
0.140 0.040 | 0.168 |
0.000 0.000 | 0.000 |
0.000 0.000 | 0.021 |
|||
| Plot | Lyso | Other | |||||||||||
| Expt C |
2 peptides |
41 spectra |
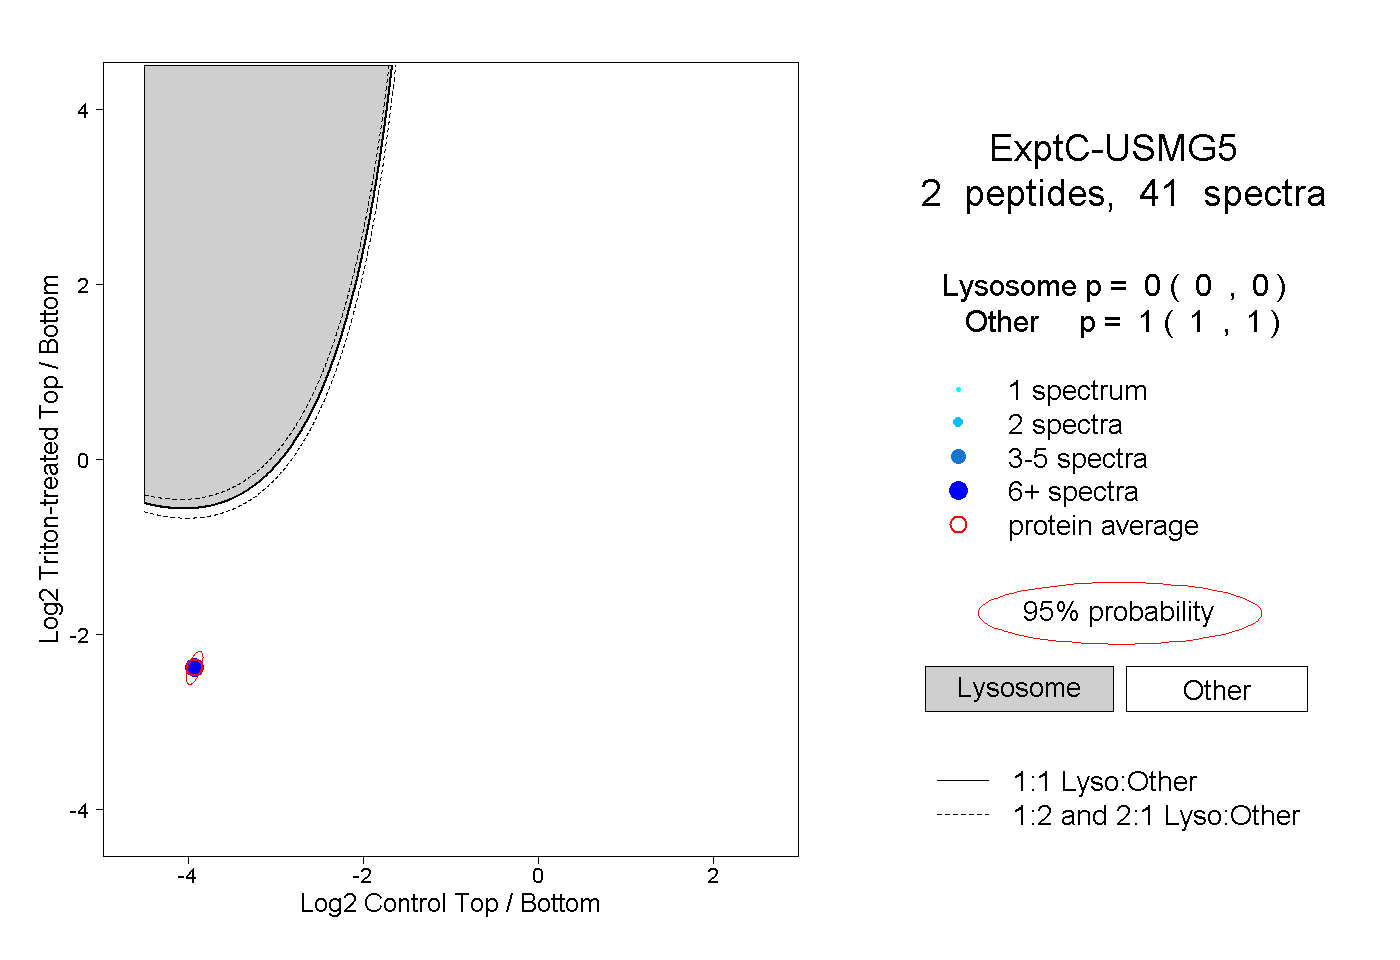 |
0.000 0.000 | 0.000 |
1.000 1.000 | 1.000 |
||||||||
| Plot | Lyso | Other | |||||||||||
| Expt D |
1 peptide |
1 spectrum |
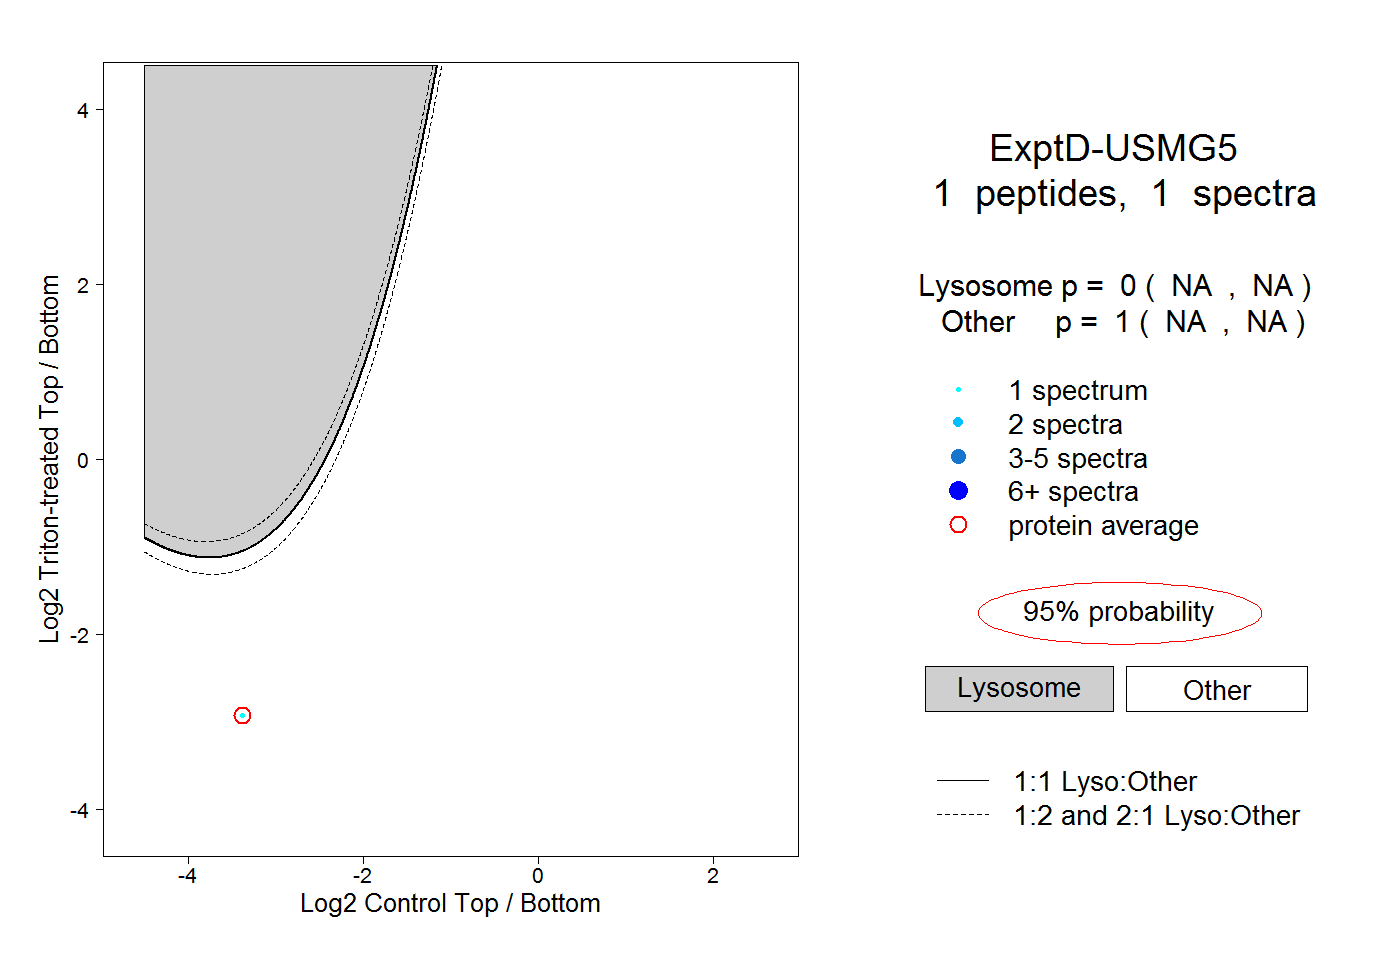 |
0.000 NA | NA |
1.000 NA | NA |