 21
21peptides
spectra
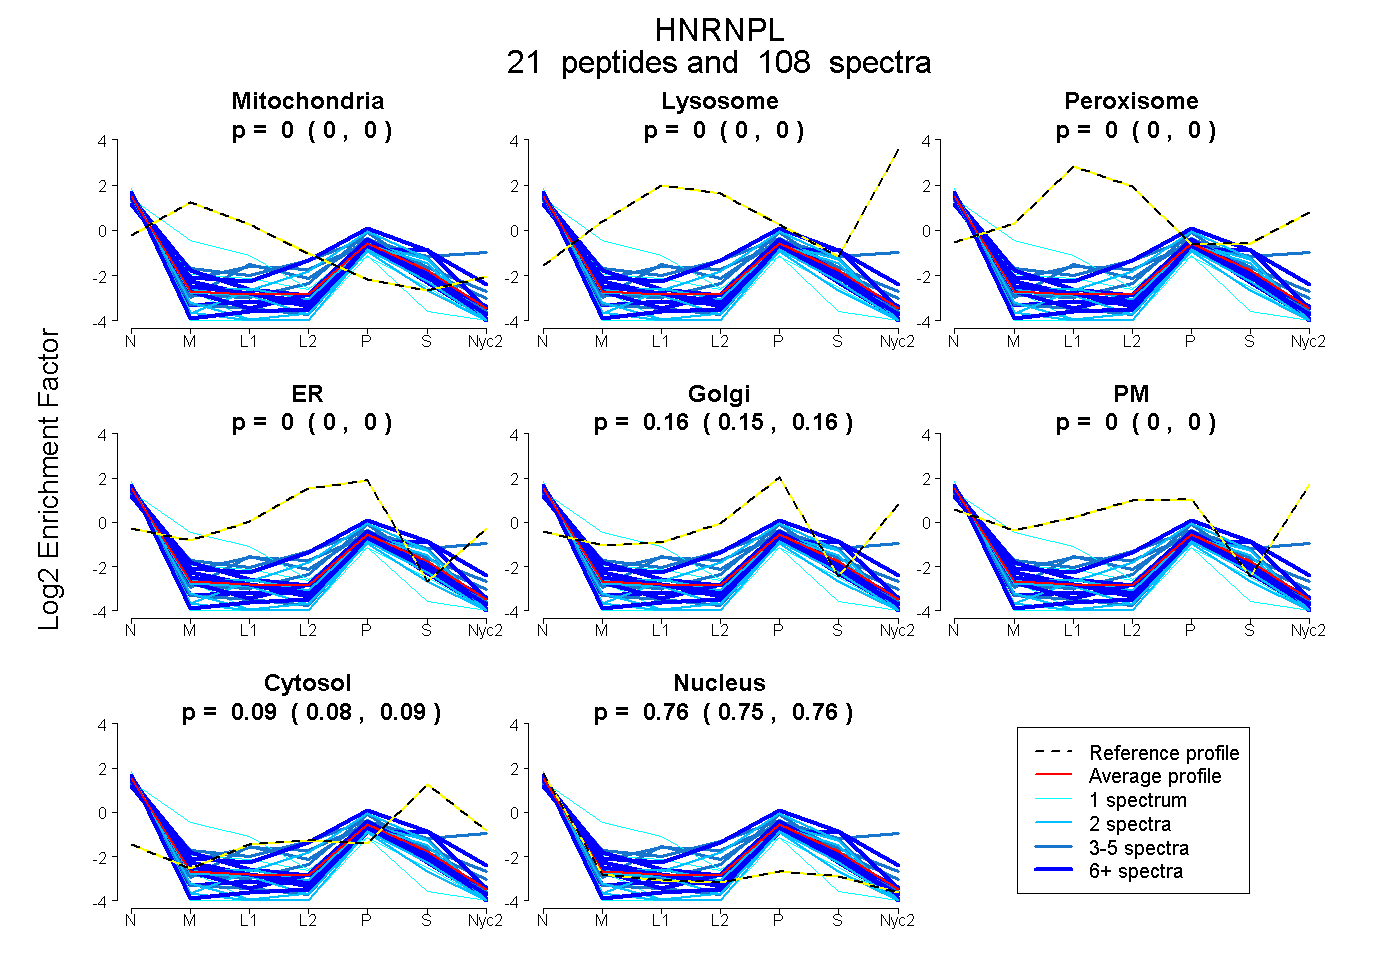
0.000 | 0.000
0.000 | 0.000
0.000 | 0.000
0.000 | 0.000
0.154 | 0.162
0.000 | 0.000
0.081 | 0.089
0.753 | 0.760
6peptides
spectra
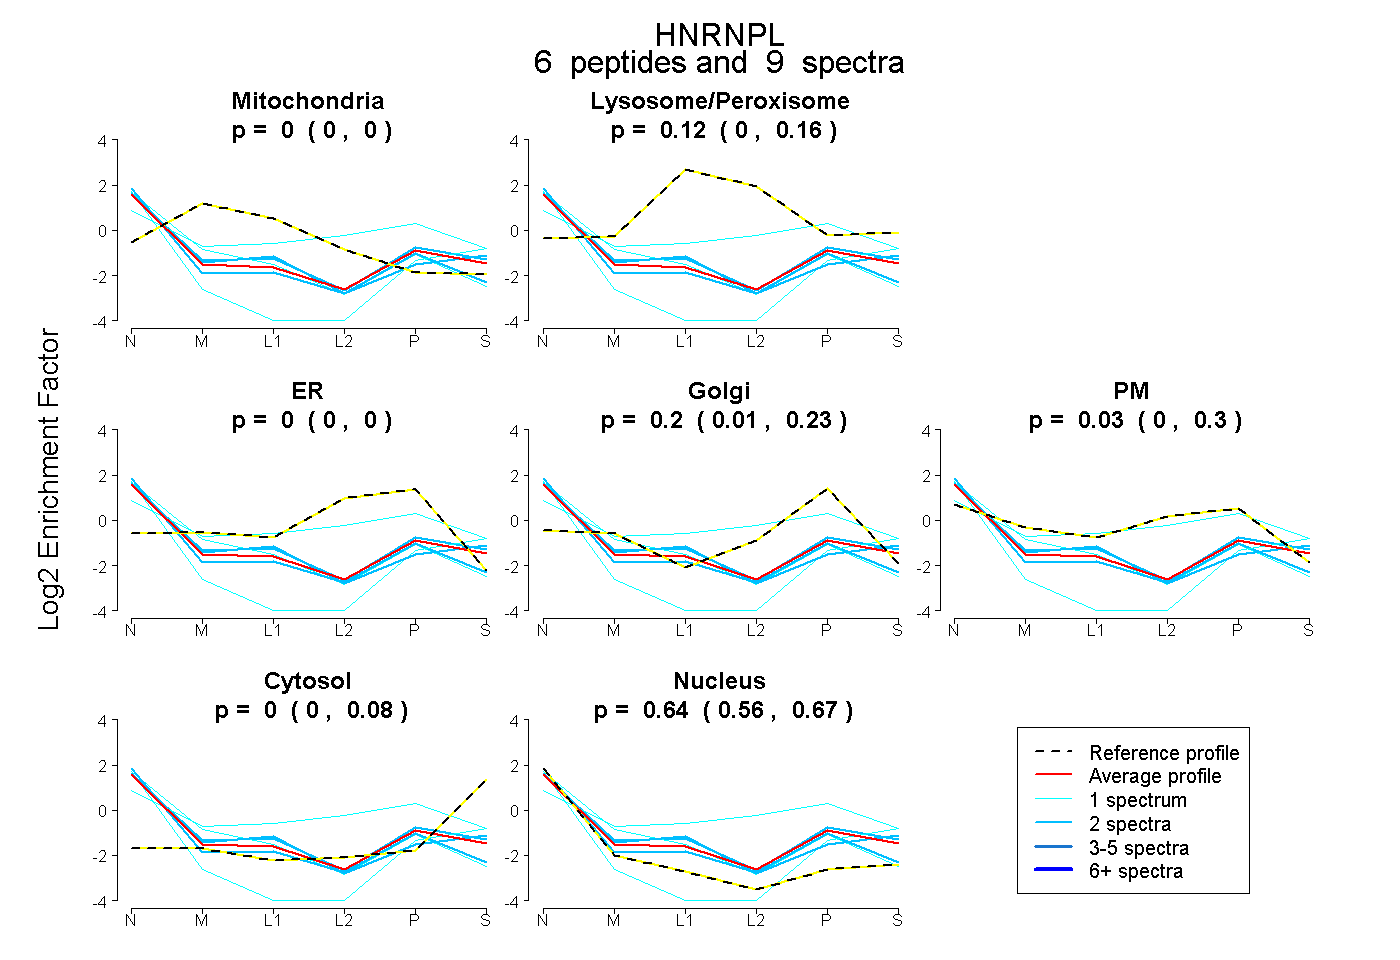
0.000 | 0.000
0.003 | 0.157
0.000 | 0.000
0.010 | 0.232
0.000 | 0.303
0.000 | 0.076
0.555 | 0.670
3peptides
spectra
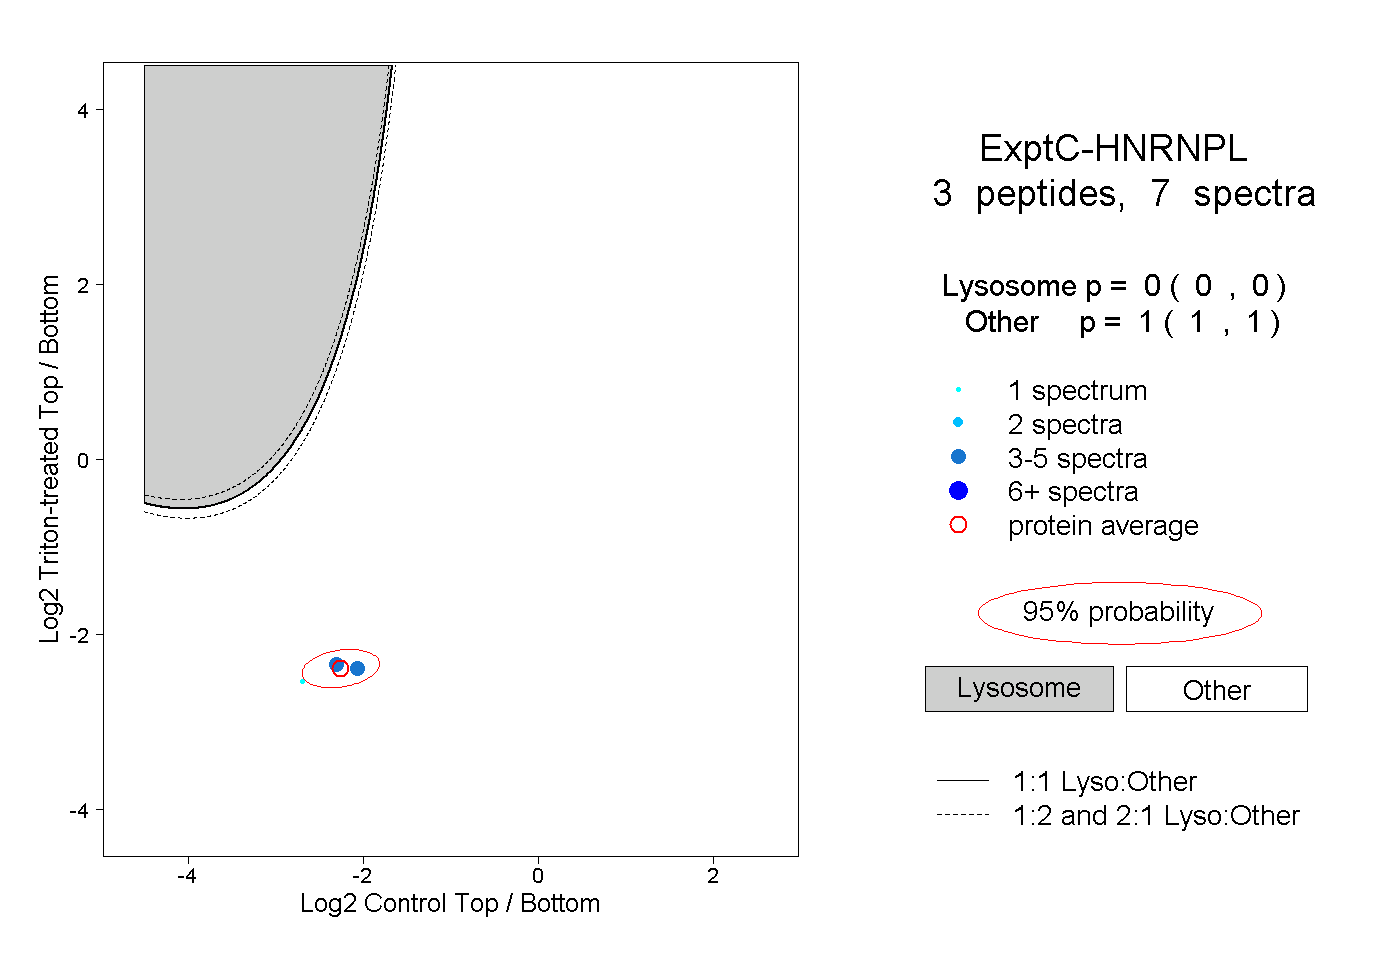
0.000 | 0.000
1.000 | 1.000