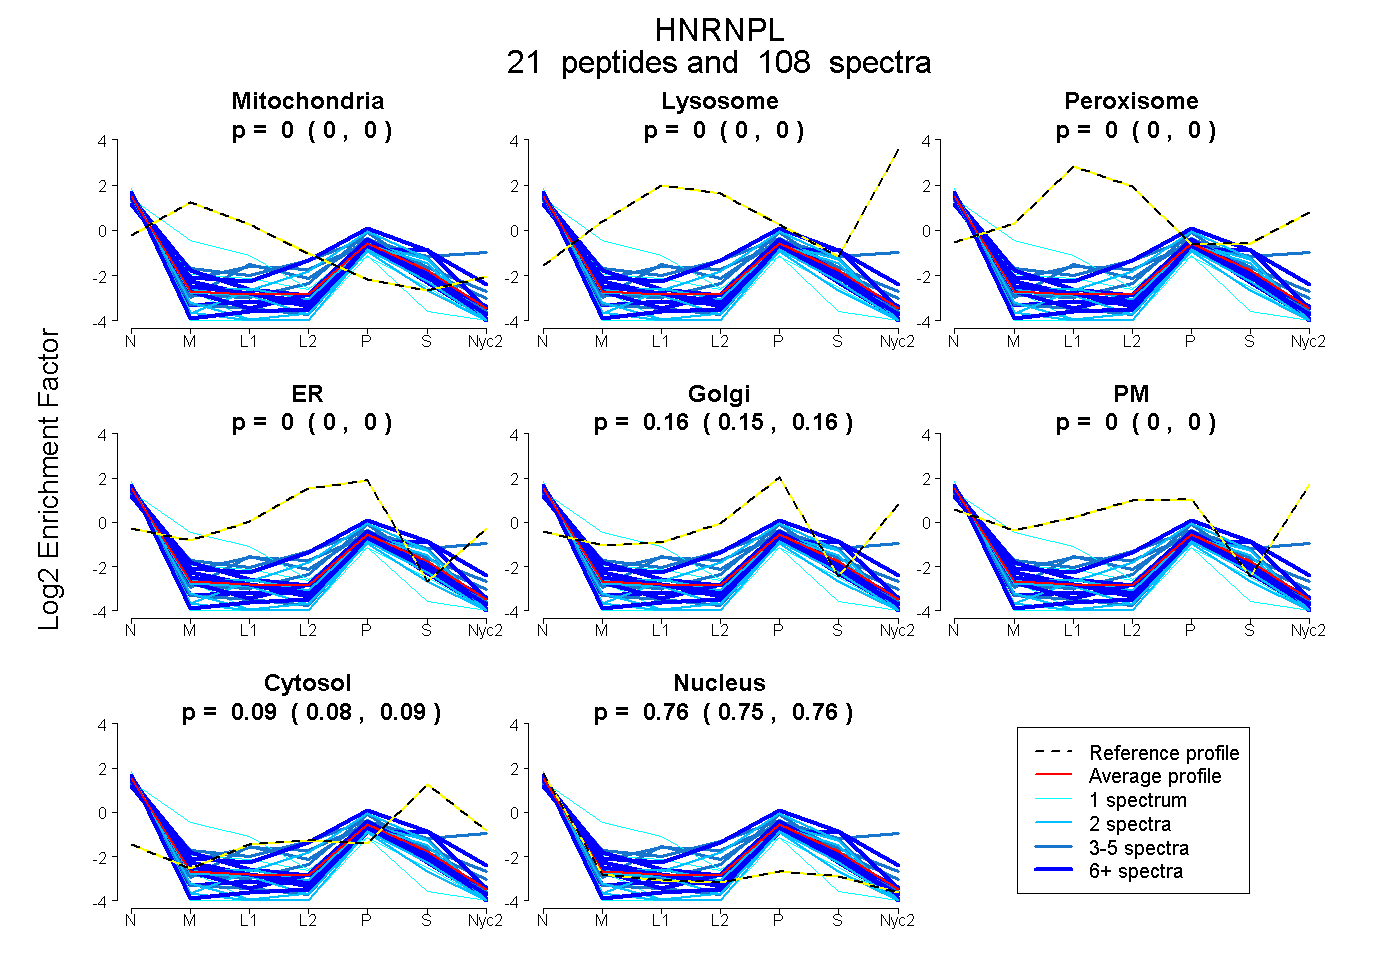
 21
21peptides
spectra
0.000 | 0.000
0.000 | 0.000
0.000 | 0.000
0.000 | 0.000
0.154 | 0.162
0.000 | 0.000
0.081 | 0.089
0.753 | 0.760
| Plot | Mito | Lyso | Perox | ER | Golgi | PM | Cytosol | Nucleus | |||||
| Expt A |
21 peptides |
108 spectra |
|
0.000 0.000 | 0.000 |
0.000 0.000 | 0.000 |
0.000 0.000 | 0.000 |
0.000 0.000 | 0.000 |
0.158 0.154 | 0.162 |
0.000 0.000 | 0.000 |
0.085 0.081 | 0.089 |
0.757 0.753 | 0.760 |
| 12 spectra, MGPPVGGHR | 0.000 | 0.000 | 0.000 | 0.222 | 0.082 | 0.000 | 0.252 | 0.444 | ||
| 9 spectra, MNVCVSK | 0.000 | 0.000 | 0.000 | 0.061 | 0.145 | 0.000 | 0.036 | 0.757 | ||
| 1 spectrum, MAAAGGGGGGGR | 0.000 | 0.000 | 0.000 | 0.000 | 0.000 | 0.000 | 0.000 | 1.000 | ||
| 1 spectrum, GFPSVDSR | 0.434 | 0.000 | 0.000 | 0.035 | 0.000 | 0.000 | 0.000 | 0.531 | ||
| 9 spectra, FSTPEQAAK | 0.000 | 0.000 | 0.000 | 0.000 | 0.167 | 0.000 | 0.000 | 0.833 | ||
| 3 spectra, ASLNGADIYSGCCTLK | 0.000 | 0.000 | 0.000 | 0.175 | 0.000 | 0.000 | 0.180 | 0.645 | ||
| 12 spectra, SKPGAAMVEMADGYAVDR | 0.000 | 0.000 | 0.000 | 0.000 | 0.135 | 0.000 | 0.025 | 0.840 | ||
| 4 spectra, AITHLNNNFMFGQK | 0.000 | 0.000 | 0.000 | 0.000 | 0.251 | 0.000 | 0.058 | 0.690 | ||
| 5 spectra, ISRPGDSDDSR | 0.000 | 0.000 | 0.000 | 0.341 | 0.000 | 0.000 | 0.113 | 0.545 | ||
| 4 spectra, DFSESR | 0.000 | 0.000 | 0.000 | 0.000 | 0.026 | 0.312 | 0.243 | 0.419 | ||
| 10 spectra, YYGGGNEGGR | 0.000 | 0.000 | 0.000 | 0.000 | 0.077 | 0.000 | 0.057 | 0.865 | ||
| 2 spectra, VFNVFCLYGNVEK | 0.000 | 0.000 | 0.000 | 0.000 | 0.038 | 0.000 | 0.000 | 0.962 | ||
| 2 spectra, SDALETLGFLNHYQMK | 0.000 | 0.000 | 0.000 | 0.000 | 0.044 | 0.000 | 0.134 | 0.822 | ||
| 2 spectra, QPAIMPGQSYGLEDGSCSYK | 0.000 | 0.000 | 0.000 | 0.053 | 0.018 | 0.000 | 0.175 | 0.754 | ||
| 1 spectrum, IEYAKPTR | 0.000 | 0.000 | 0.000 | 0.000 | 0.045 | 0.000 | 0.000 | 0.955 | ||
| 2 spectra, QQPDEQLR | 0.000 | 0.000 | 0.000 | 0.158 | 0.000 | 0.000 | 0.162 | 0.680 | ||
| 2 spectra, SSSGLLEWDSK | 0.000 | 0.000 | 0.000 | 0.000 | 0.015 | 0.000 | 0.002 | 0.983 | ||
| 1 spectrum, AGAMVK | 0.000 | 0.000 | 0.000 | 0.161 | 0.000 | 0.000 | 0.138 | 0.701 | ||
| 3 spectra, NPNGPYPYTLK | 0.000 | 0.000 | 0.000 | 0.000 | 0.076 | 0.000 | 0.043 | 0.880 | ||
| 9 spectra, RPTSVK | 0.000 | 0.000 | 0.000 | 0.000 | 0.137 | 0.000 | 0.041 | 0.821 | ||
| 14 spectra, IVIFR | 0.000 | 0.000 | 0.000 | 0.000 | 0.000 | 0.000 | 0.272 | 0.728 |
| Plot | Mito | Lyso or Perox | ER | Golgi | PM | Cytosol | Nucleus | ||||||
| Expt B |
6 peptides |
9 spectra |
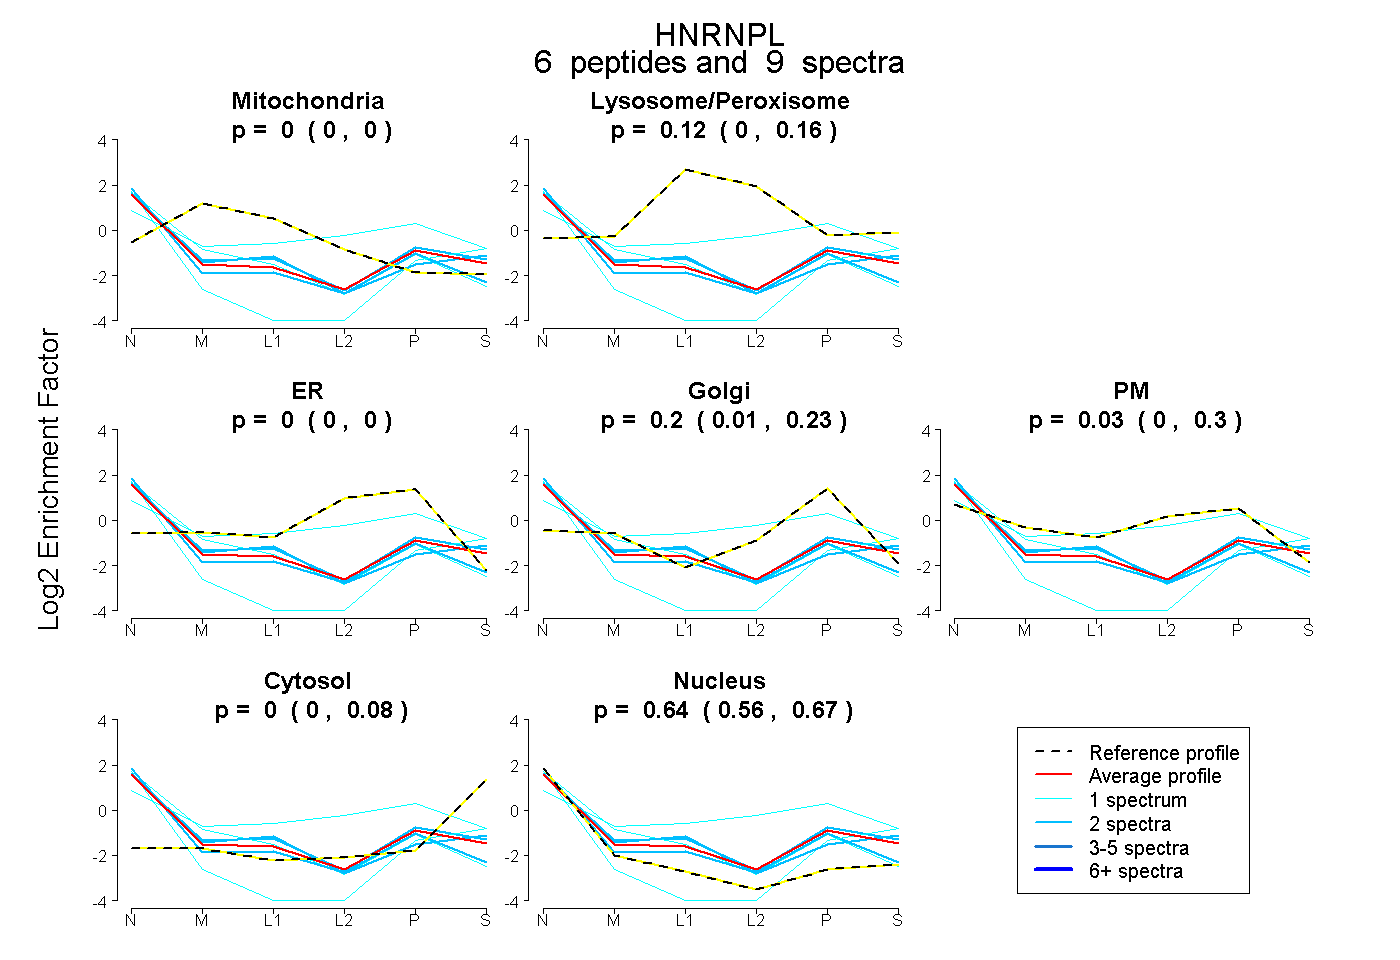 |
0.000 0.000 | 0.000 |
0.124 0.003 | 0.157 |
0.000 0.000 | 0.000 |
0.200 0.010 | 0.232 |
0.031 0.000 | 0.303 |
0.002 0.000 | 0.076 |
0.642 0.555 | 0.670 |
|||
| Plot | Lyso | Other | |||||||||||
| Expt C |
3 peptides |
7 spectra |
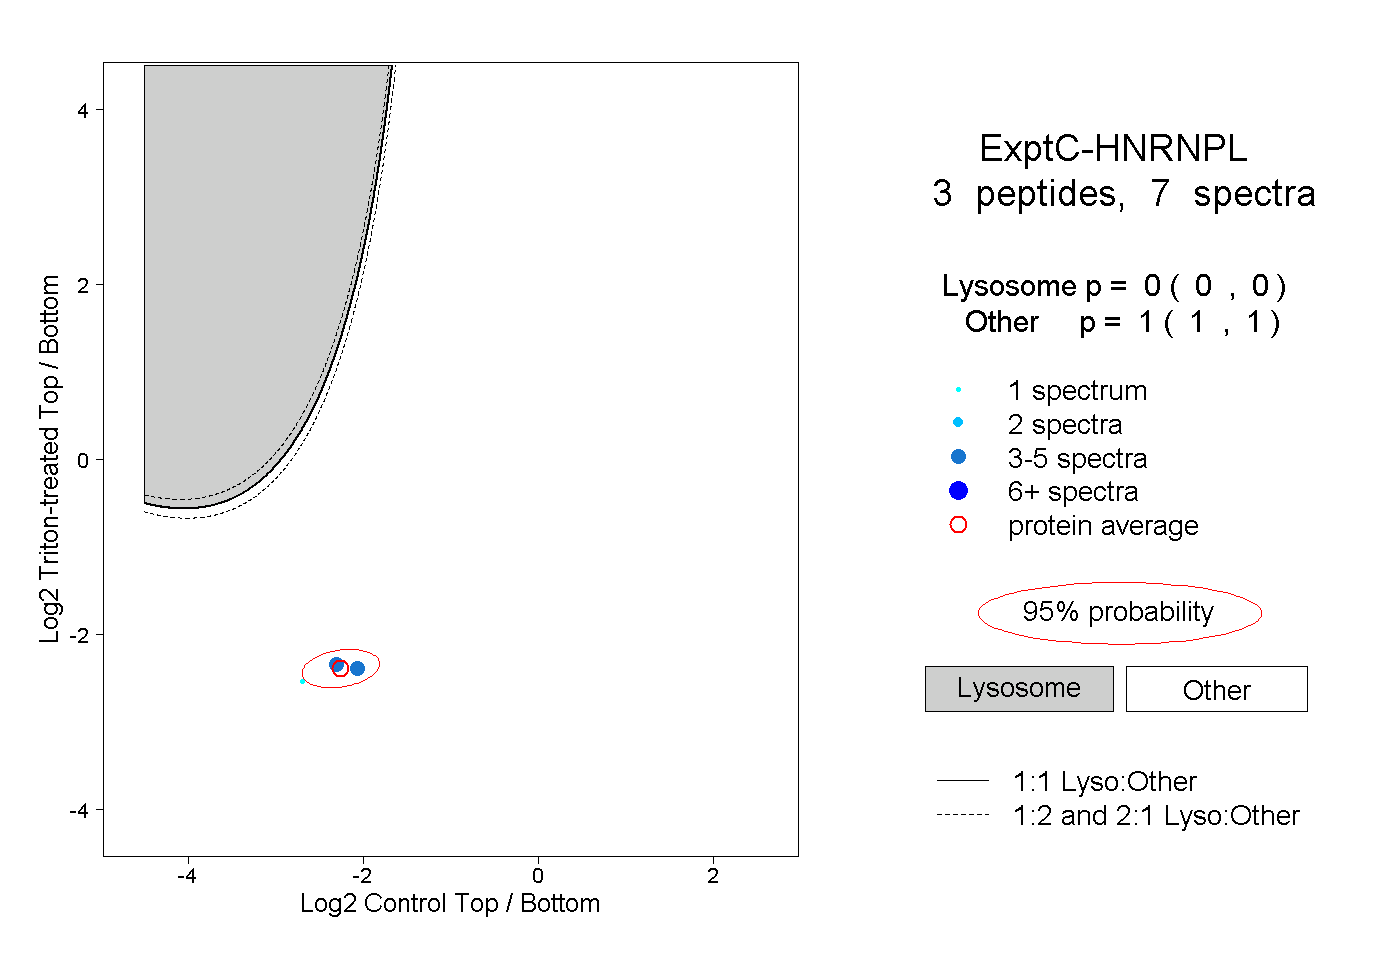 |
0.000 0.000 | 0.000 |
1.000 1.000 | 1.000 |