 3
3peptides
spectra
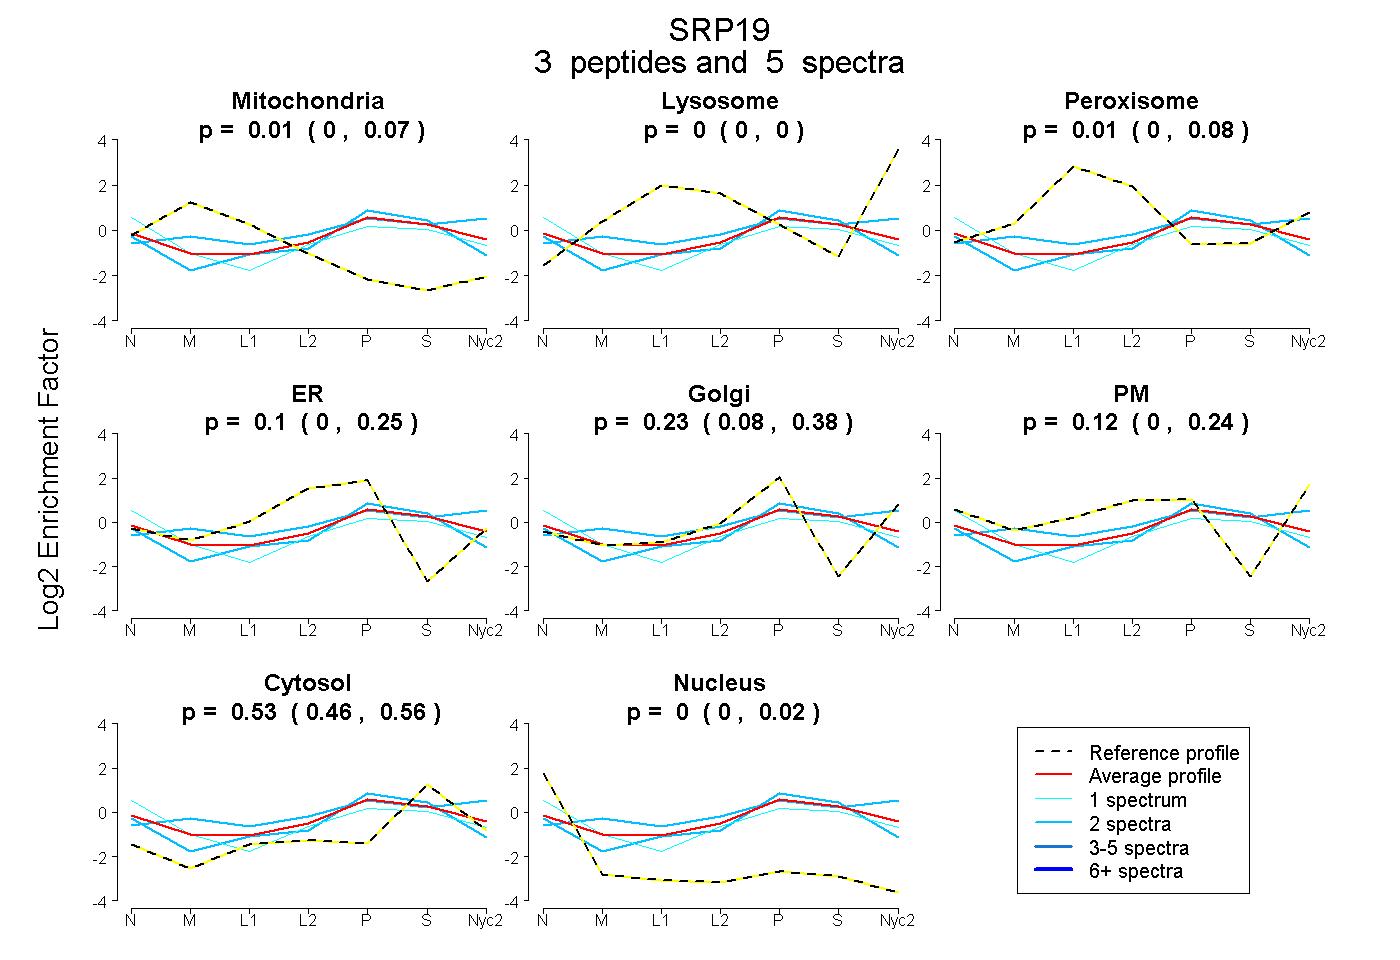
0.000 | 0.066
0.000 | 0.000
0.000 | 0.080
0.000 | 0.247
0.080 | 0.384
0.000 | 0.238
0.460 | 0.560
0.000 | 0.015
1peptide
spectrum
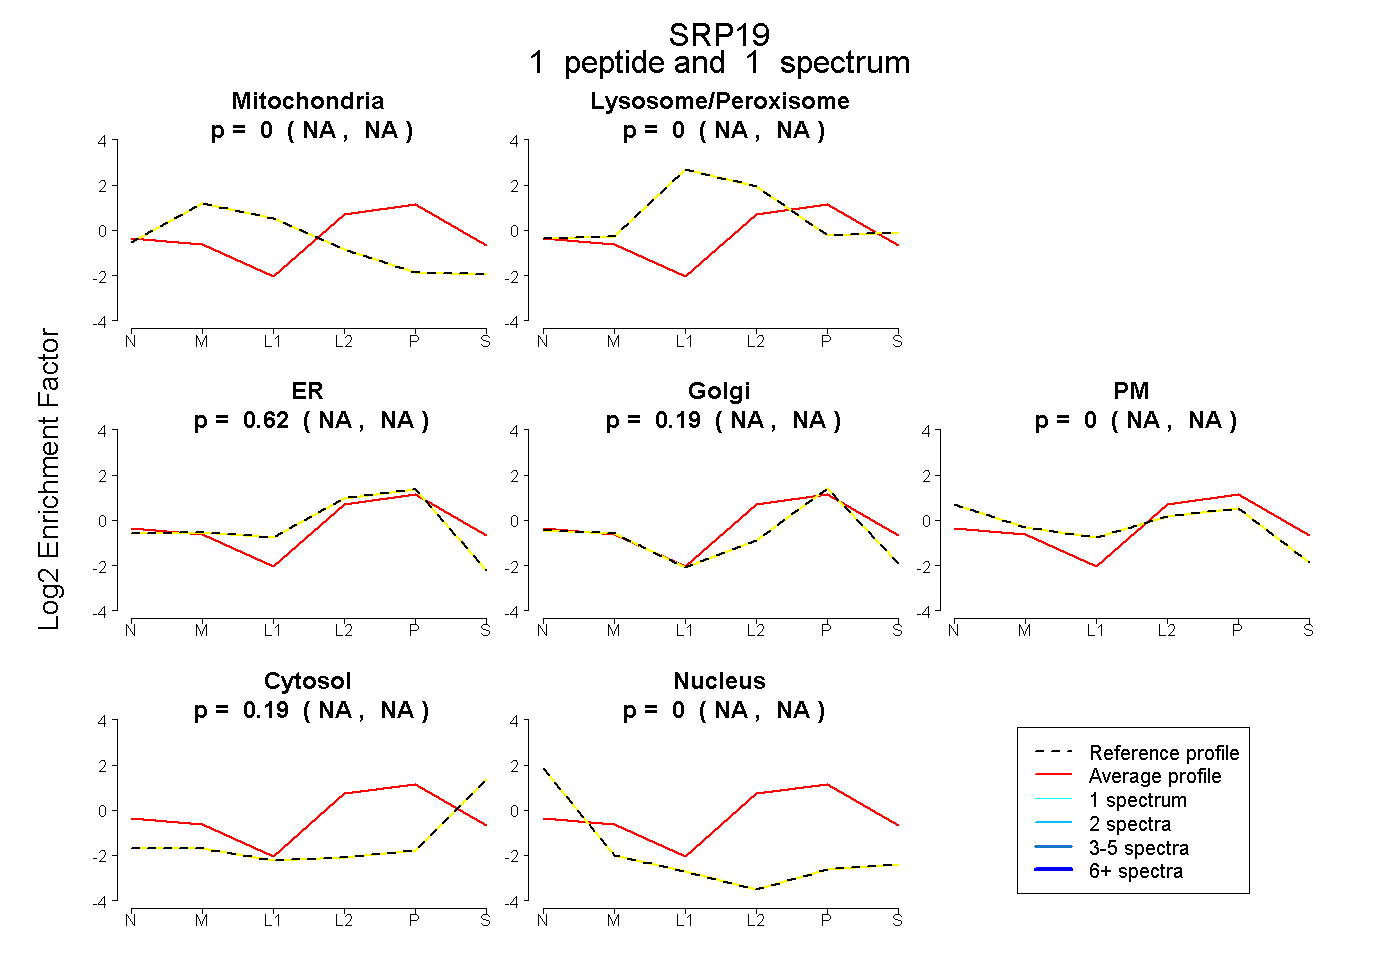
NA | NA
NA | NA
NA | NA
NA | NA
NA | NA
NA | NA
NA | NA
2peptides
spectra
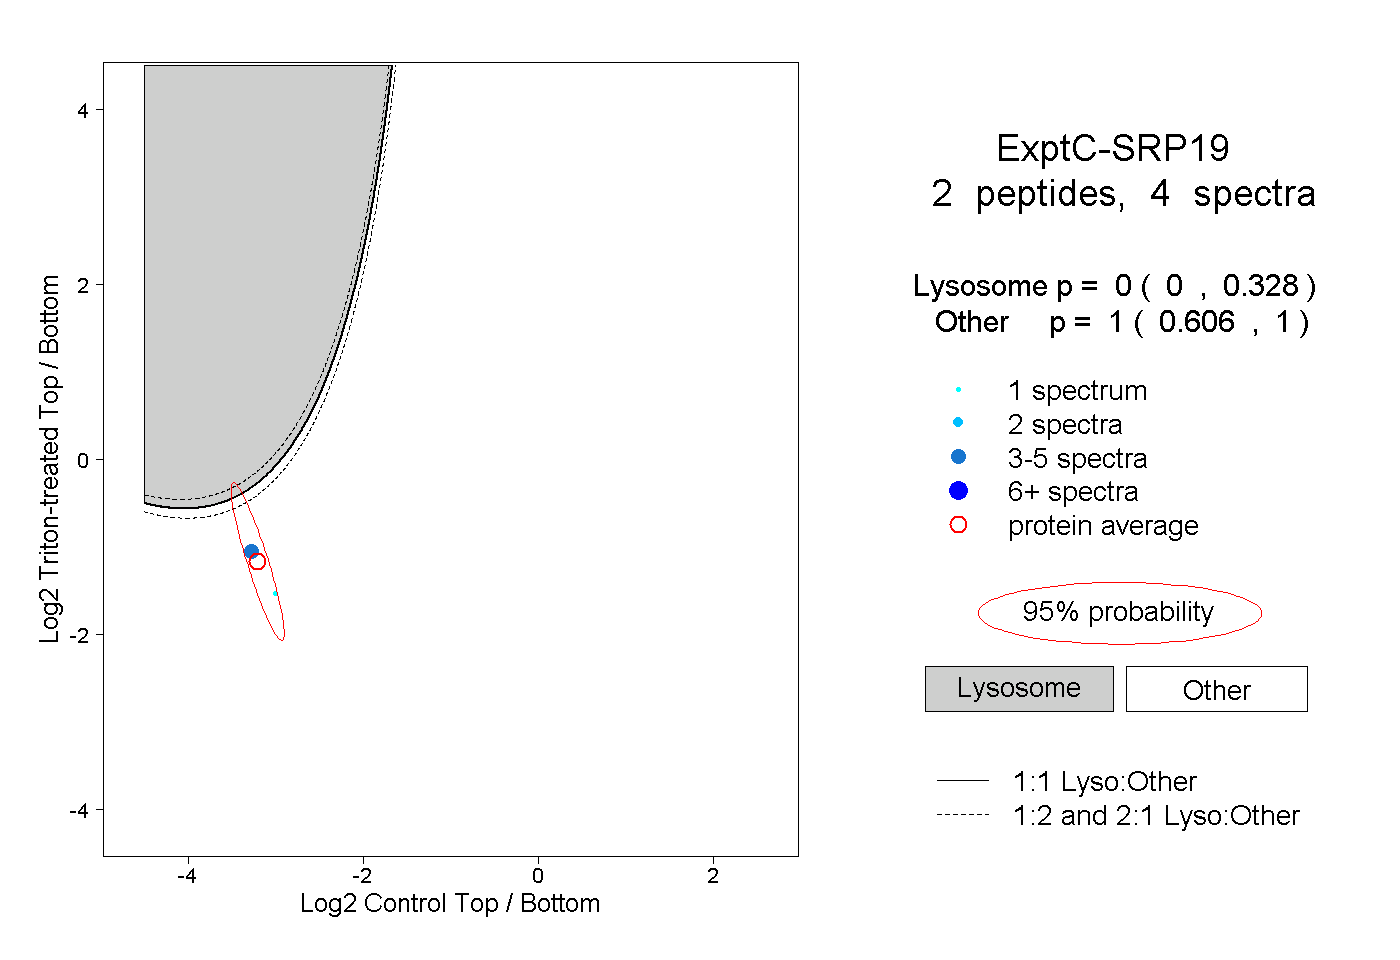
0.000 | 0.328
0.606 | 1.000