 3
3peptides
spectra
0.000 | 0.066
0.000 | 0.000
0.000 | 0.080
0.000 | 0.247
0.080 | 0.384
0.000 | 0.238
0.460 | 0.560
0.000 | 0.015
| Plot | Mito | Lyso | Perox | ER | Golgi | PM | Cytosol | Nucleus | |||||
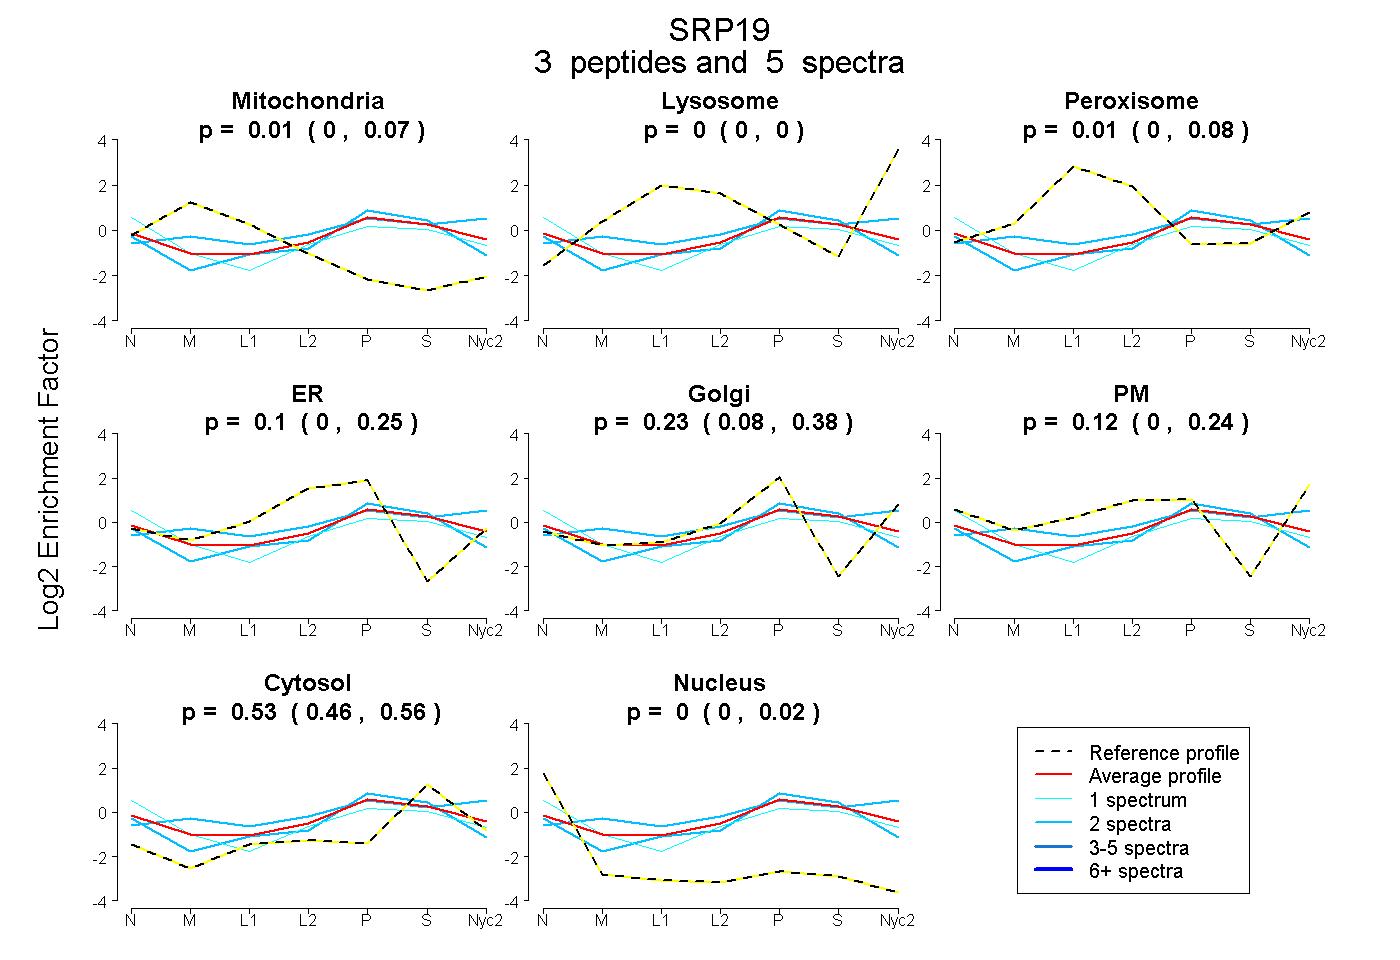
| Expt A |
3 peptides |
5 spectra |
|
0.012 0.000 | 0.066 |
0.000 0.000 | 0.000 |
0.013 0.000 | 0.080 |
0.098 0.000 | 0.247 |
0.235 0.080 | 0.384 |
0.117 0.000 | 0.238 |
0.526 0.460 | 0.560 |
0.000 0.000 | 0.015 |
| 2 spectra, FICIYPAYLNNK | 0.002 | 0.129 | 0.117 | 0.000 | 0.312 | 0.040 | 0.401 | 0.000 | ||
| 1 spectrum, SVMLYVAEMIPK | 0.000 | 0.000 | 0.000 | 0.012 | 0.171 | 0.232 | 0.448 | 0.137 | ||
| 2 spectra, SGGADPSLQQGEGSK | 0.000 | 0.000 | 0.000 | 0.214 | 0.178 | 0.000 | 0.583 | 0.025 |
| Plot | Mito | Lyso or Perox | ER | Golgi | PM | Cytosol | Nucleus | ||||||
| Expt B |
1 peptide |
1 spectrum |
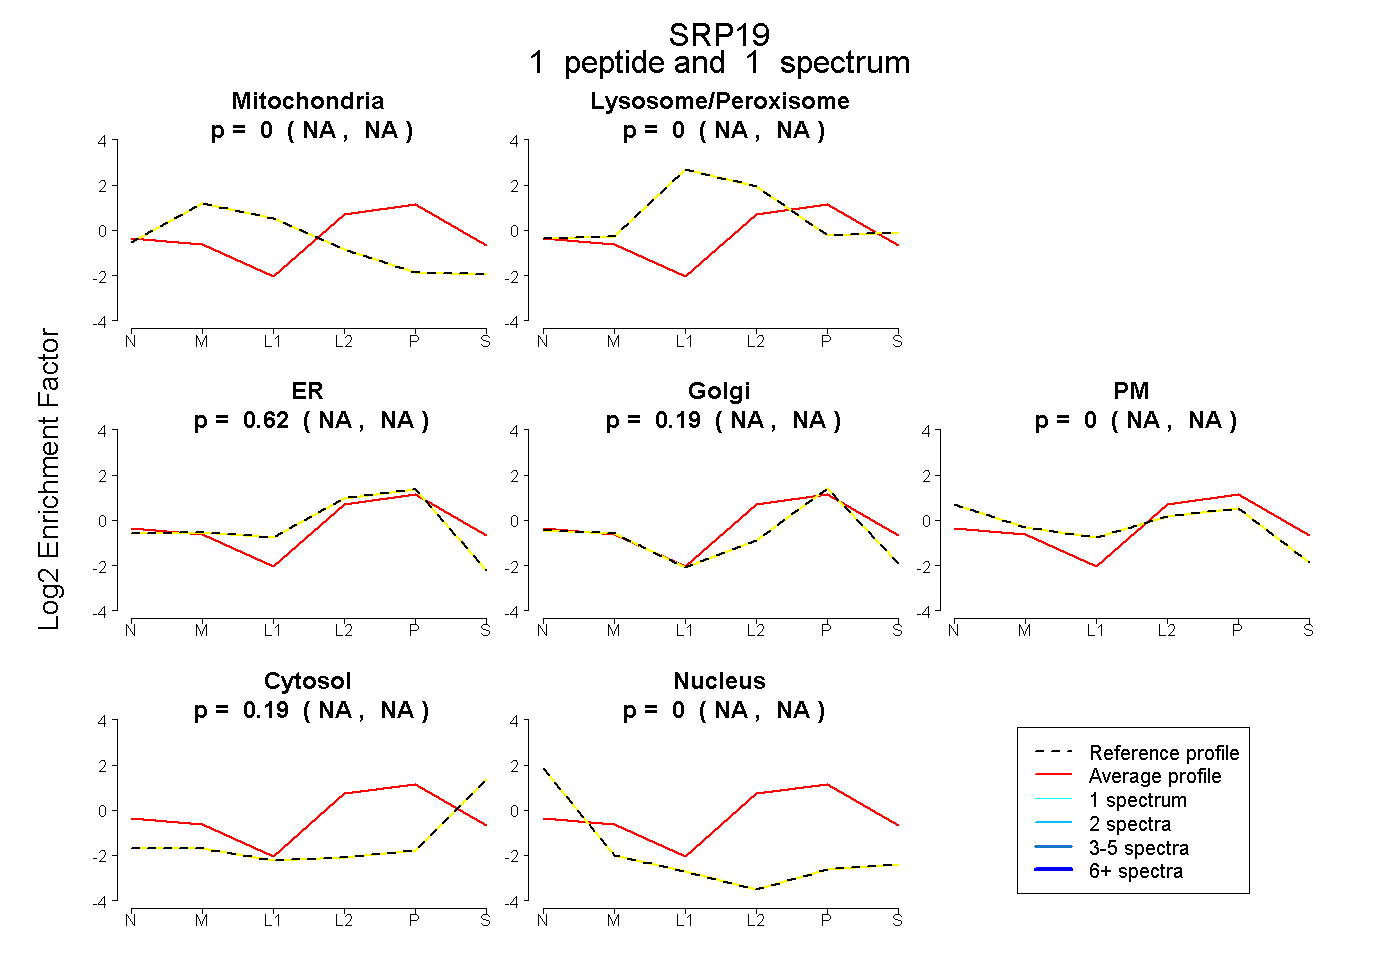 |
0.000 NA | NA |
0.000 NA | NA |
0.618 NA | NA |
0.190 NA | NA |
0.000 NA | NA |
0.192 NA | NA |
0.000 NA | NA |
|||
| Plot | Lyso | Other | |||||||||||
| Expt C |
2 peptides |
4 spectra |
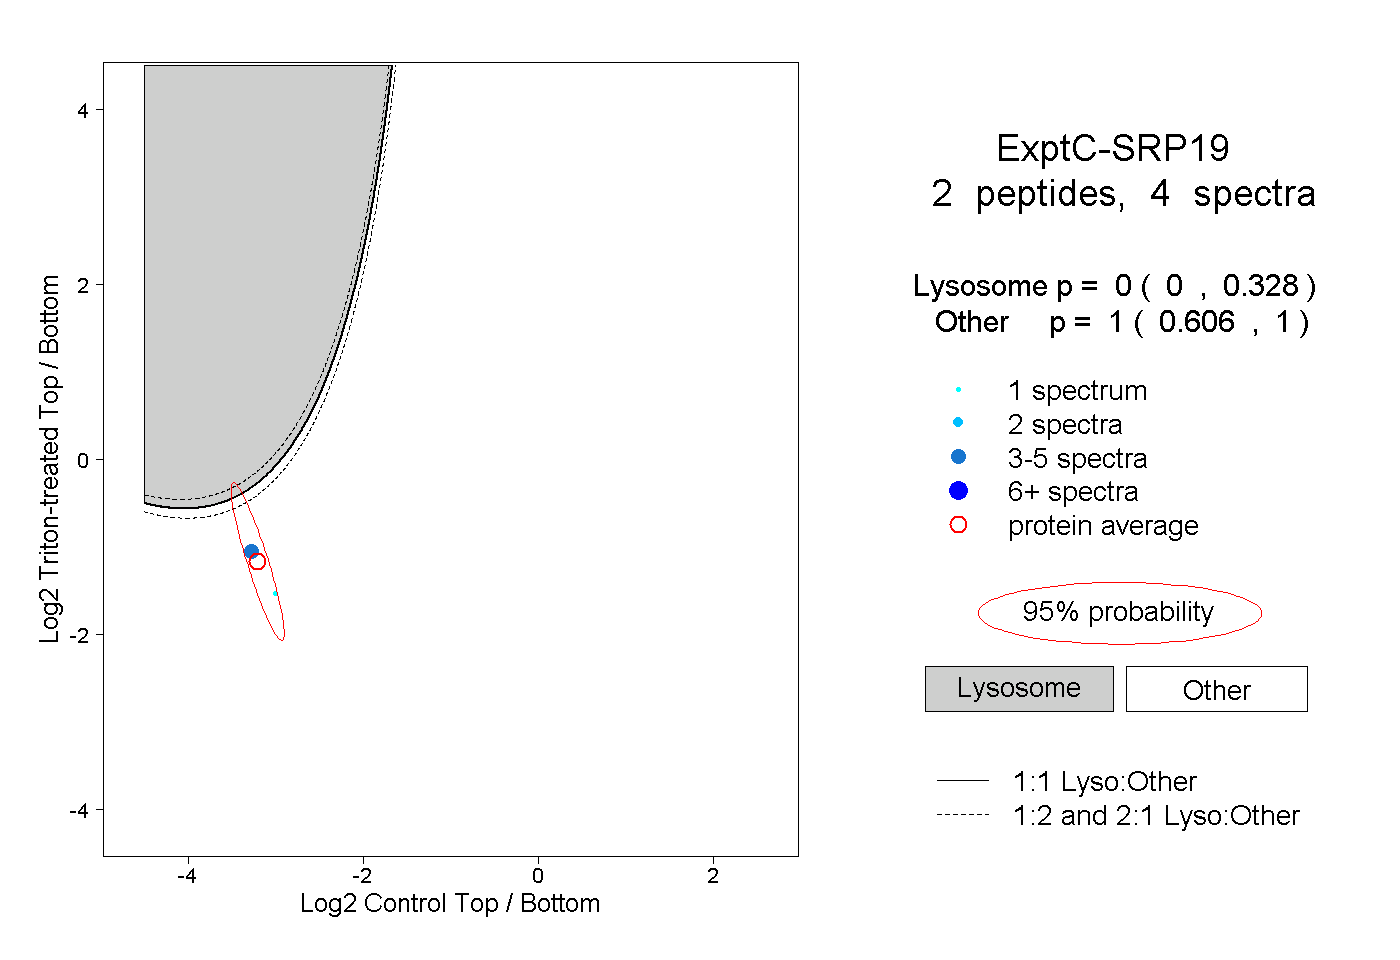 |
0.000 0.000 | 0.328 |
1.000 0.606 | 1.000 |