 6
6peptides
spectra
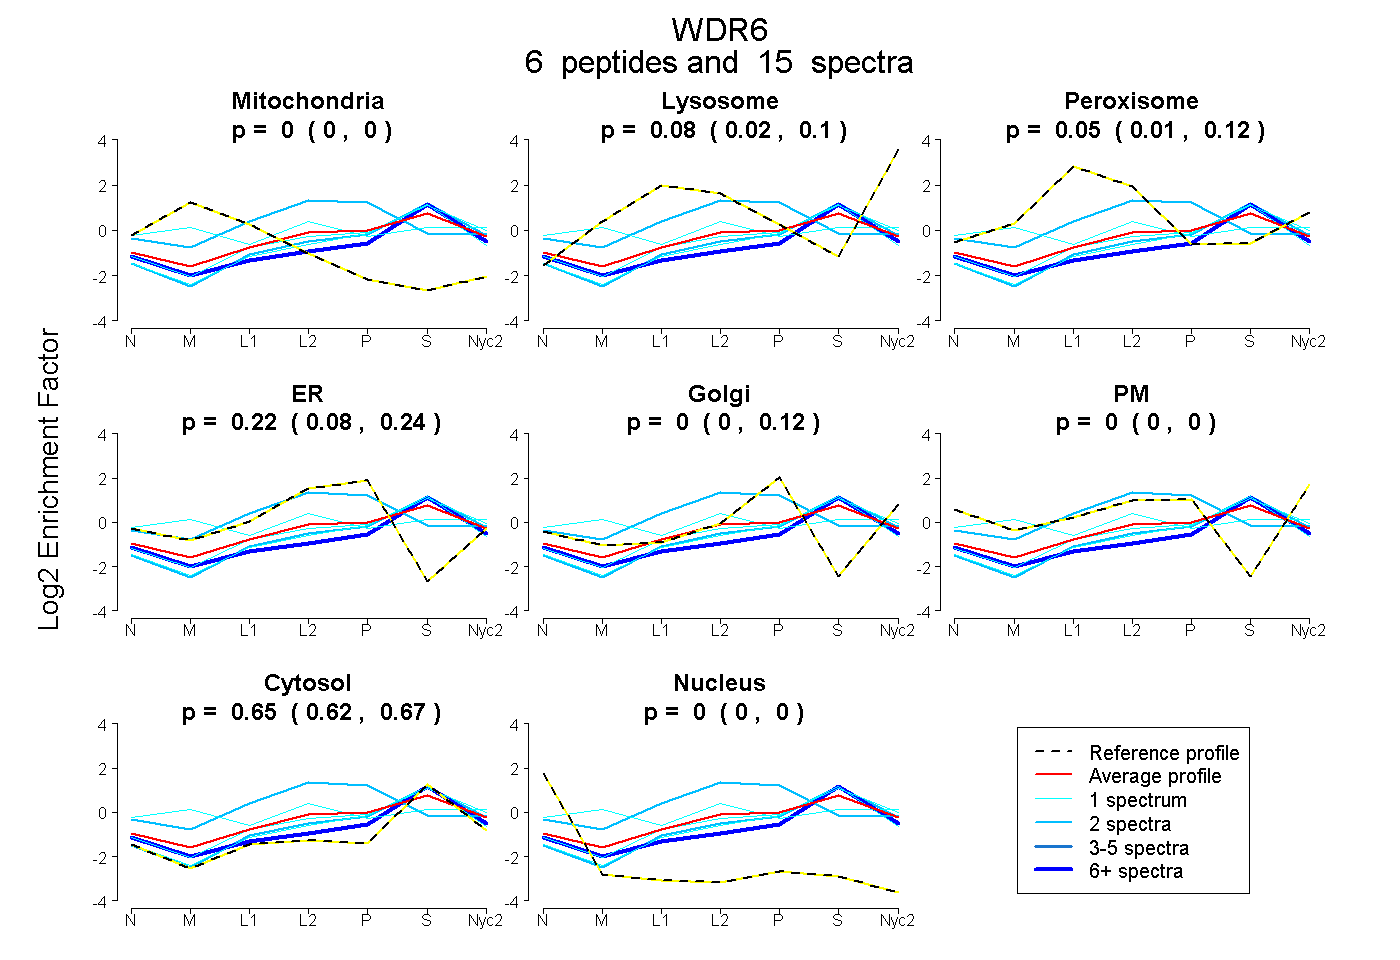
0.000 | 0.000
0.017 | 0.101
0.012 | 0.122
0.083 | 0.238
0.000 | 0.119
0.000 | 0.000
0.617 | 0.671
0.000 | 0.000
2peptides
spectra
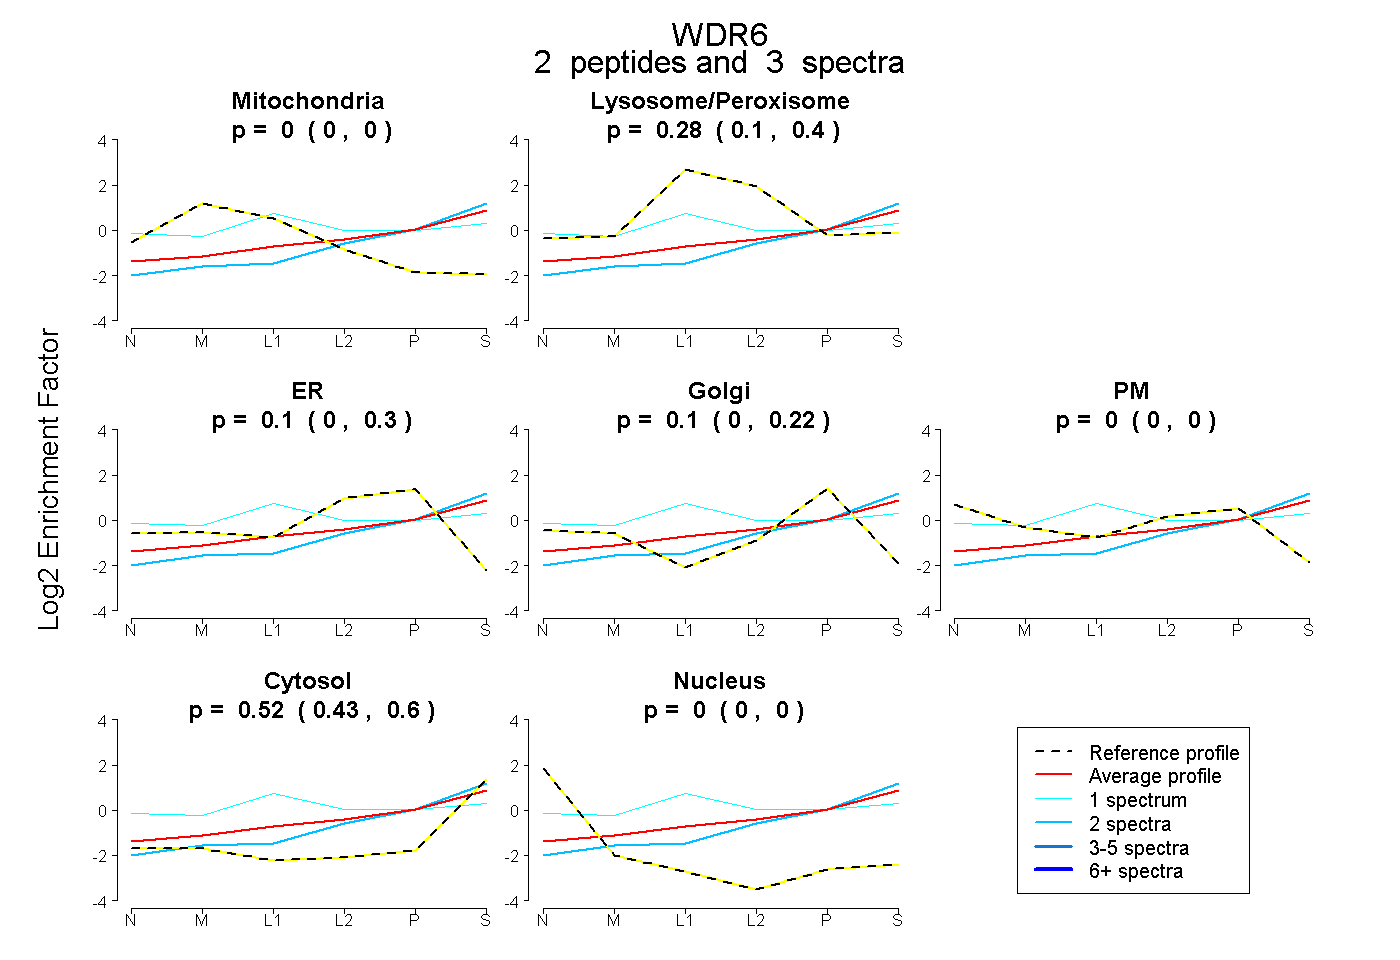
0.000 | 0.000
0.095 | 0.402
0.000 | 0.300
0.000 | 0.223
0.000 | 0.000
0.433 | 0.602
0.000 | 0.000
2peptides
spectra
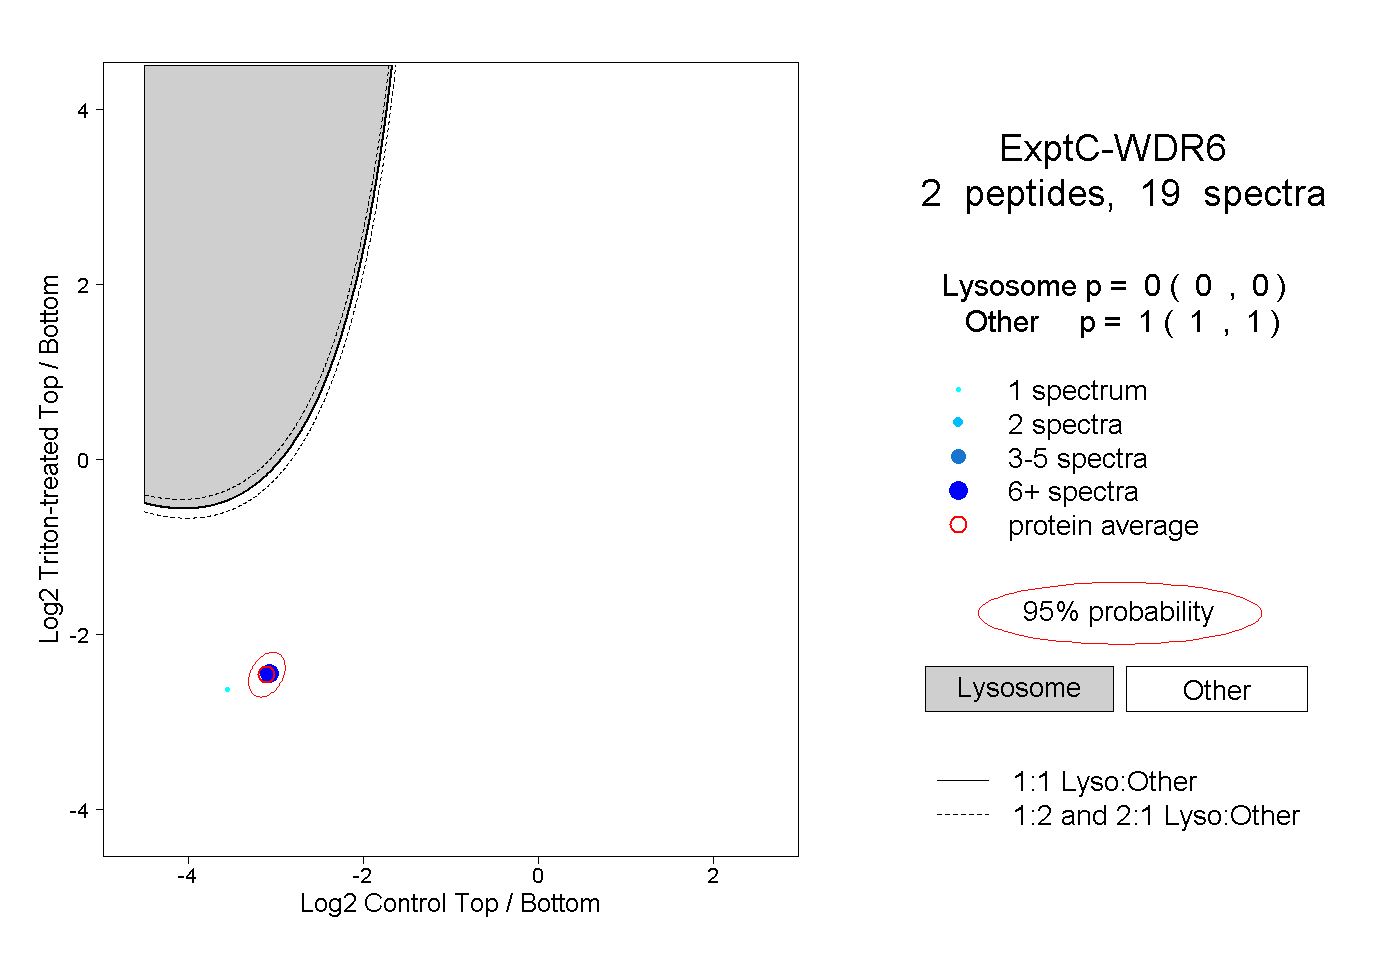
0.000 | 0.000
1.000 | 1.000
1peptide
spectrum
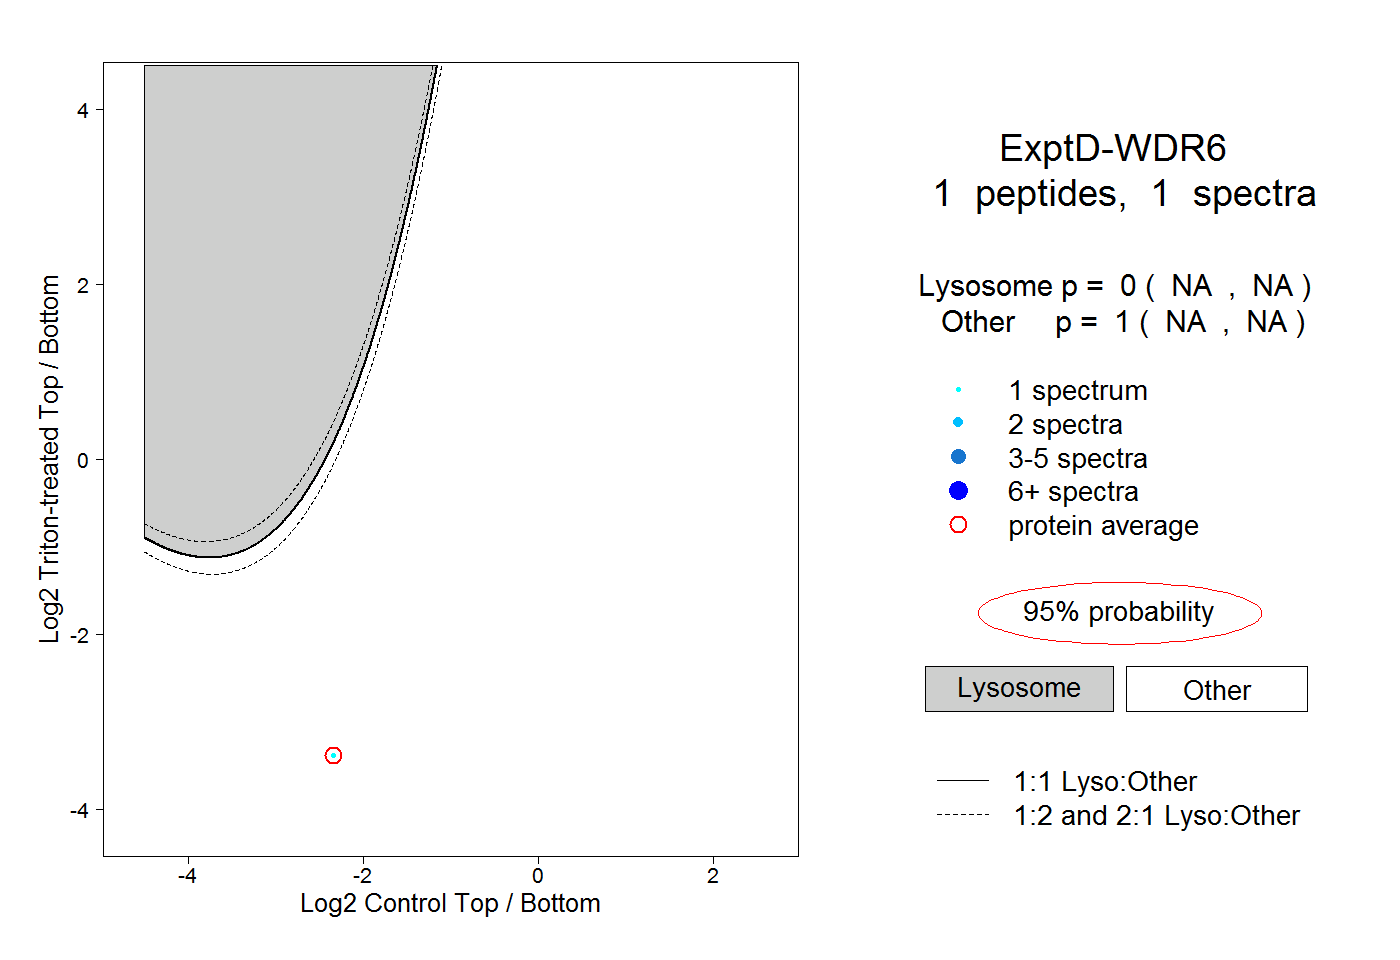
NA | NA
NA | NA