 6
6peptides
spectra
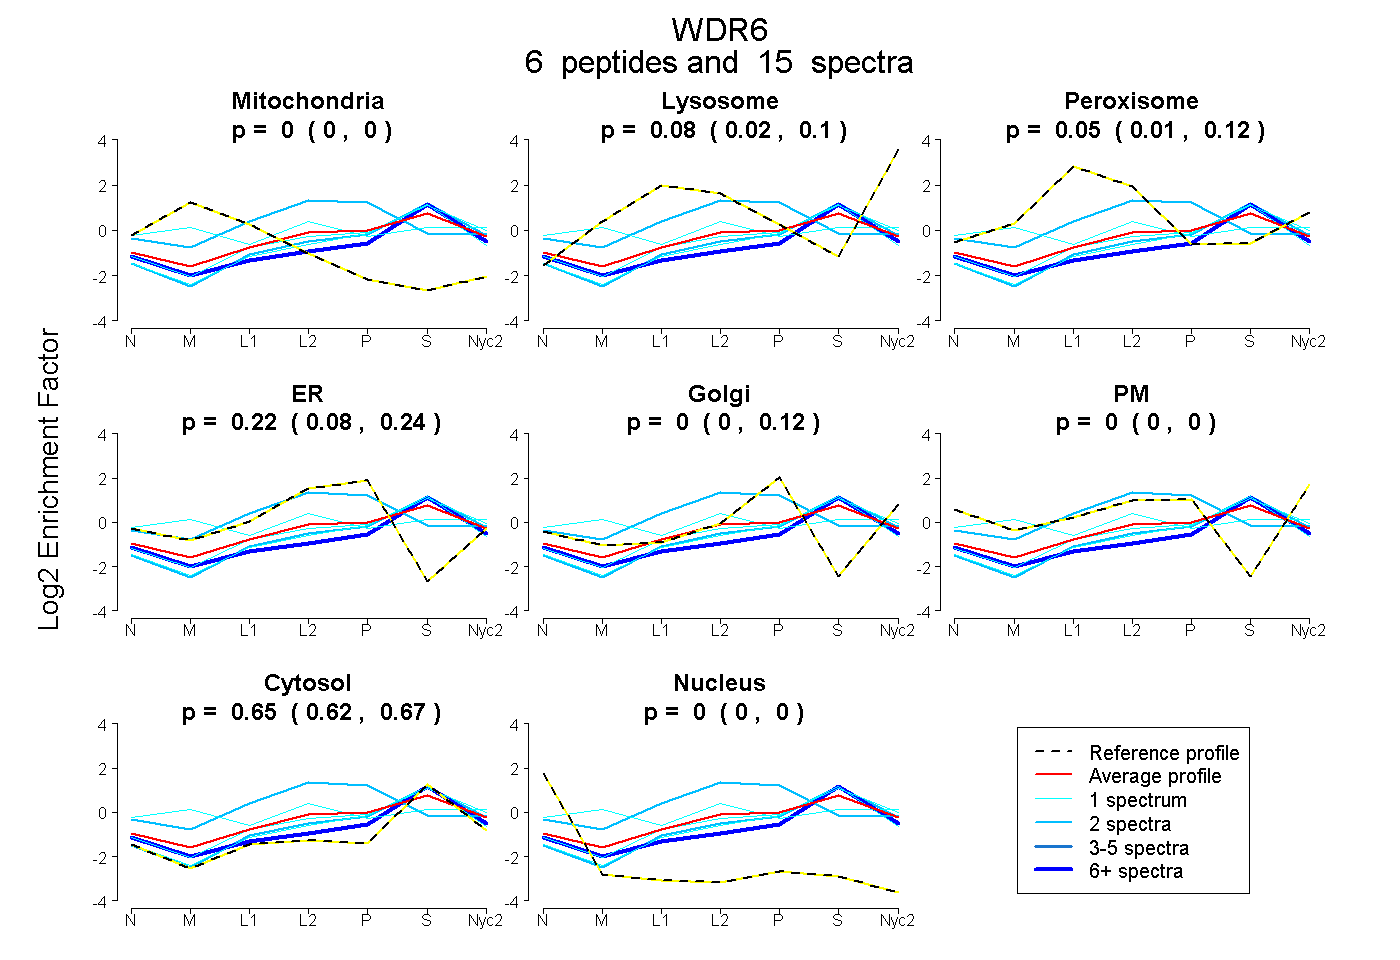
0.000 | 0.000
0.017 | 0.101
0.012 | 0.122
0.083 | 0.238
0.000 | 0.119
0.000 | 0.000
0.617 | 0.671
0.000 | 0.000
| Plot | Mito | Lyso | Perox | ER | Golgi | PM | Cytosol | Nucleus | |||||
| Expt A |
6 peptides |
15 spectra |
|
0.000 0.000 | 0.000 |
0.084 0.017 | 0.101 |
0.046 0.012 | 0.122 |
0.217 0.083 | 0.238 |
0.000 0.000 | 0.119 |
0.000 0.000 | 0.000 |
0.653 0.617 | 0.671 |
0.000 0.000 | 0.000 |
| 1 spectrum, LFLLQDSGR | 0.000 | 0.143 | 0.000 | 0.128 | 0.004 | 0.000 | 0.725 | 0.000 | ||
| 8 spectra, LDEYWDR | 0.000 | 0.014 | 0.026 | 0.000 | 0.130 | 0.000 | 0.830 | 0.000 | ||
| 2 spectra, GLLATASEDR | 0.000 | 0.077 | 0.000 | 0.071 | 0.051 | 0.000 | 0.801 | 0.000 | ||
| 2 spectra, LHIVNCGGGHR | 0.000 | 0.000 | 0.280 | 0.484 | 0.000 | 0.000 | 0.237 | 0.000 | ||
| 1 spectrum, VHSLSWALR | 0.096 | 0.005 | 0.192 | 0.000 | 0.000 | 0.316 | 0.391 | 0.000 | ||
| 1 spectrum, LWHLVGR | 0.000 | 0.010 | 0.000 | 0.155 | 0.015 | 0.000 | 0.820 | 0.000 |
| Plot | Mito | Lyso or Perox | ER | Golgi | PM | Cytosol | Nucleus | ||||||
| Expt B |
2 peptides |
3 spectra |
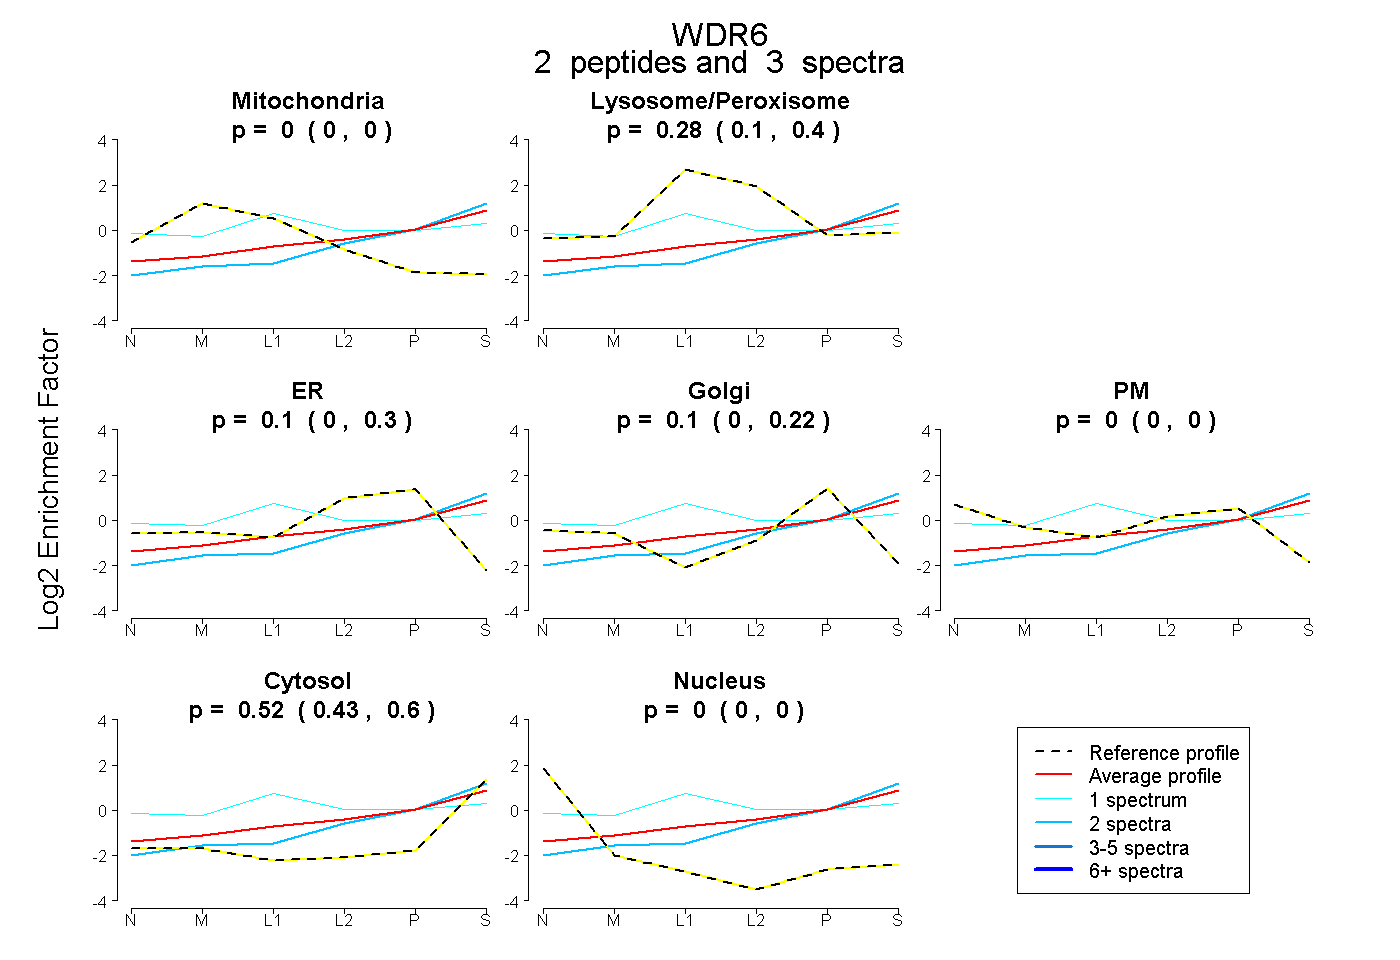 |
0.000 0.000 | 0.000 |
0.279 0.095 | 0.402 |
0.105 0.000 | 0.300 |
0.096 0.000 | 0.223 |
0.000 0.000 | 0.000 |
0.520 0.433 | 0.602 |
0.000 0.000 | 0.000 |
|||
| Plot | Lyso | Other | |||||||||||
| Expt C |
2 peptides |
19 spectra |
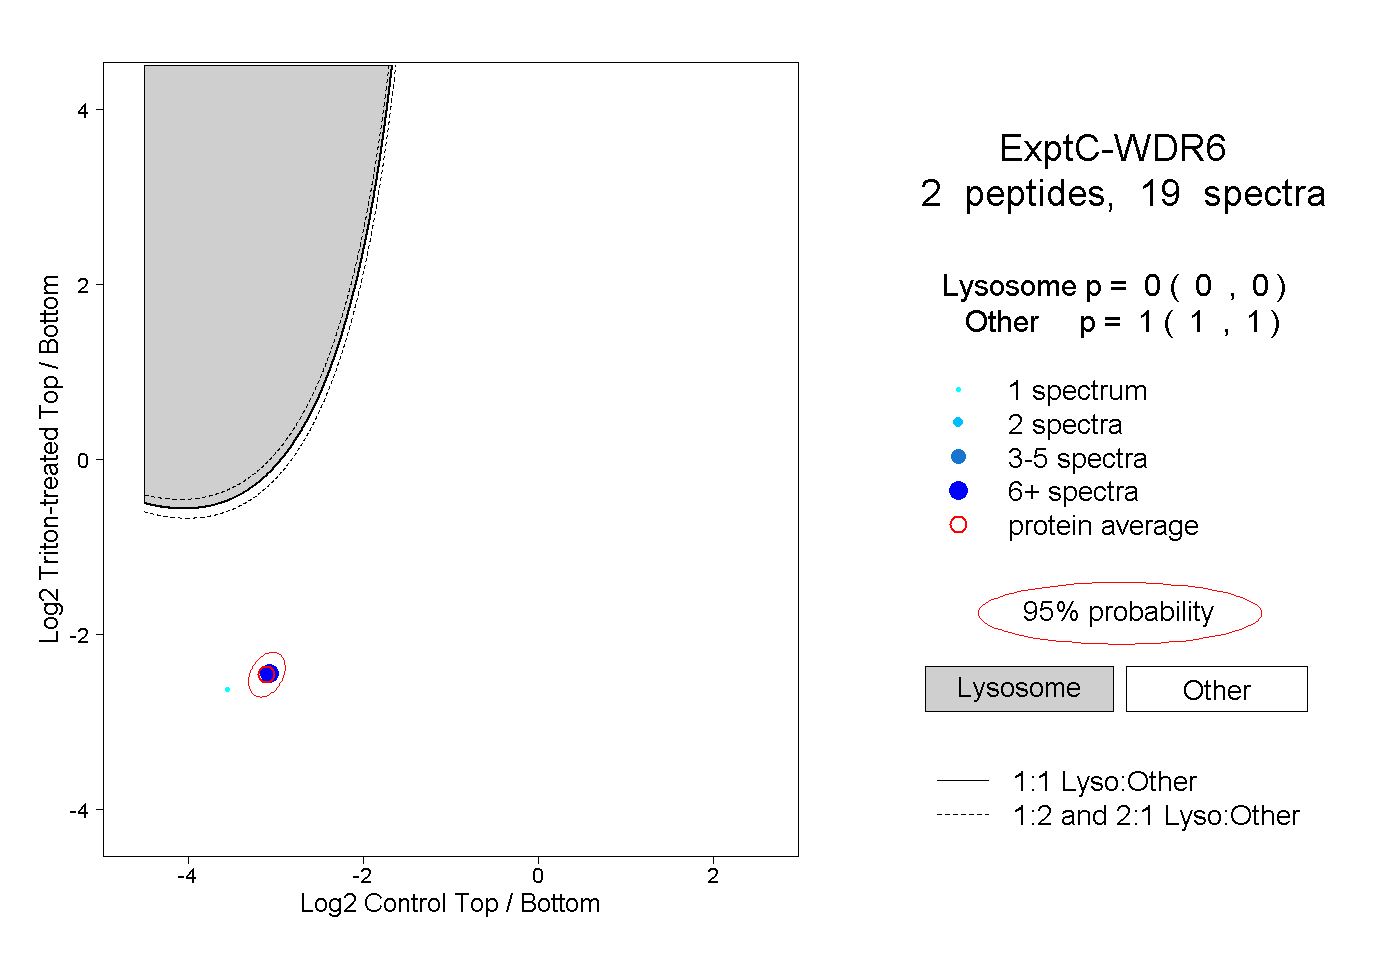 |
0.000 0.000 | 0.000 |
1.000 1.000 | 1.000 |
||||||||
| Plot | Lyso | Other | |||||||||||
| Expt D |
1 peptide |
1 spectrum |
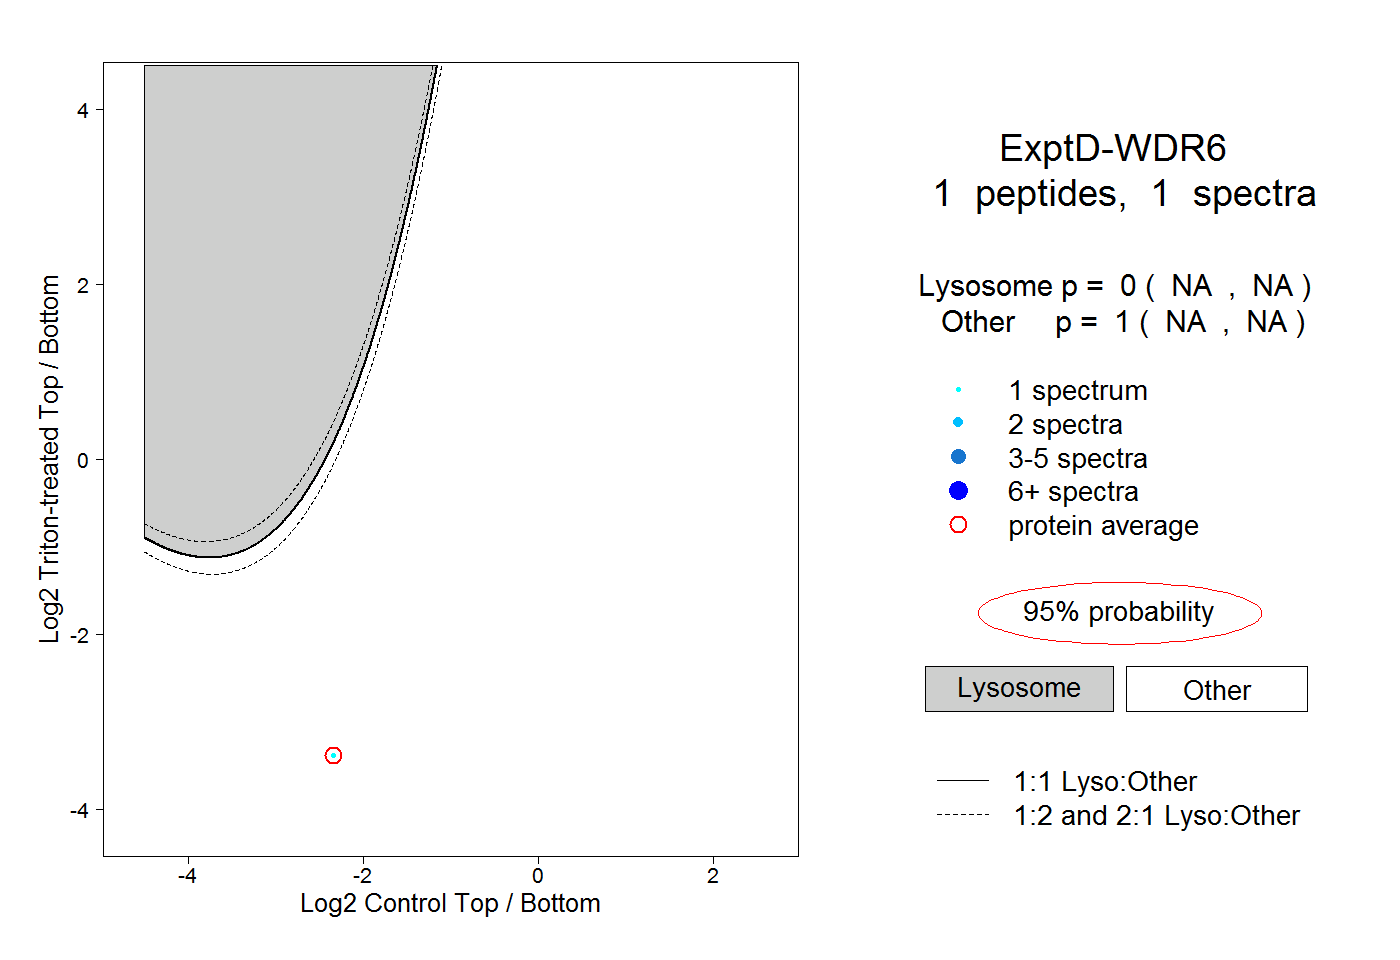 |
0.000 NA | NA |
1.000 NA | NA |