 37
37peptides
spectra
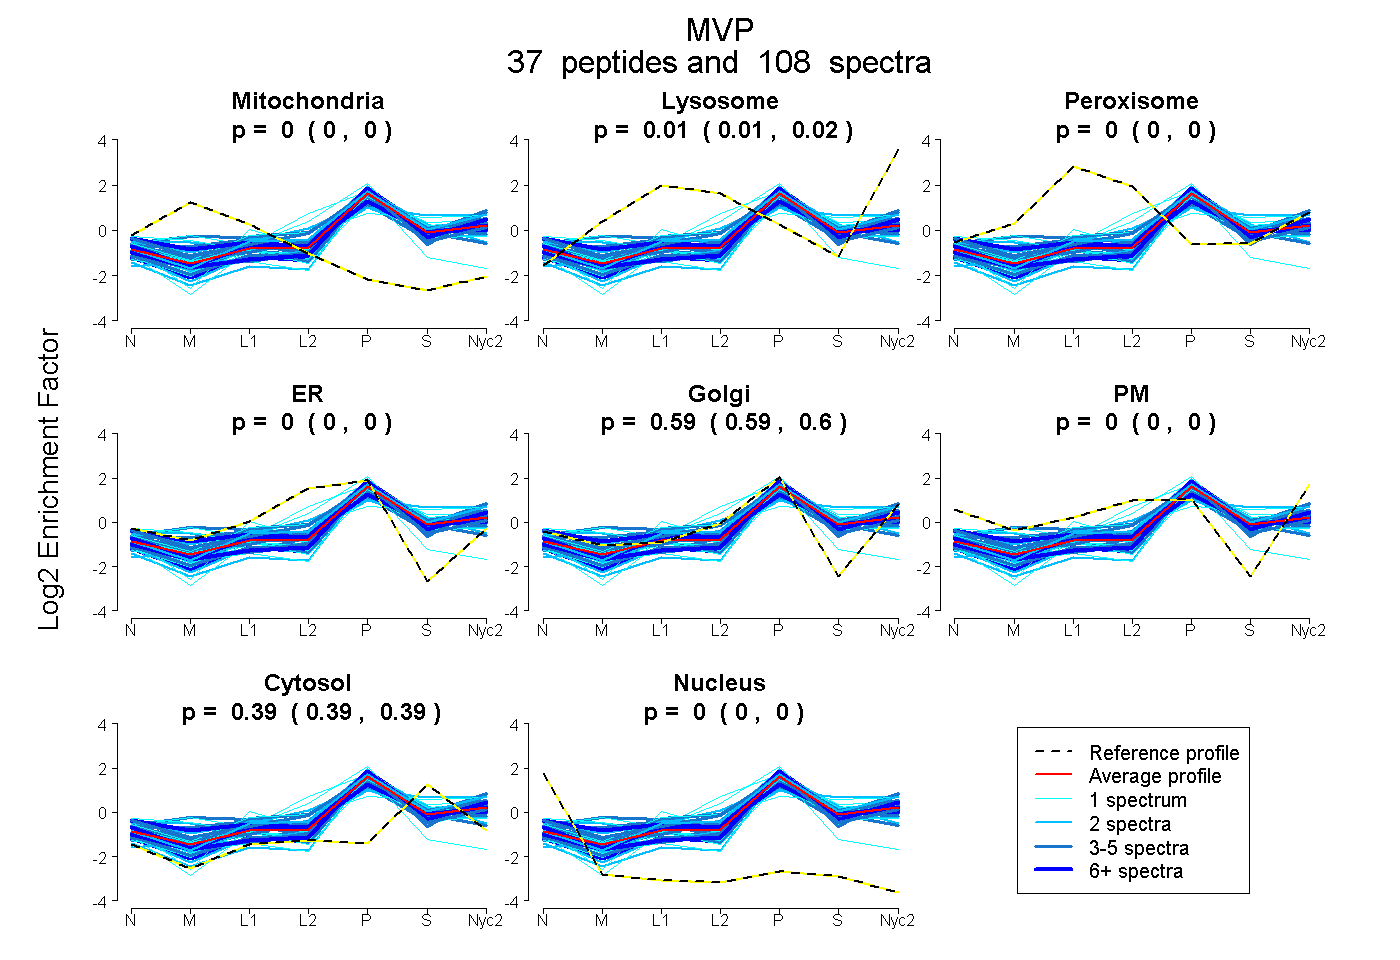
0.000 | 0.000
0.012 | 0.016
0.000 | 0.000
0.000 | 0.000
0.591 | 0.596
0.000 | 0.000
0.390 | 0.394
0.000 | 0.000
24peptides
spectra
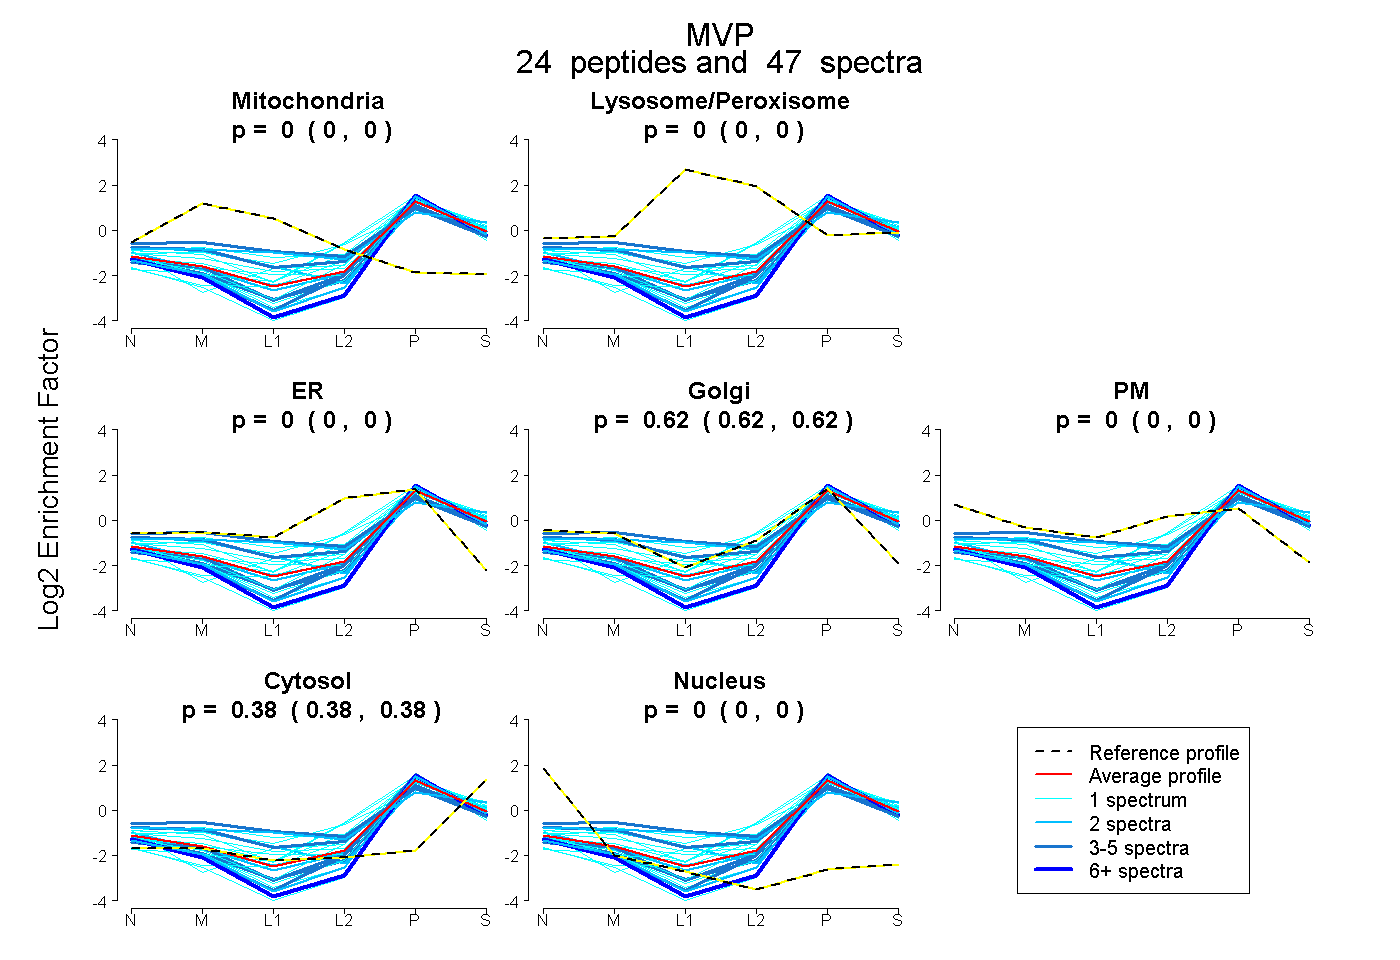
0.000 | 0.000
0.000 | 0.000
0.000 | 0.000
0.617 | 0.624
0.000 | 0.000
0.376 | 0.383
0.000 | 0.000
29peptides
spectra
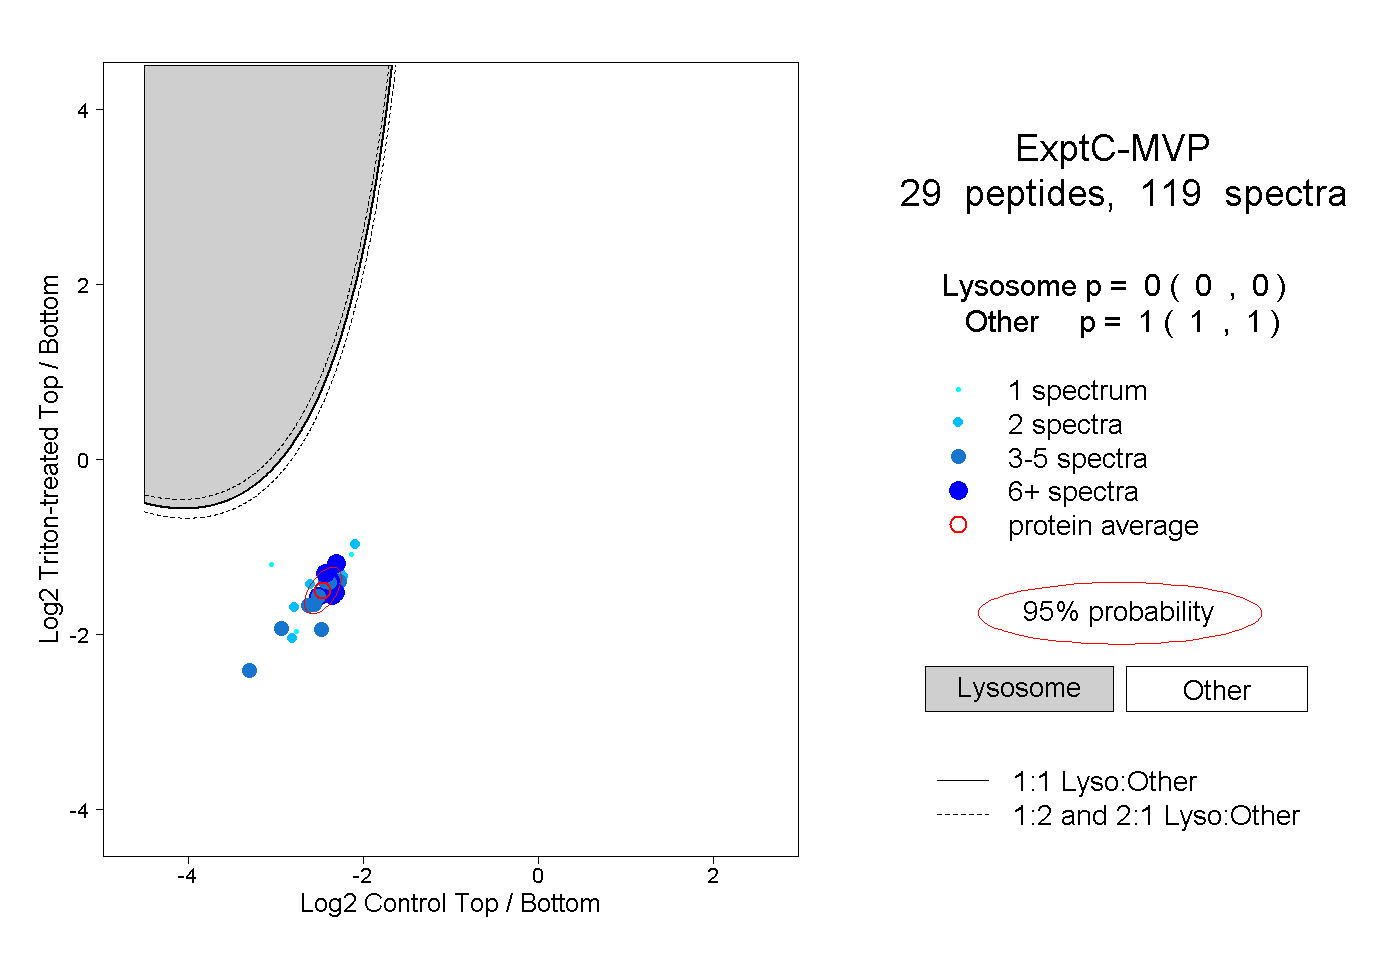
0.000 | 0.000
1.000 | 1.000
9peptides
spectra
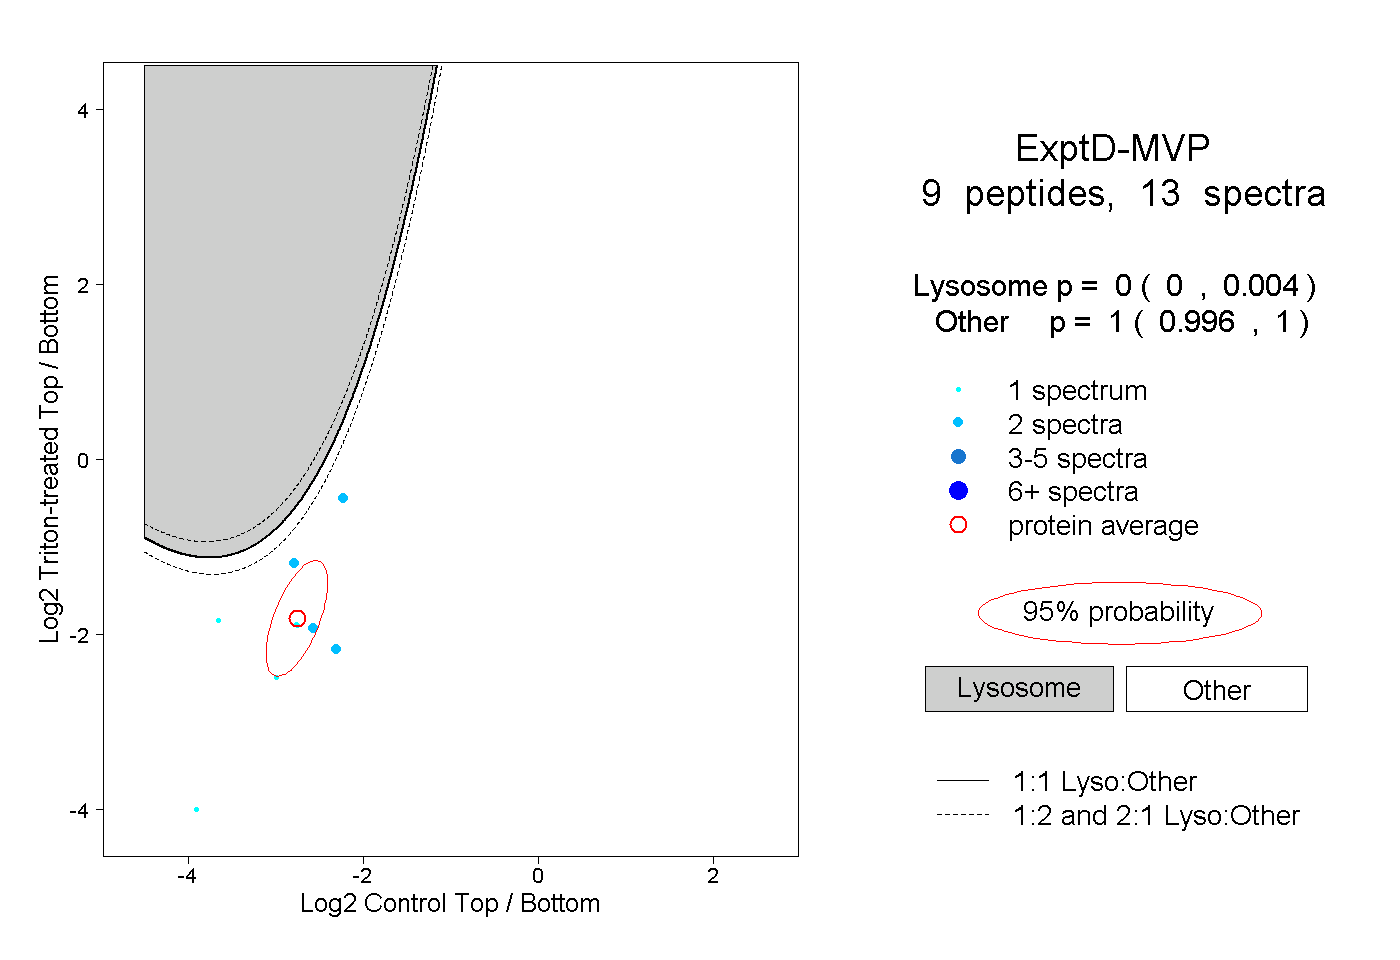
0.000 | 0.004
0.996 | 1.000