 37
37peptides
spectra
0.000 | 0.000
0.012 | 0.016
0.000 | 0.000
0.000 | 0.000
0.591 | 0.596
0.000 | 0.000
0.390 | 0.394
0.000 | 0.000
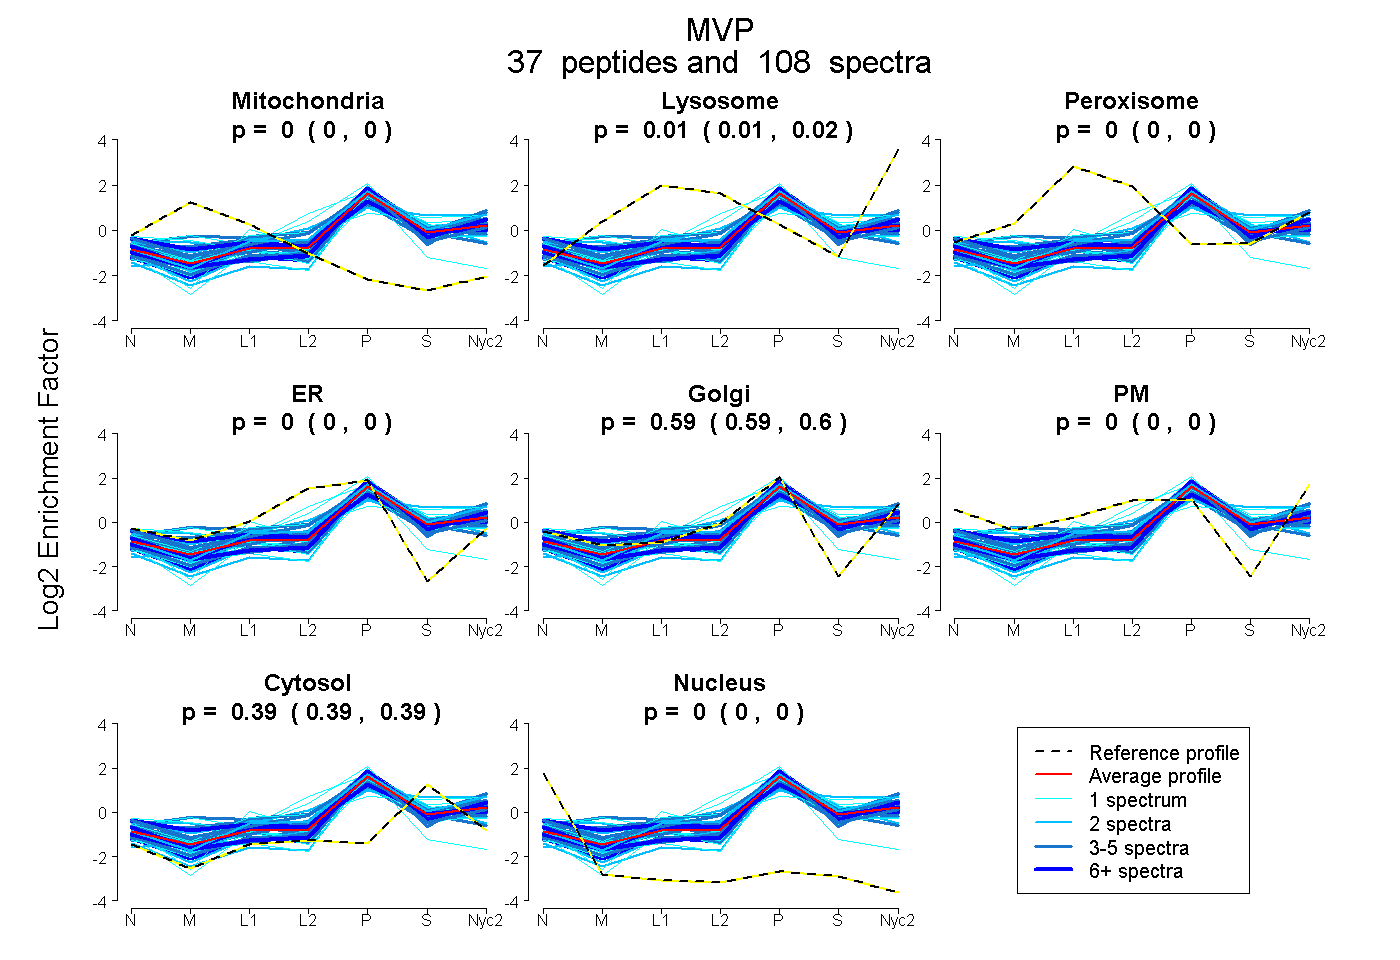
| Plot | Mito | Lyso | Perox | ER | Golgi | PM | Cytosol | Nucleus | |||||
| Expt A |
37 peptides |
108 spectra |
|
0.000 0.000 | 0.000 |
0.014 0.012 | 0.016 |
0.000 0.000 | 0.000 |
0.000 0.000 | 0.000 |
0.594 0.591 | 0.596 |
0.000 0.000 | 0.000 |
0.392 0.390 | 0.394 |
0.000 0.000 | 0.000 |
| 6 spectra, VPHNAAVQVYDYR | 0.000 | 0.000 | 0.110 | 0.000 | 0.533 | 0.000 | 0.357 | 0.000 | ||
| 3 spectra, ILDQSEAEK | 0.000 | 0.031 | 0.118 | 0.000 | 0.553 | 0.000 | 0.298 | 0.000 | ||
| 7 spectra, ALLDFEDK | 0.000 | 0.000 | 0.000 | 0.000 | 0.555 | 0.000 | 0.445 | 0.000 | ||
| 3 spectra, VSHQAGDCWLIR | 0.000 | 0.000 | 0.063 | 0.092 | 0.567 | 0.000 | 0.277 | 0.000 | ||
| 2 spectra, HYCVILDPMGPDGK | 0.000 | 0.000 | 0.133 | 0.148 | 0.366 | 0.000 | 0.353 | 0.000 | ||
| 1 spectrum, GTAKPLQPSAPR | 0.000 | 0.025 | 0.000 | 0.292 | 0.403 | 0.000 | 0.280 | 0.000 | ||
| 3 spectra, LFSVPDFVGDACK | 0.000 | 0.000 | 0.000 | 0.000 | 0.565 | 0.000 | 0.435 | 0.000 | ||
| 2 spectra, IPPYHYIHVLDQNSNVSR | 0.000 | 0.238 | 0.000 | 0.000 | 0.257 | 0.000 | 0.506 | 0.000 | ||
| 4 spectra, ALQPLEEGESEEK | 0.000 | 0.000 | 0.023 | 0.000 | 0.528 | 0.000 | 0.449 | 0.000 | ||
| 2 spectra, AQQLANVEAK | 0.000 | 0.000 | 0.000 | 0.000 | 0.440 | 0.000 | 0.560 | 0.000 | ||
| 2 spectra, IEGEGSVLQAK | 0.000 | 0.000 | 0.000 | 0.102 | 0.539 | 0.000 | 0.359 | 0.000 | ||
| 2 spectra, DTQSSVLFDITGQVR | 0.000 | 0.000 | 0.000 | 0.000 | 0.516 | 0.000 | 0.484 | 0.000 | ||
| 2 spectra, HADQEIR | 0.000 | 0.000 | 0.000 | 0.000 | 0.583 | 0.000 | 0.417 | 0.000 | ||
| 1 spectrum, HYCIVANPVSR | 0.091 | 0.000 | 0.000 | 0.708 | 0.000 | 0.000 | 0.201 | 0.000 | ||
| 1 spectrum, NDPAEAAK | 0.104 | 0.000 | 0.000 | 0.000 | 0.557 | 0.000 | 0.338 | 0.000 | ||
| 1 spectrum, LAQDPFPLYPGEVLEK | 0.000 | 0.000 | 0.000 | 0.000 | 0.577 | 0.000 | 0.423 | 0.000 | ||
| 1 spectrum, SVQLAIEITTNSQEAAAK | 0.000 | 0.167 | 0.094 | 0.000 | 0.289 | 0.000 | 0.450 | 0.000 | ||
| 4 spectra, EMELIYAR | 0.000 | 0.062 | 0.000 | 0.000 | 0.548 | 0.000 | 0.390 | 0.000 | ||
| 3 spectra, ELPSGVEELLNLGHDPLADR | 0.000 | 0.000 | 0.000 | 0.000 | 0.554 | 0.000 | 0.446 | 0.000 | ||
| 1 spectrum, GAVASVTFDDFHK | 0.000 | 0.000 | 0.000 | 0.000 | 0.540 | 0.000 | 0.460 | 0.000 | ||
| 5 spectra, MVTVPPR | 0.000 | 0.189 | 0.005 | 0.000 | 0.498 | 0.000 | 0.309 | 0.000 | ||
| 3 spectra, EMTEALGPGTIR | 0.000 | 0.000 | 0.000 | 0.000 | 0.595 | 0.000 | 0.405 | 0.000 | ||
| 10 spectra, VLFAPVR | 0.000 | 0.000 | 0.000 | 0.000 | 0.591 | 0.000 | 0.409 | 0.000 | ||
| 1 spectrum, EVEVVEIIQATVIK | 0.000 | 0.000 | 0.000 | 0.000 | 0.547 | 0.000 | 0.453 | 0.000 | ||
| 1 spectrum, QAIPLDQNEGIYVQDVK | 0.000 | 0.000 | 0.023 | 0.000 | 0.549 | 0.000 | 0.428 | 0.000 | ||
| 4 spectra, QNQALR | 0.000 | 0.025 | 0.000 | 0.000 | 0.634 | 0.000 | 0.341 | 0.000 | ||
| 5 spectra, SFFLQPGER | 0.000 | 0.000 | 0.000 | 0.000 | 0.575 | 0.000 | 0.425 | 0.000 | ||
| 4 spectra, TALHLR | 0.000 | 0.000 | 0.000 | 0.000 | 0.587 | 0.000 | 0.413 | 0.000 | ||
| 1 spectrum, GIQDVYVLSEQQGLLLK | 0.000 | 0.000 | 0.000 | 0.000 | 0.534 | 0.000 | 0.466 | 0.000 | ||
| 2 spectra, NQLGQK | 0.000 | 0.000 | 0.000 | 0.000 | 0.664 | 0.000 | 0.336 | 0.000 | ||
| 6 spectra, VEVVEER | 0.000 | 0.024 | 0.000 | 0.000 | 0.649 | 0.000 | 0.327 | 0.000 | ||
| 1 spectrum, ELLELEAMSMAVESTGNAK | 0.000 | 0.080 | 0.011 | 0.000 | 0.445 | 0.000 | 0.464 | 0.000 | ||
| 2 spectra, VTGEEWLVR | 0.000 | 0.110 | 0.000 | 0.000 | 0.534 | 0.000 | 0.357 | 0.000 | ||
| 5 spectra, ALQNFR | 0.026 | 0.088 | 0.117 | 0.000 | 0.510 | 0.000 | 0.259 | 0.000 | ||
| 2 spectra, AQLELEVSK | 0.000 | 0.000 | 0.125 | 0.000 | 0.501 | 0.000 | 0.373 | 0.000 | ||
| 4 spectra, LLQSLGLK | 0.000 | 0.076 | 0.000 | 0.000 | 0.678 | 0.000 | 0.246 | 0.000 | ||
| 1 spectrum, VEVGPK | 0.000 | 0.038 | 0.000 | 0.000 | 0.606 | 0.000 | 0.357 | 0.000 |
| Plot | Mito | Lyso or Perox | ER | Golgi | PM | Cytosol | Nucleus | ||||||
| Expt B |
24 peptides |
47 spectra |
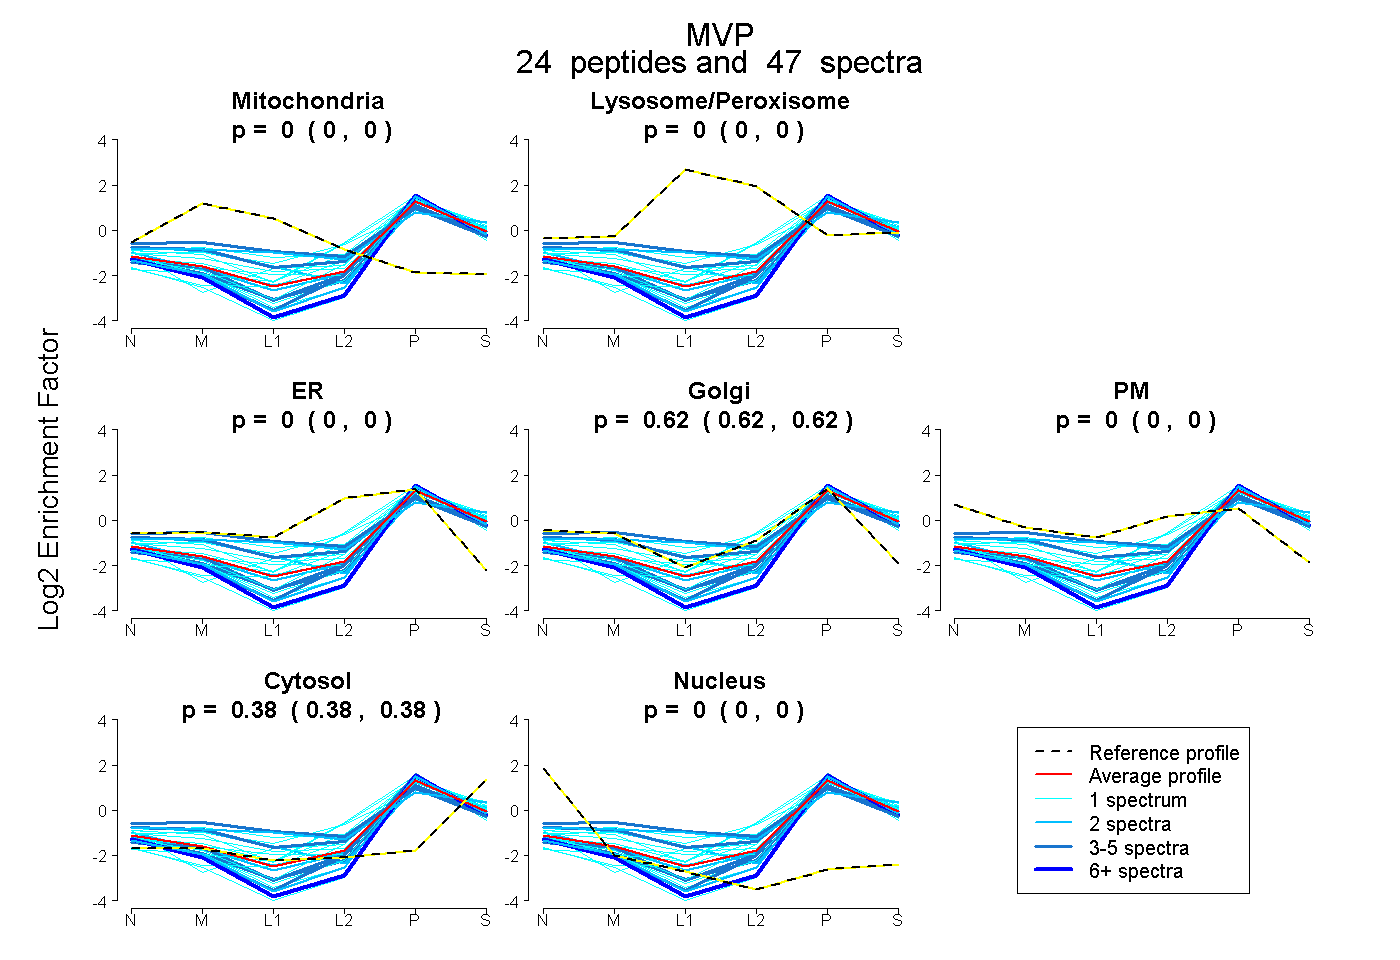 |
0.000 0.000 | 0.000 |
0.000 0.000 | 0.000 |
0.000 0.000 | 0.000 |
0.620 0.617 | 0.624 |
0.000 0.000 | 0.000 |
0.380 0.376 | 0.383 |
0.000 0.000 | 0.000 |
|||
| Plot | Lyso | Other | |||||||||||
| Expt C |
29 peptides |
119 spectra |
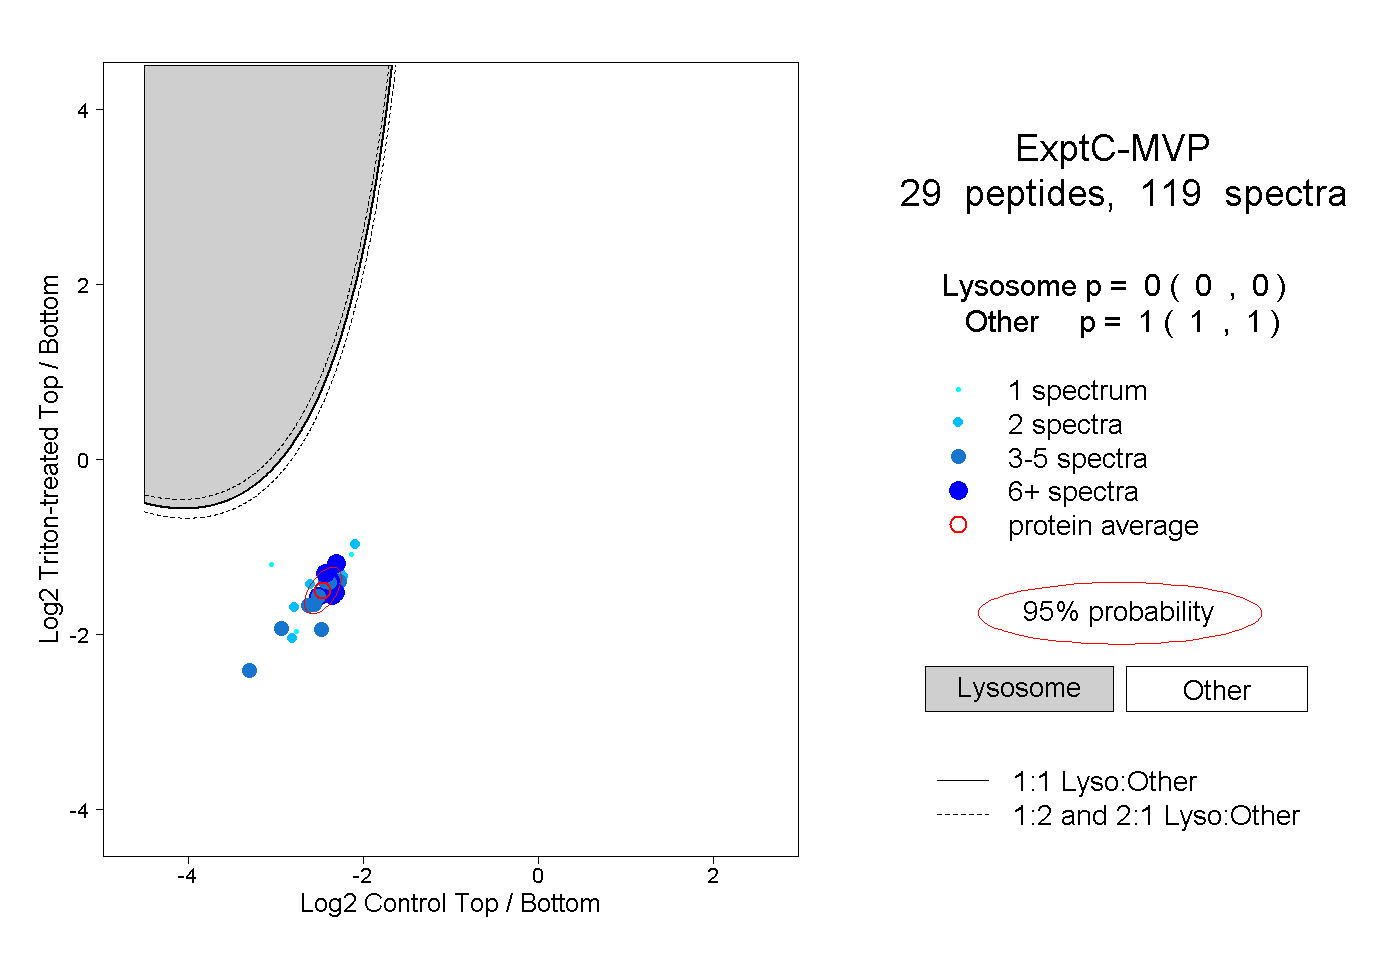 |
0.000 0.000 | 0.000 |
1.000 1.000 | 1.000 |
||||||||
| Plot | Lyso | Other | |||||||||||
| Expt D |
9 peptides |
13 spectra |
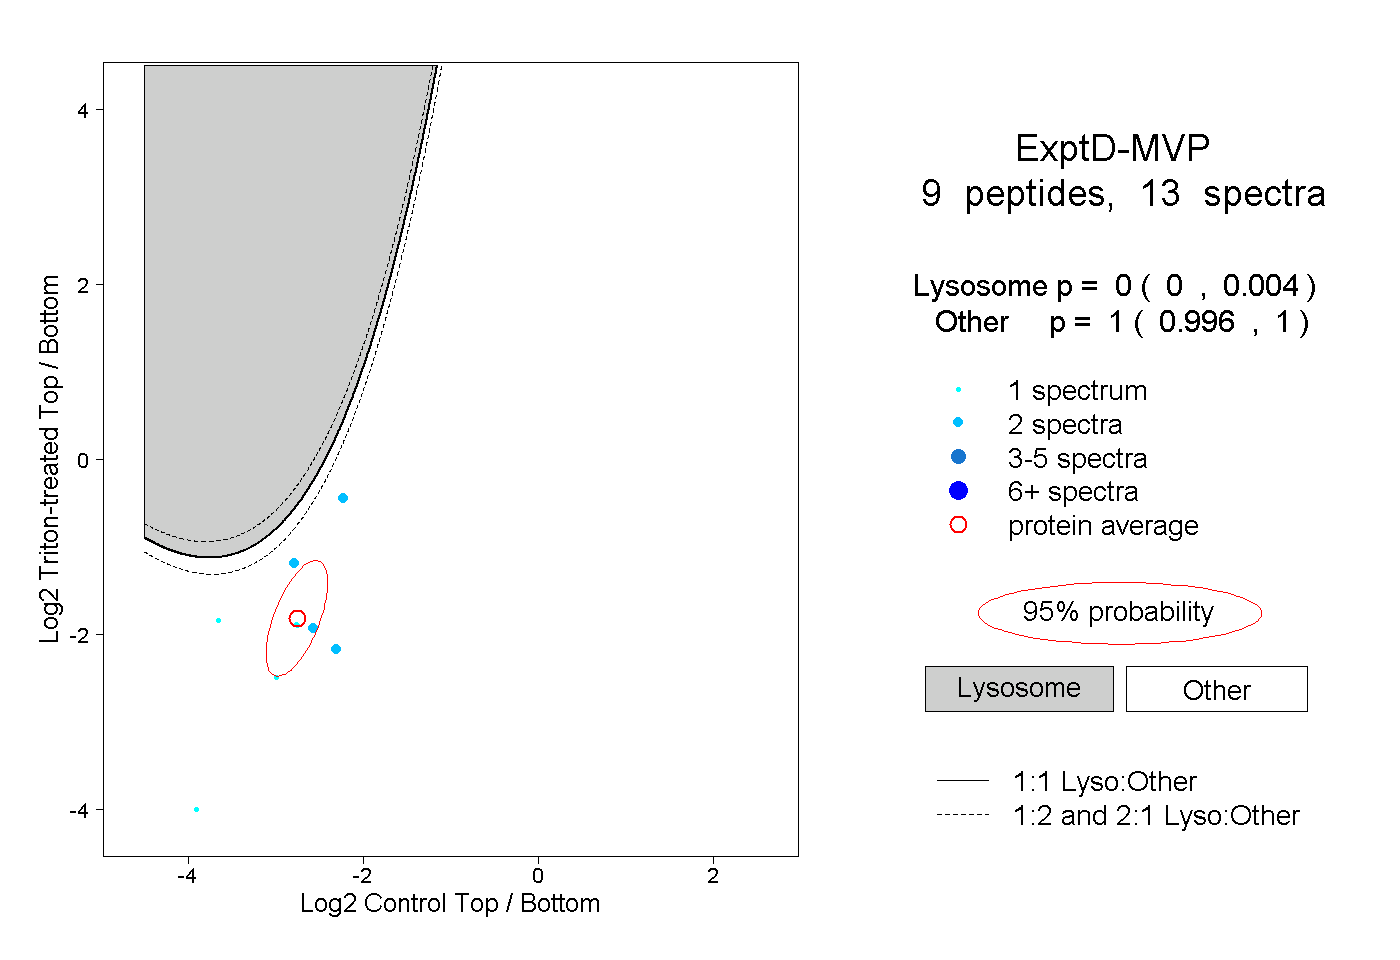 |
0.000 0.000 | 0.004 |
1.000 0.996 | 1.000 |