 3
3peptides
spectra
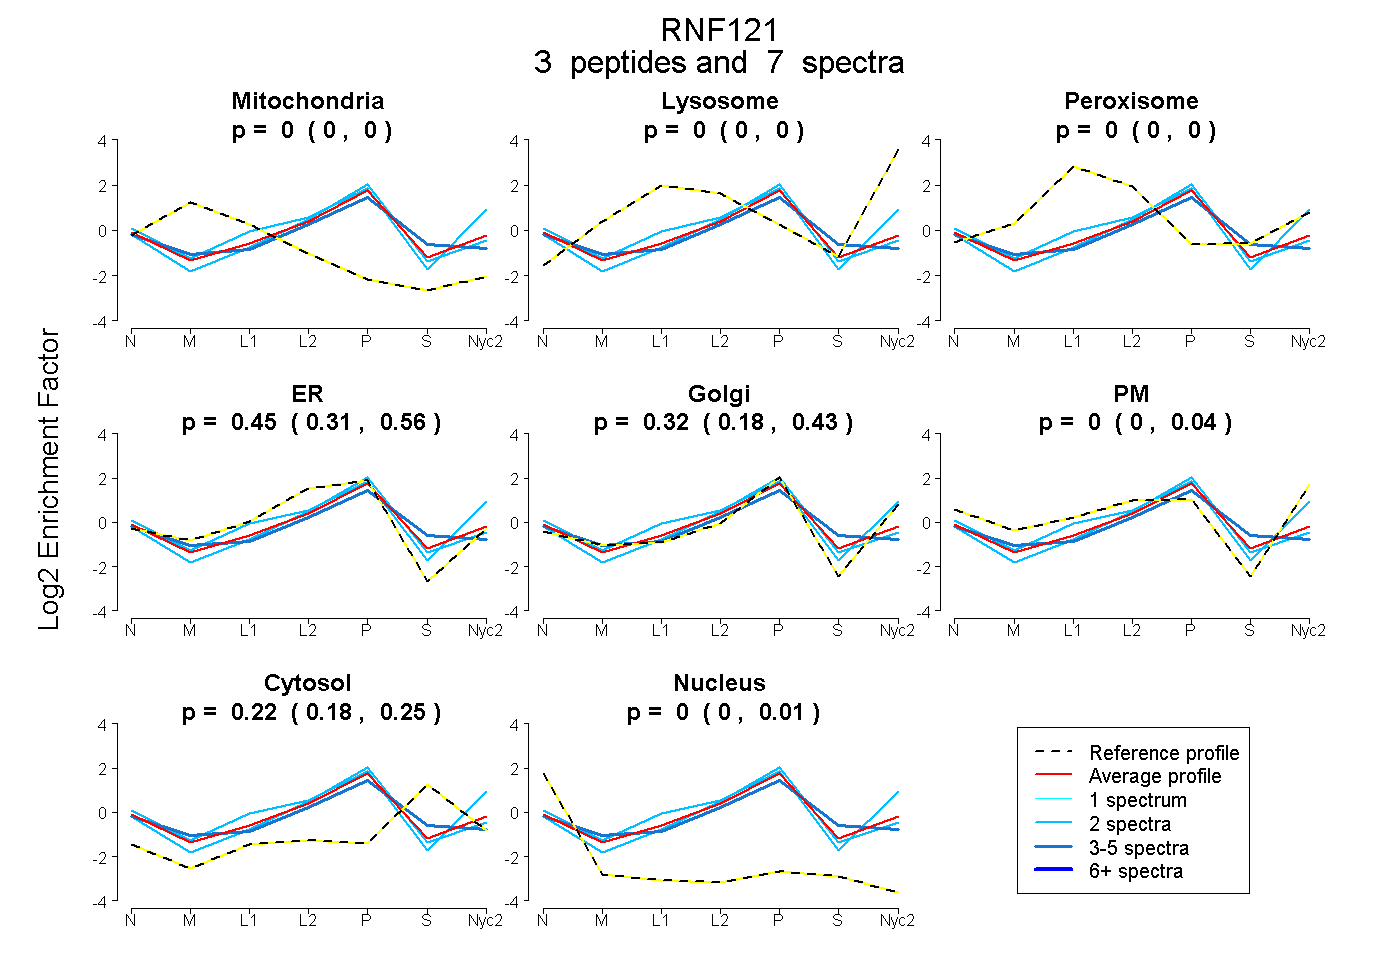
0.000 | 0.000
0.000 | 0.000
0.000 | 0.003
0.307 | 0.559
0.180 | 0.428
0.000 | 0.043
0.179 | 0.254
0.000 | 0.014
1peptide
spectrum
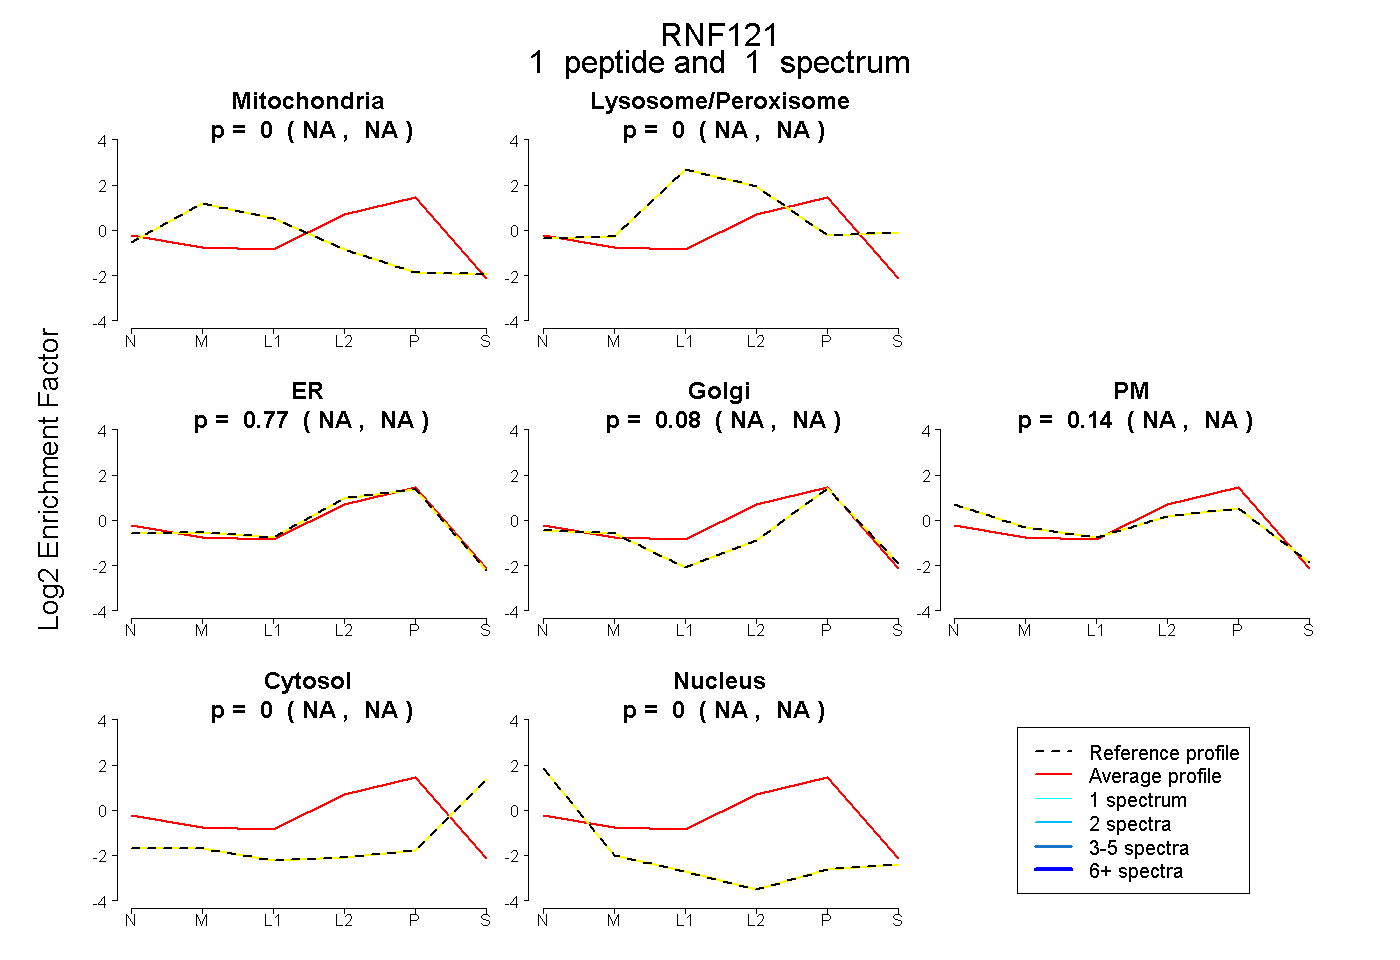
NA | NA
NA | NA
NA | NA
NA | NA
NA | NA
NA | NA
NA | NA
2peptides
spectra
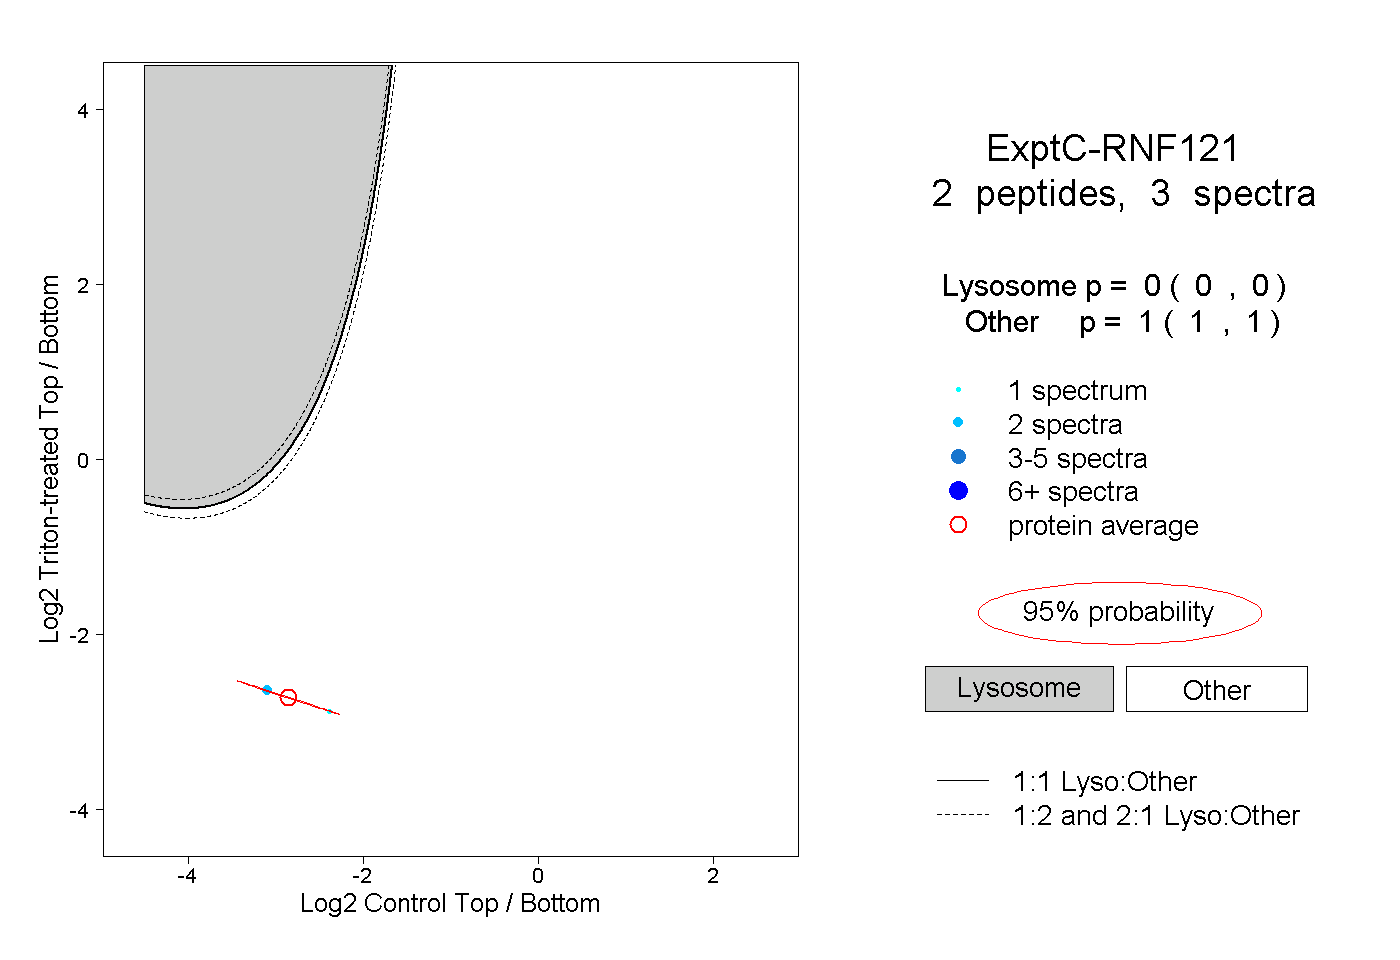
0.000 | 0.000
1.000 | 1.000