 3
3peptides
spectra
0.000 | 0.000
0.000 | 0.000
0.000 | 0.003
0.307 | 0.559
0.180 | 0.428
0.000 | 0.043
0.179 | 0.254
0.000 | 0.014
| Plot | Mito | Lyso | Perox | ER | Golgi | PM | Cytosol | Nucleus | |||||
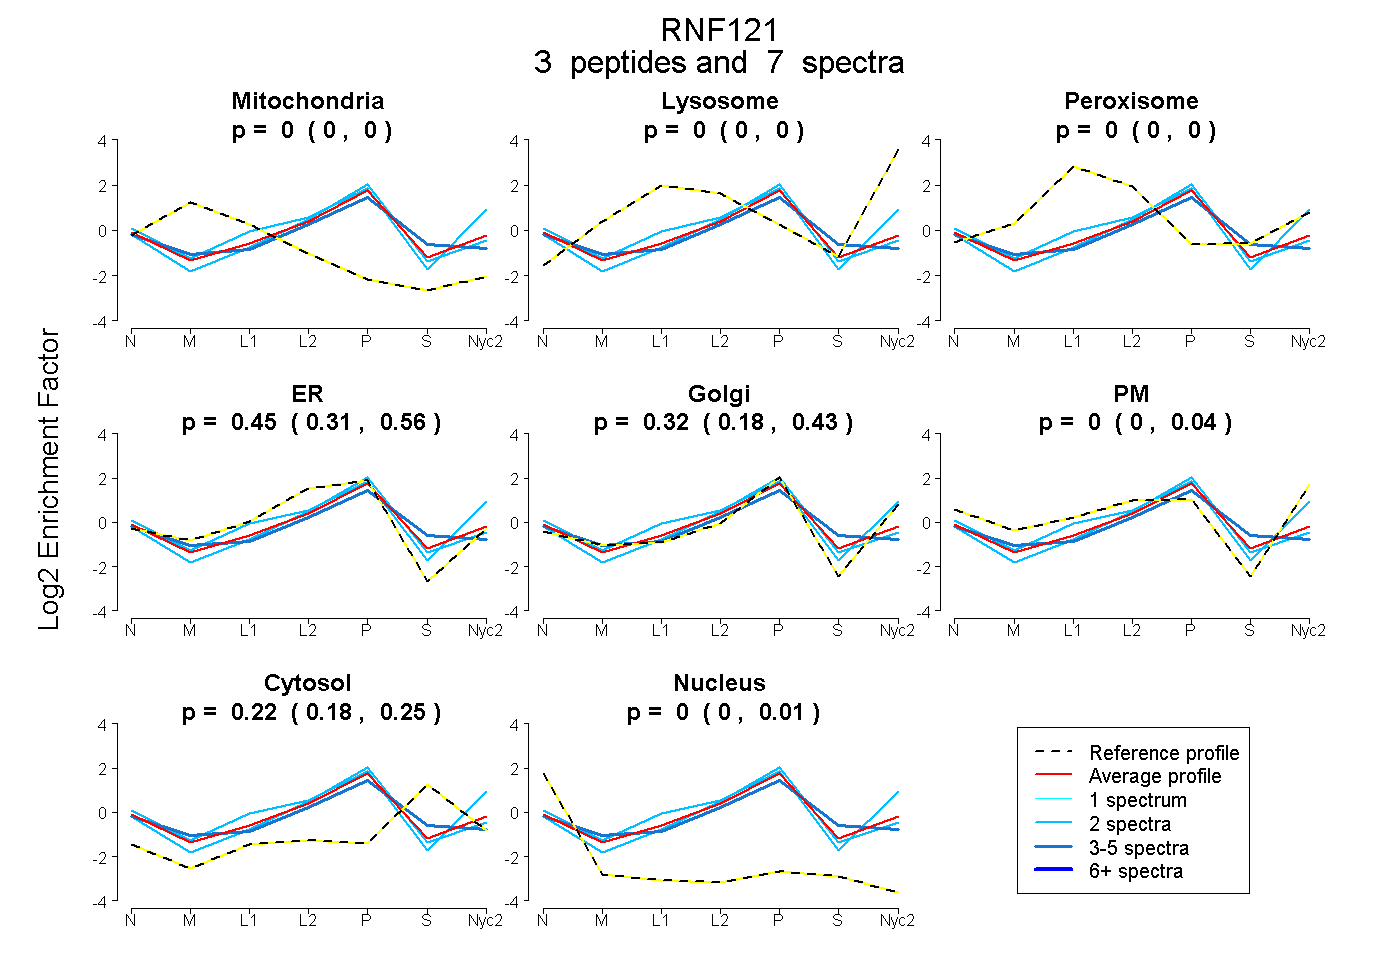
| Expt A |
3 peptides |
7 spectra |
|
0.000 0.000 | 0.000 |
0.000 0.000 | 0.000 |
0.000 0.000 | 0.003 |
0.455 0.307 | 0.559 |
0.323 0.180 | 0.428 |
0.000 0.000 | 0.043 |
0.222 0.179 | 0.254 |
0.000 0.000 | 0.014 |
| 2 spectra, GWCIVGK | 0.000 | 0.000 | 0.076 | 0.117 | 0.524 | 0.235 | 0.048 | 0.000 | ||
| 2 spectra, KPLVQTTPR | 0.000 | 0.000 | 0.000 | 0.482 | 0.307 | 0.000 | 0.207 | 0.003 | ||
| 3 spectra, QTCPYCK | 0.000 | 0.000 | 0.000 | 0.516 | 0.135 | 0.000 | 0.349 | 0.000 |
| Plot | Mito | Lyso or Perox | ER | Golgi | PM | Cytosol | Nucleus | ||||||
| Expt B |
1 peptide |
1 spectrum |
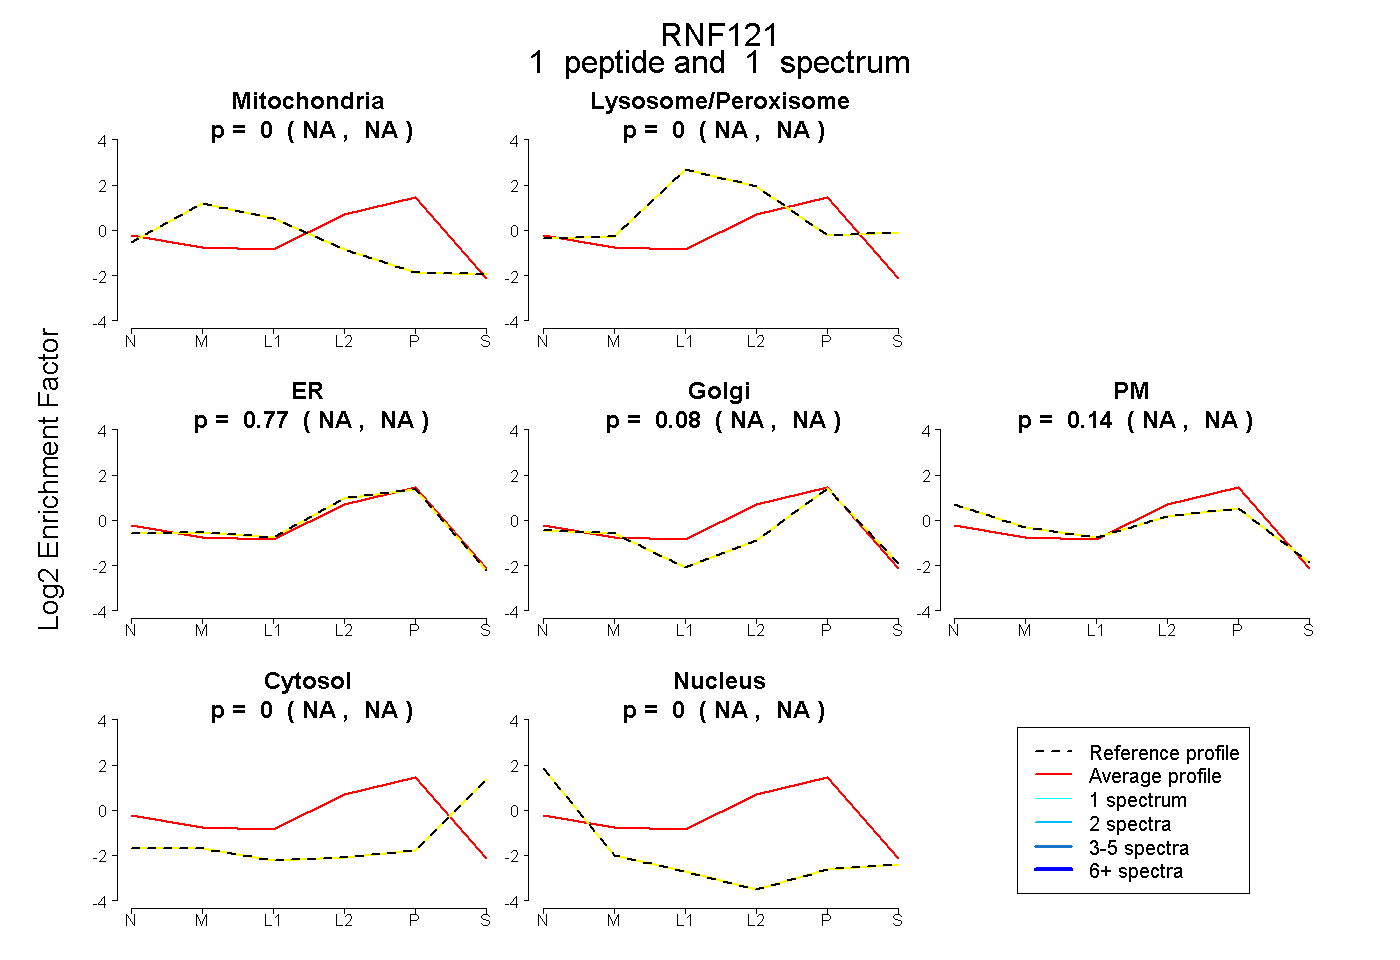 |
0.000 NA | NA |
0.000 NA | NA |
0.773 NA | NA |
0.085 NA | NA |
0.142 NA | NA |
0.000 NA | NA |
0.000 NA | NA |
|||
| Plot | Lyso | Other | |||||||||||
| Expt C |
2 peptides |
3 spectra |
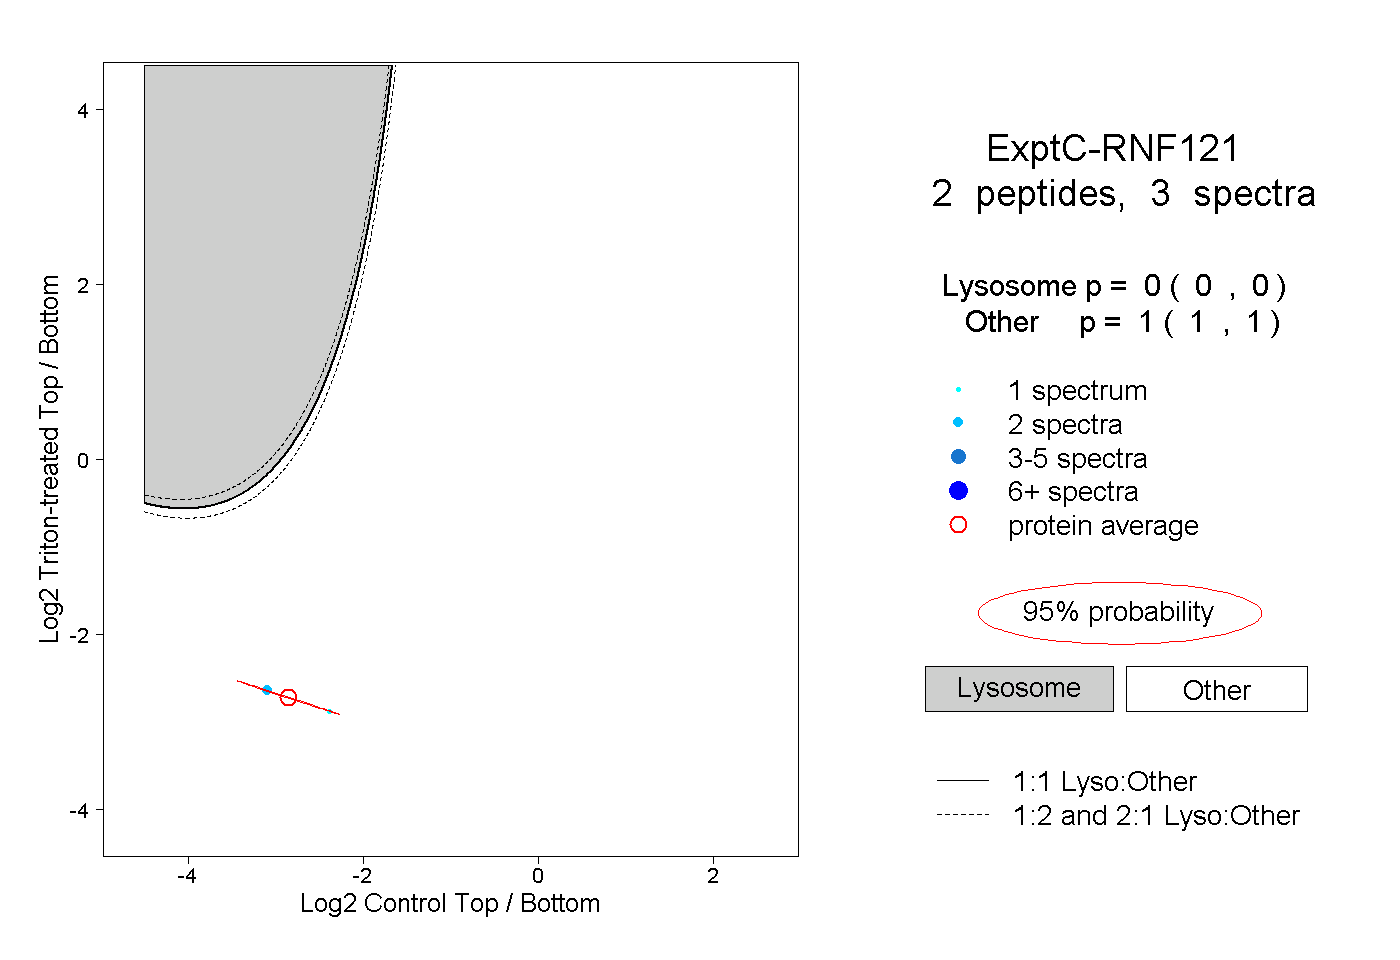 |
0.000 0.000 | 0.000 |
1.000 1.000 | 1.000 |