 13
13peptides
spectra
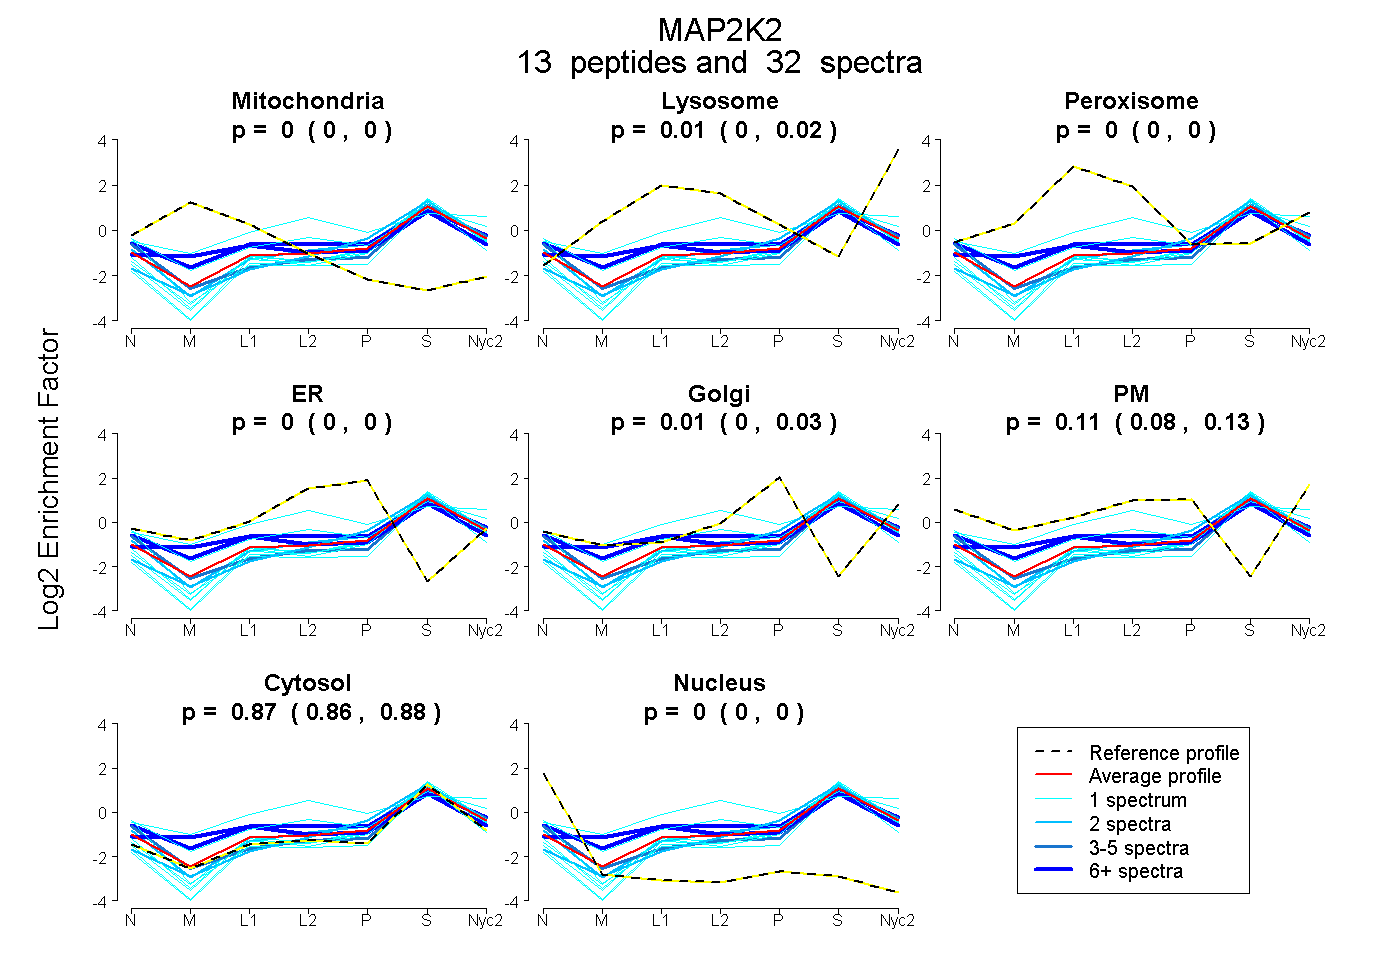
0.000 | 0.000
0.000 | 0.020
0.000 | 0.000
0.000 | 0.000
0.000 | 0.030
0.080 | 0.127
0.863 | 0.877
0.000 | 0.000
2peptides
spectra
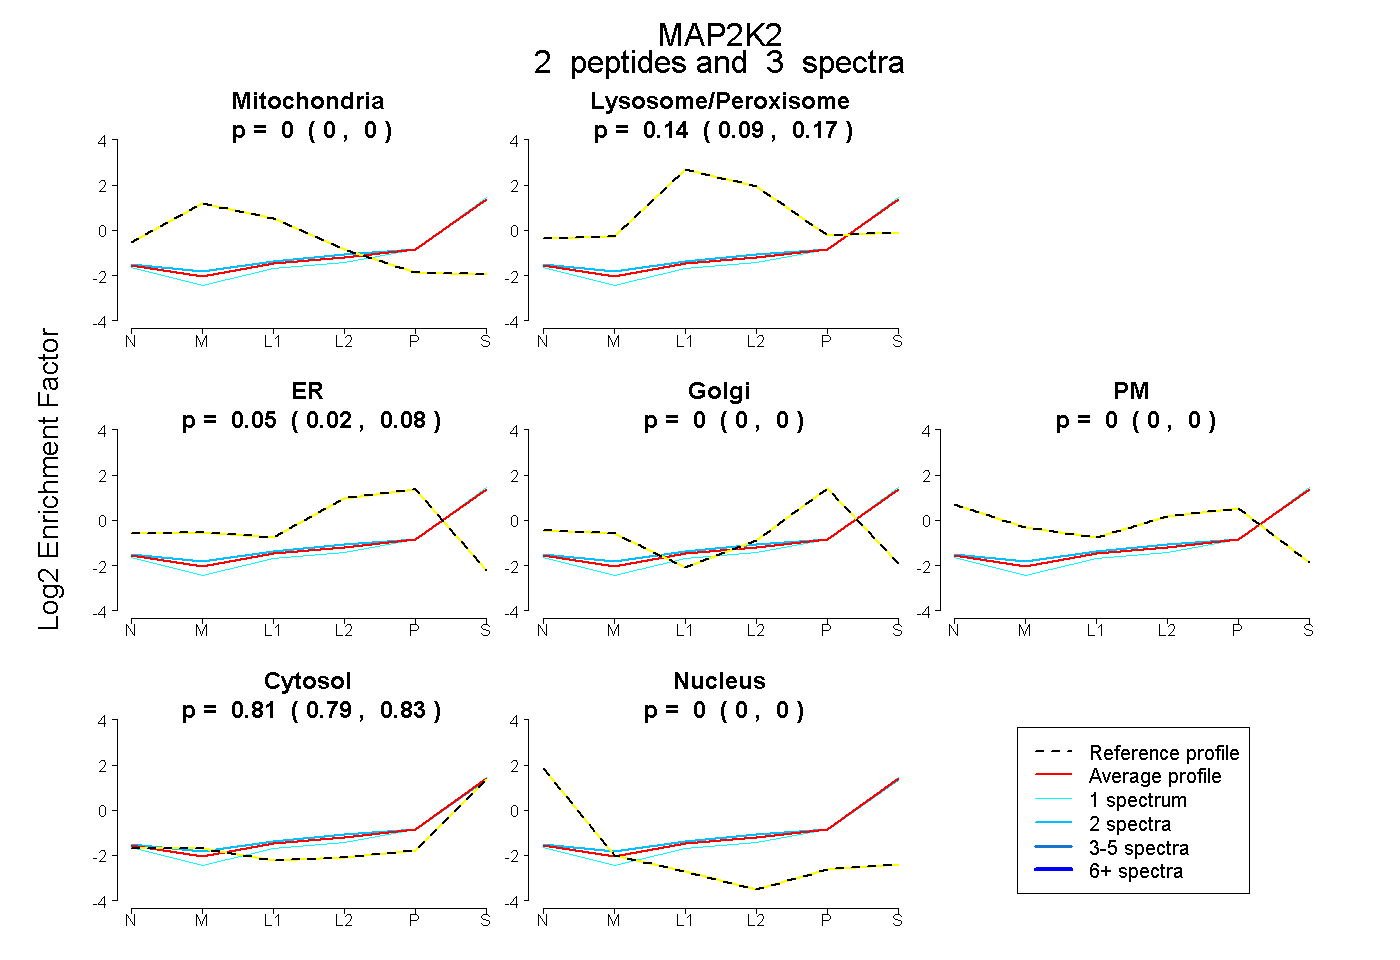
0.000 | 0.000
0.090 | 0.175
0.015 | 0.078
0.000 | 0.000
0.000 | 0.000
0.790 | 0.831
0.000 | 0.000
10peptides
spectra
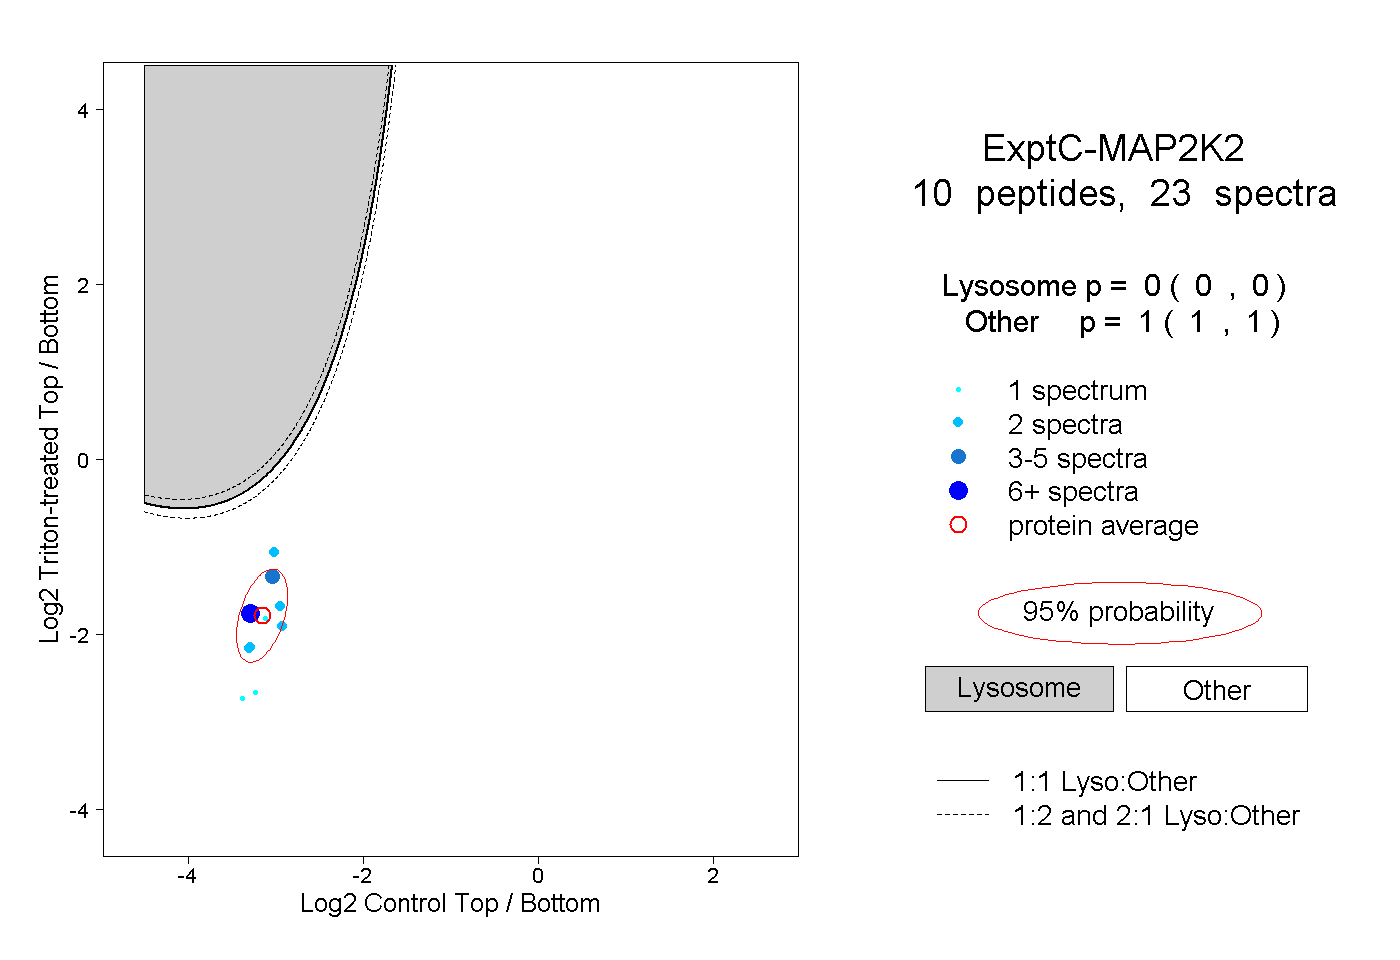
0.000 | 0.000
1.000 | 1.000