 13
13peptides
spectra
0.000 | 0.000
0.000 | 0.020
0.000 | 0.000
0.000 | 0.000
0.000 | 0.030
0.080 | 0.127
0.863 | 0.877
0.000 | 0.000
| Plot | Mito | Lyso | Perox | ER | Golgi | PM | Cytosol | Nucleus | |||||
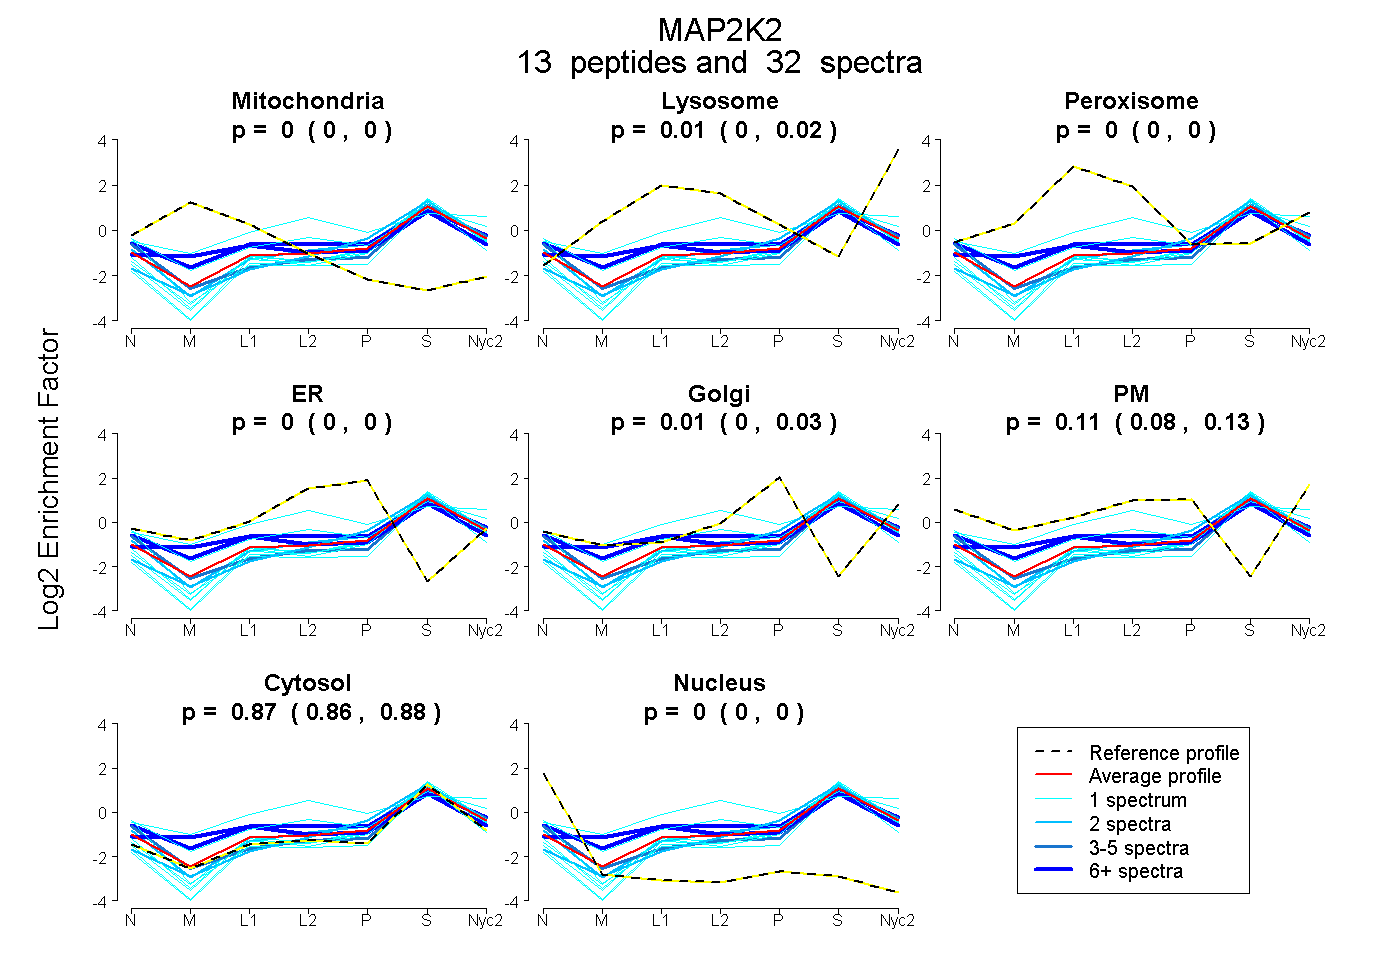
| Expt A |
13 peptides |
32 spectra |
|
0.000 0.000 | 0.000 |
0.008 0.000 | 0.020 |
0.000 0.000 | 0.000 |
0.000 0.000 | 0.000 |
0.010 0.000 | 0.030 |
0.111 0.080 | 0.127 |
0.871 0.863 | 0.877 |
0.000 0.000 | 0.000 |
| 1 spectrum, LIHLEIKPAVR | 0.000 | 0.000 | 0.000 | 0.000 | 0.000 | 0.000 | 1.000 | 0.000 | ||
| 1 spectrum, LEELDLDEQQR | 0.000 | 0.000 | 0.000 | 0.000 | 0.000 | 0.000 | 1.000 | 0.000 | ||
| 3 spectra, LEAFLTQK | 0.000 | 0.000 | 0.000 | 0.000 | 0.000 | 0.083 | 0.884 | 0.032 | ||
| 1 spectrum, SYMSPER | 0.000 | 0.113 | 0.216 | 0.000 | 0.000 | 0.188 | 0.483 | 0.000 | ||
| 2 spectra, VSIAVLR | 0.000 | 0.000 | 0.000 | 0.000 | 0.105 | 0.000 | 0.895 | 0.000 | ||
| 1 spectrum, GLAYLR | 0.000 | 0.000 | 0.000 | 0.000 | 0.021 | 0.000 | 0.979 | 0.000 | ||
| 1 spectrum, LPSGVFSSDFQEFVNK | 0.000 | 0.000 | 0.000 | 0.000 | 0.000 | 0.000 | 0.884 | 0.116 | ||
| 1 spectrum, YPIPPPDAK | 0.000 | 0.000 | 0.000 | 0.000 | 0.013 | 0.000 | 0.987 | 0.000 | ||
| 1 spectrum, IPEDILGK | 0.000 | 0.000 | 0.000 | 0.000 | 0.031 | 0.000 | 0.969 | 0.000 | ||
| 9 spectra, LLTNHAFIK | 0.109 | 0.035 | 0.117 | 0.000 | 0.030 | 0.000 | 0.709 | 0.000 | ||
| 2 spectra, DVKPSNILVNSR | 0.000 | 0.000 | 0.000 | 0.000 | 0.075 | 0.049 | 0.877 | 0.000 | ||
| 1 spectrum, SEGEDVDFAGWLCR | 0.000 | 0.019 | 0.092 | 0.000 | 0.000 | 0.197 | 0.691 | 0.000 | ||
| 8 spectra, HRPSGLIMAR | 0.000 | 0.000 | 0.128 | 0.000 | 0.000 | 0.150 | 0.722 | 0.000 |
| Plot | Mito | Lyso or Perox | ER | Golgi | PM | Cytosol | Nucleus | ||||||
| Expt B |
2 peptides |
3 spectra |
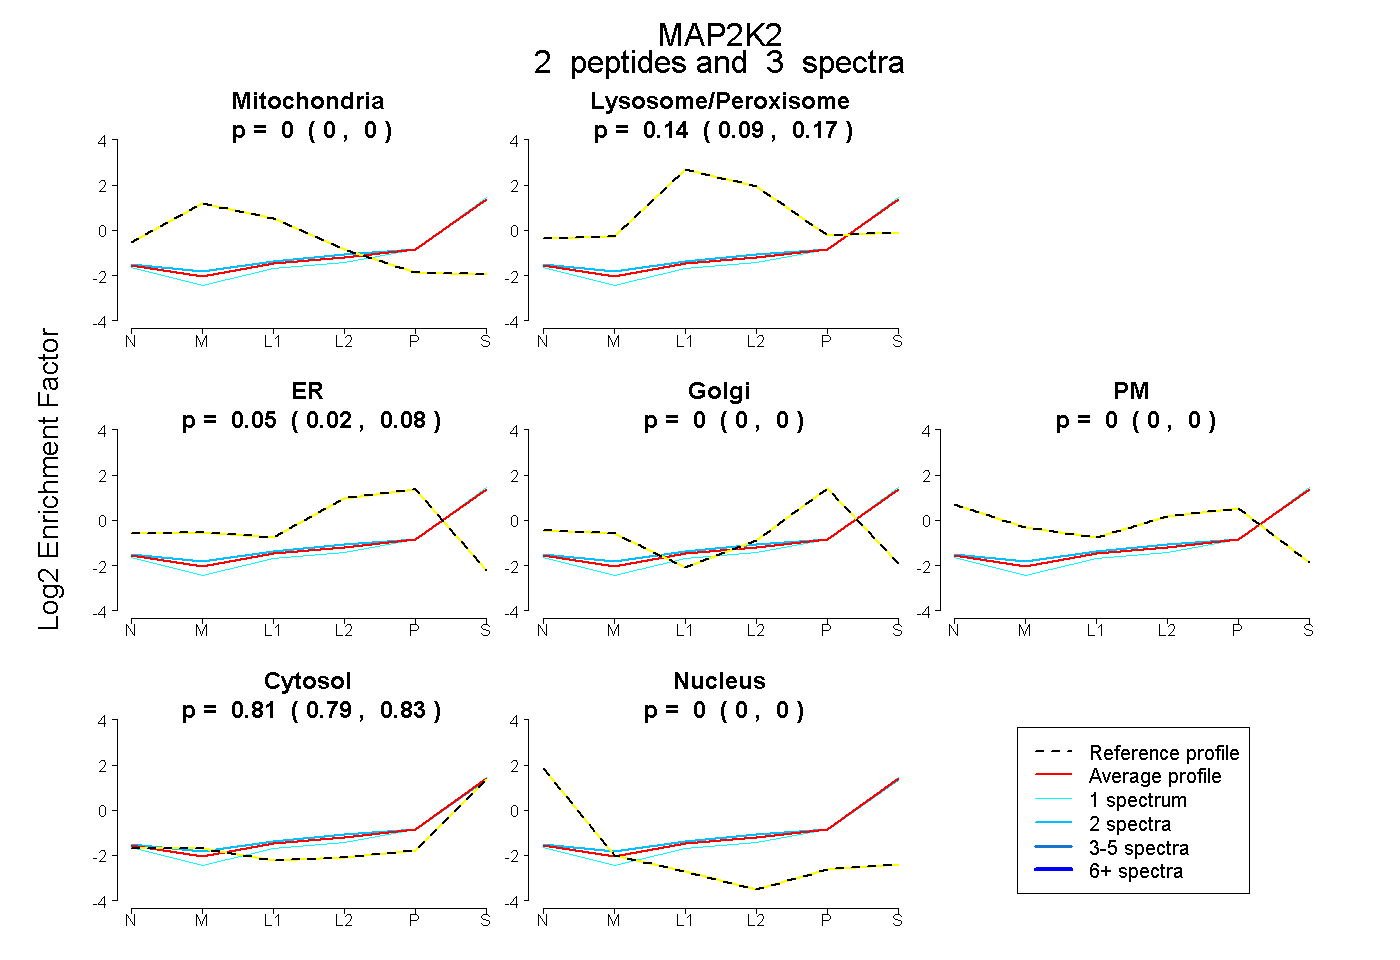 |
0.000 0.000 | 0.000 |
0.136 0.090 | 0.175 |
0.052 0.015 | 0.078 |
0.000 0.000 | 0.000 |
0.000 0.000 | 0.000 |
0.812 0.790 | 0.831 |
0.000 0.000 | 0.000 |
|||
| Plot | Lyso | Other | |||||||||||
| Expt C |
10 peptides |
23 spectra |
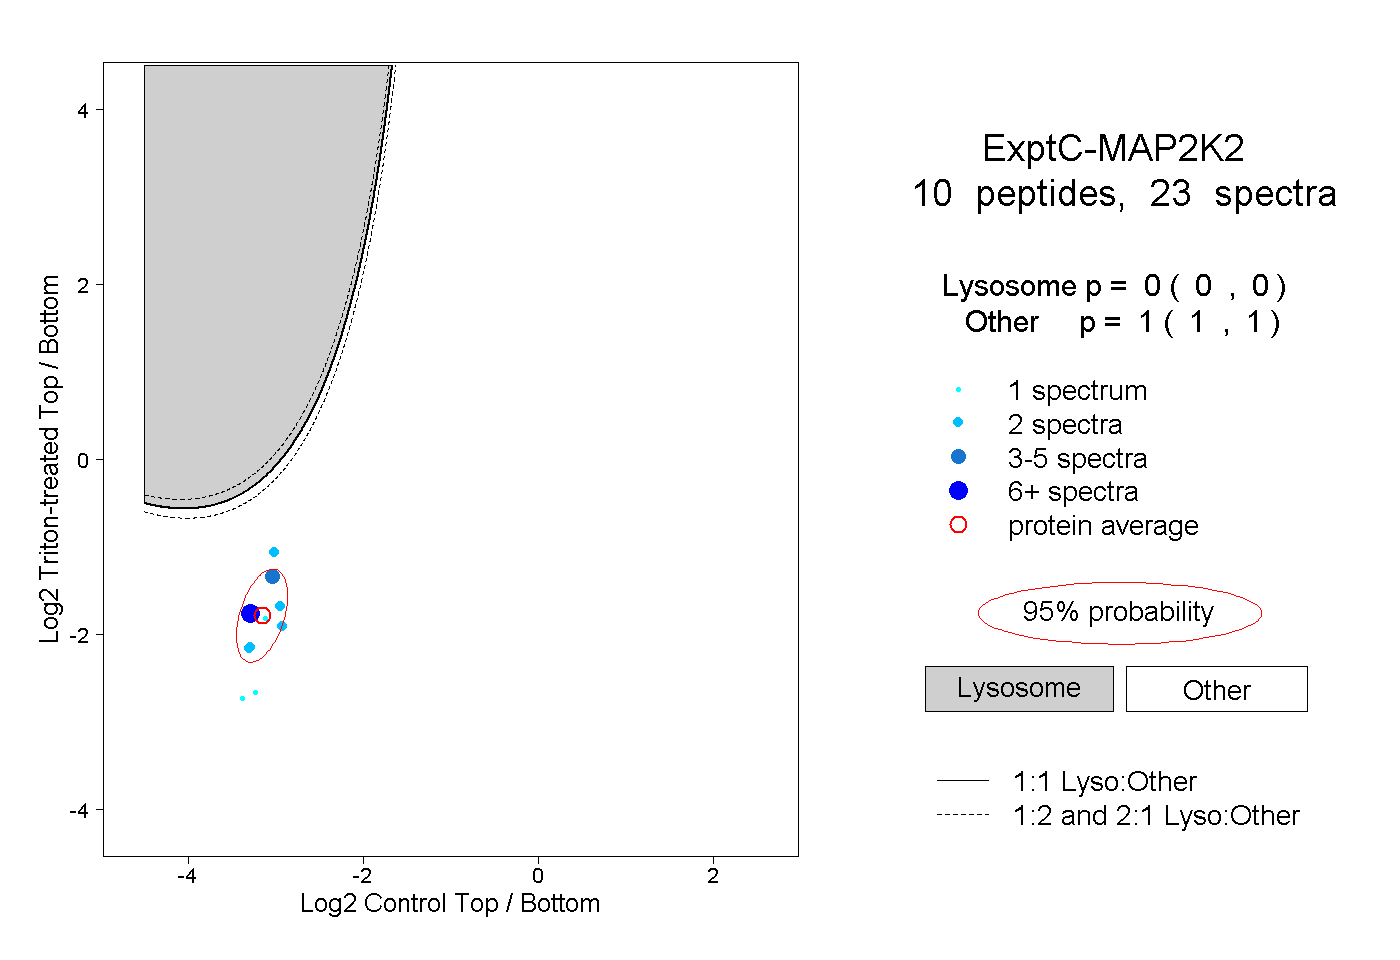 |
0.000 0.000 | 0.000 |
1.000 1.000 | 1.000 |