 10
10peptides
spectra
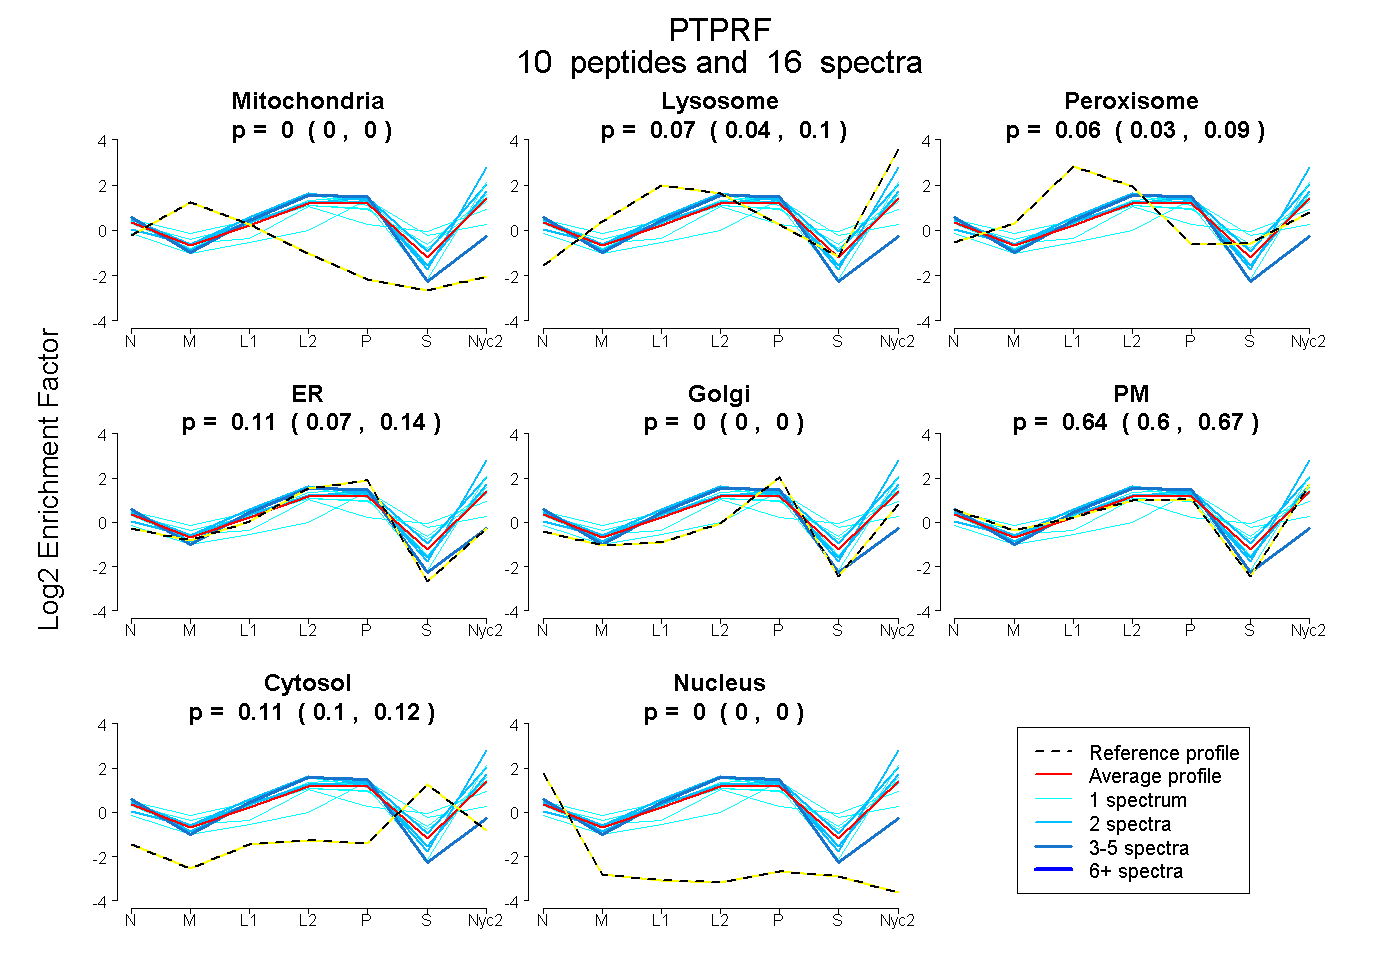
0.000 | 0.000
0.043 | 0.102
0.033 | 0.087
0.071 | 0.138
0.000 | 0.000
0.605 | 0.671
0.101 | 0.125
0.000 | 0.000
6peptides
spectra
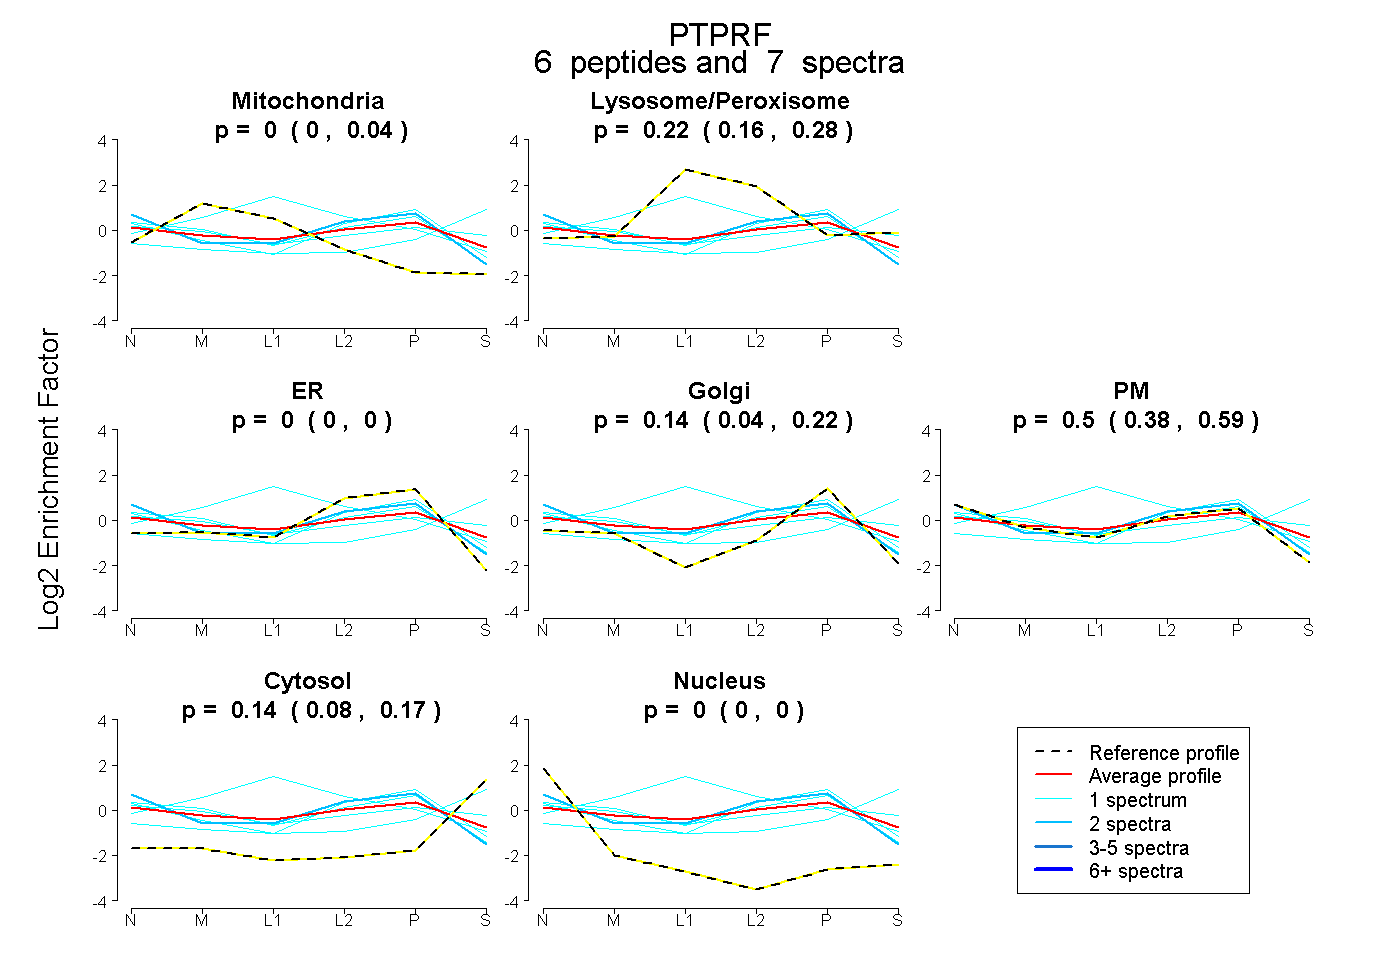
0.000 | 0.039
0.160 | 0.277
0.000 | 0.000
0.039 | 0.220
0.380 | 0.591
0.081 | 0.174
0.000 | 0.000
19peptides
spectra
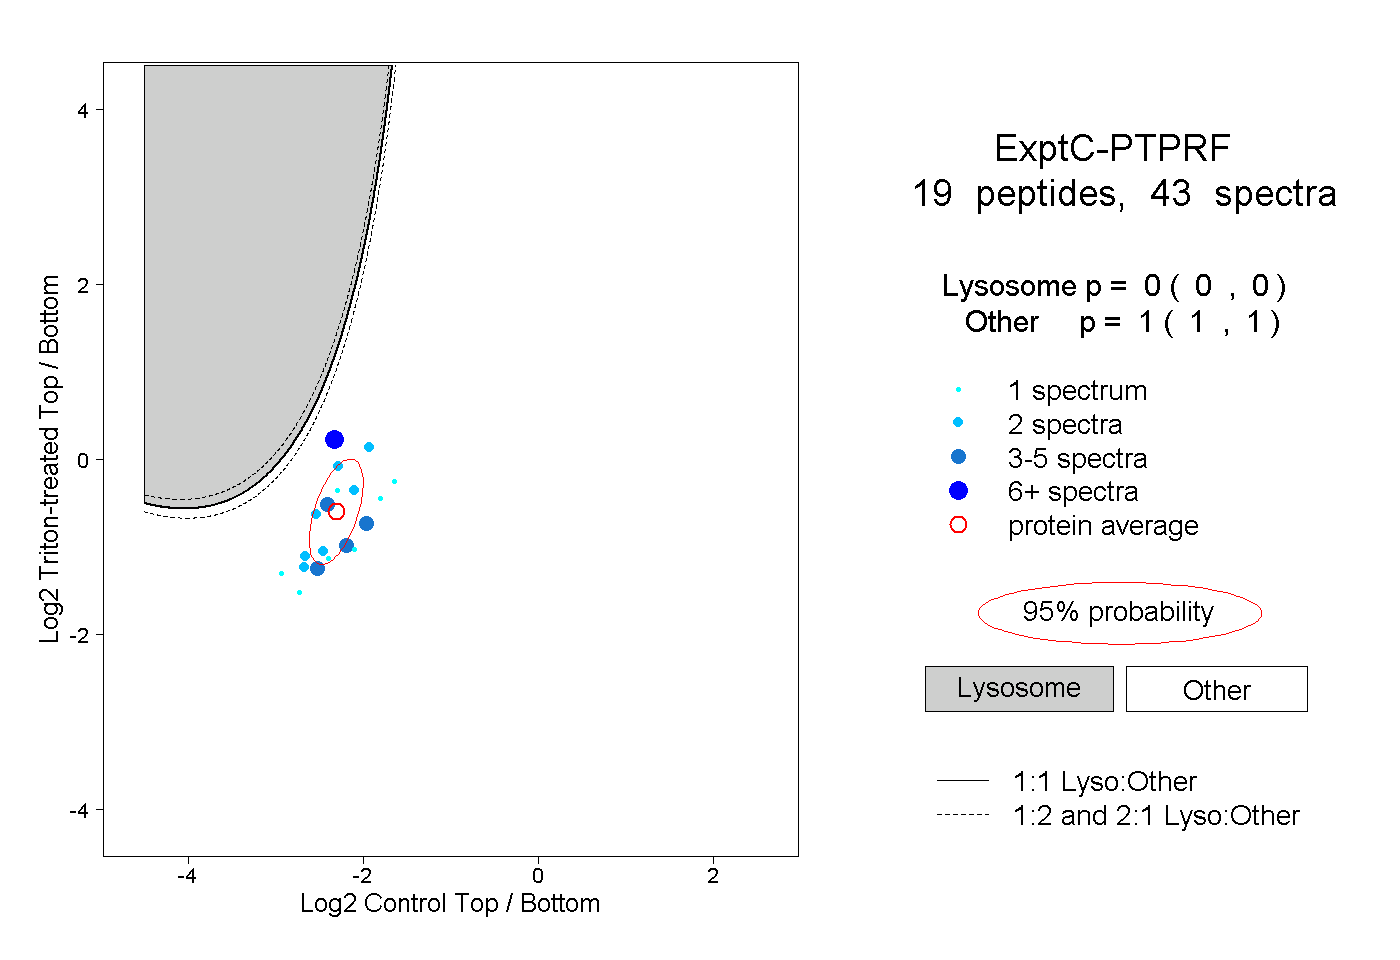
0.000 | 0.000
1.000 | 1.000
3peptides
spectra
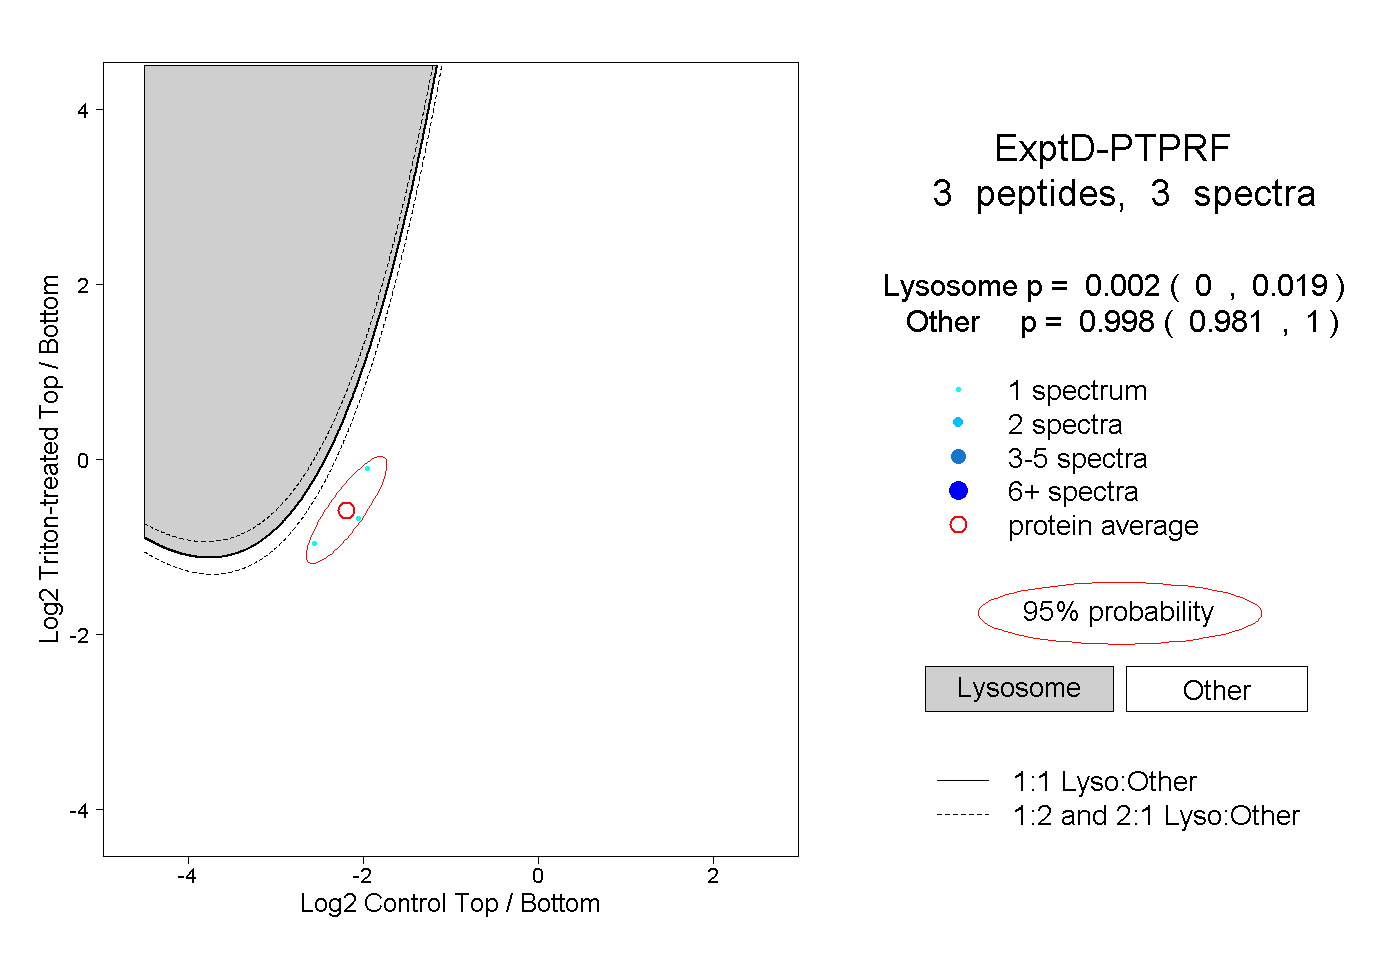
0.000 | 0.019
0.981 | 1.000