 10
10peptides
spectra
0.000 | 0.000
0.043 | 0.102
0.033 | 0.087
0.071 | 0.138
0.000 | 0.000
0.605 | 0.671
0.101 | 0.125
0.000 | 0.000
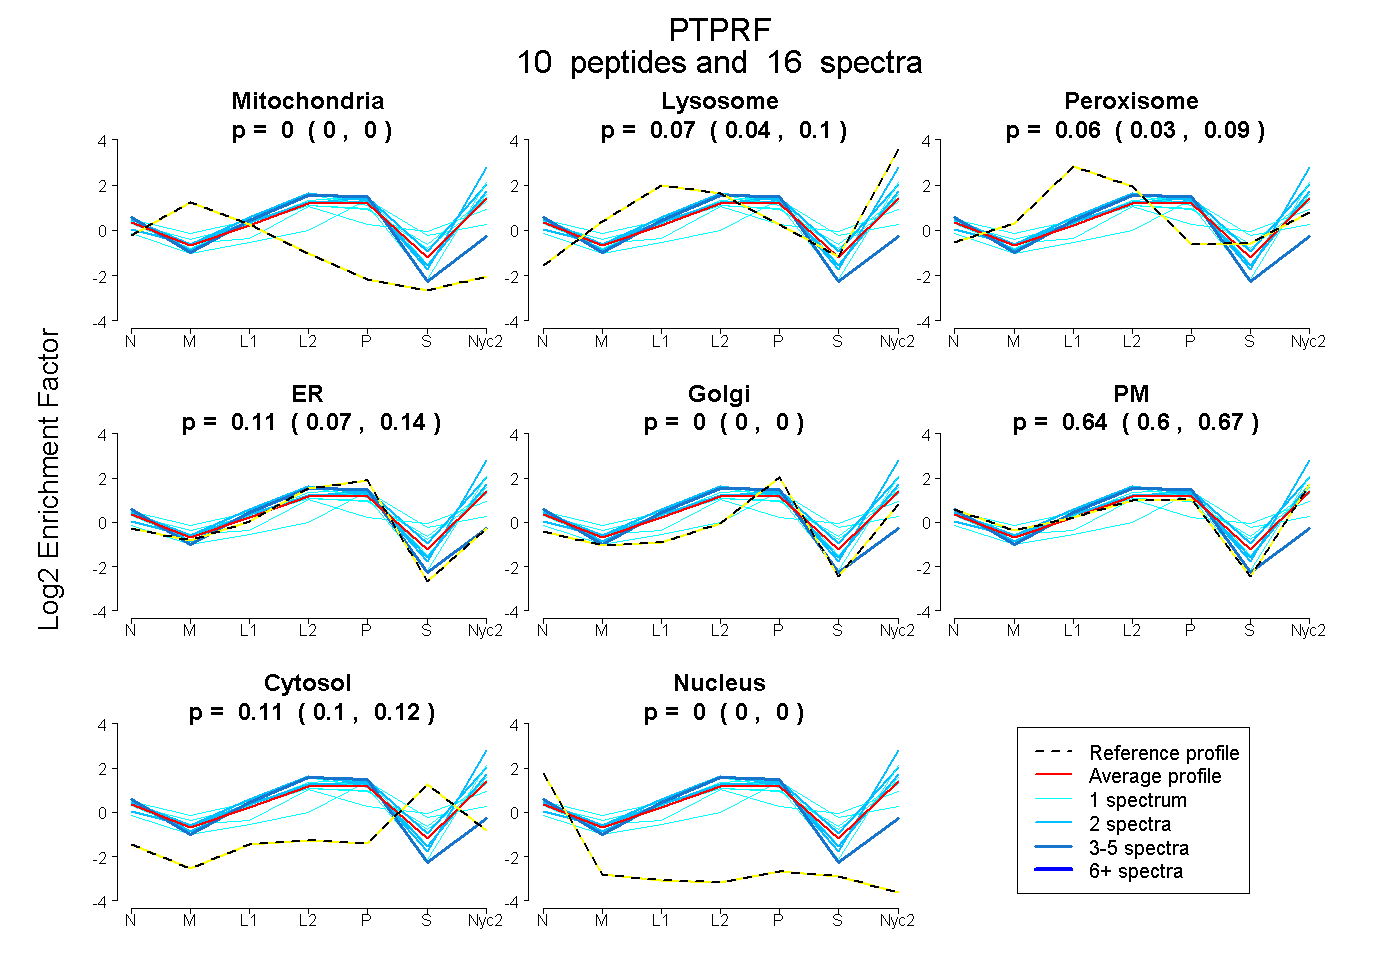
| Plot | Mito | Lyso | Perox | ER | Golgi | PM | Cytosol | Nucleus | |||||
| Expt A |
10 peptides |
16 spectra |
|
0.000 0.000 | 0.000 |
0.075 0.043 | 0.102 |
0.062 0.033 | 0.087 |
0.108 0.071 | 0.138 |
0.000 0.000 | 0.000 |
0.641 0.605 | 0.671 |
0.114 0.101 | 0.125 |
0.000 0.000 | 0.000 |
| 1 spectrum, NVLELSNVMR | 0.000 | 0.159 | 0.000 | 0.000 | 0.000 | 0.841 | 0.000 | 0.000 | ||
| 1 spectrum, HVVDGISR | 0.000 | 0.055 | 0.146 | 0.031 | 0.000 | 0.616 | 0.152 | 0.000 | ||
| 1 spectrum, FEVIEFDDGAGSVLR | 0.000 | 0.000 | 0.154 | 0.000 | 0.571 | 0.000 | 0.274 | 0.000 | ||
| 2 spectra, ELPGELLGYR | 0.000 | 0.062 | 0.027 | 0.044 | 0.000 | 0.808 | 0.060 | 0.000 | ||
| 4 spectra, VTCVSTGSTTVR | 0.000 | 0.000 | 0.108 | 0.739 | 0.000 | 0.108 | 0.000 | 0.046 | ||
| 1 spectrum, DHPPIPITDLADNIER | 0.000 | 0.071 | 0.147 | 0.000 | 0.000 | 0.618 | 0.164 | 0.000 | ||
| 2 spectra, VLAVNSIGR | 0.000 | 0.268 | 0.000 | 0.000 | 0.000 | 0.732 | 0.000 | 0.000 | ||
| 1 spectrum, TAQSTPSAPPQK | 0.000 | 0.000 | 0.176 | 0.000 | 0.000 | 0.517 | 0.307 | 0.000 | ||
| 2 spectra, MVWEQR | 0.000 | 0.282 | 0.000 | 0.029 | 0.121 | 0.480 | 0.088 | 0.000 | ||
| 1 spectrum, AGPGEEFEK | 0.000 | 0.132 | 0.000 | 0.200 | 0.000 | 0.614 | 0.054 | 0.000 |
| Plot | Mito | Lyso or Perox | ER | Golgi | PM | Cytosol | Nucleus | ||||||
| Expt B |
6 peptides |
7 spectra |
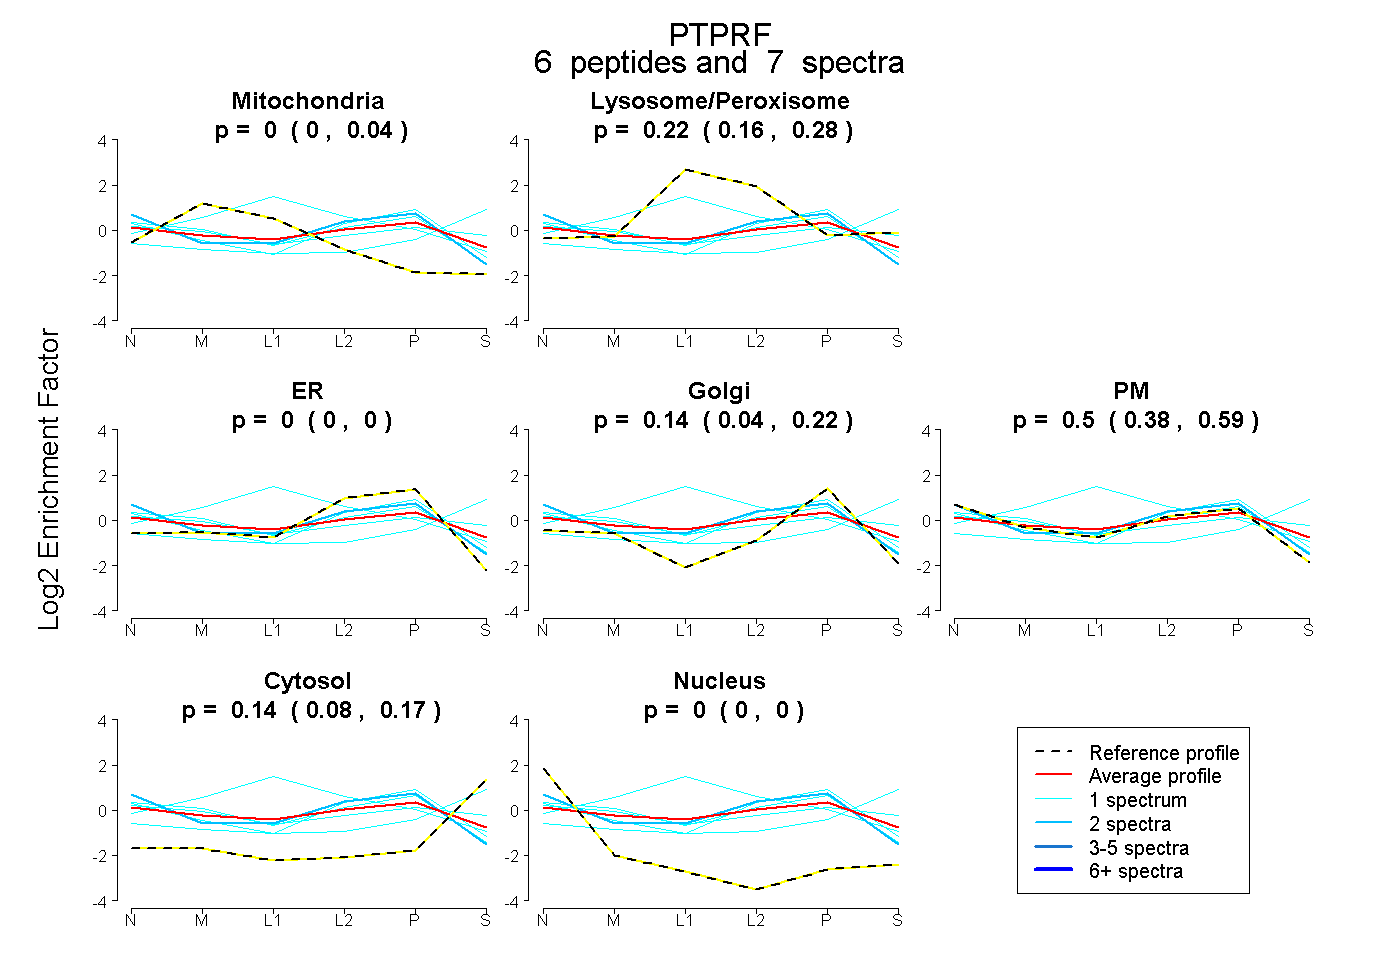 |
0.000 0.000 | 0.039 |
0.224 0.160 | 0.277 |
0.000 0.000 | 0.000 |
0.137 0.039 | 0.220 |
0.504 0.380 | 0.591 |
0.135 0.081 | 0.174 |
0.000 0.000 | 0.000 |
|||
| Plot | Lyso | Other | |||||||||||
| Expt C |
19 peptides |
43 spectra |
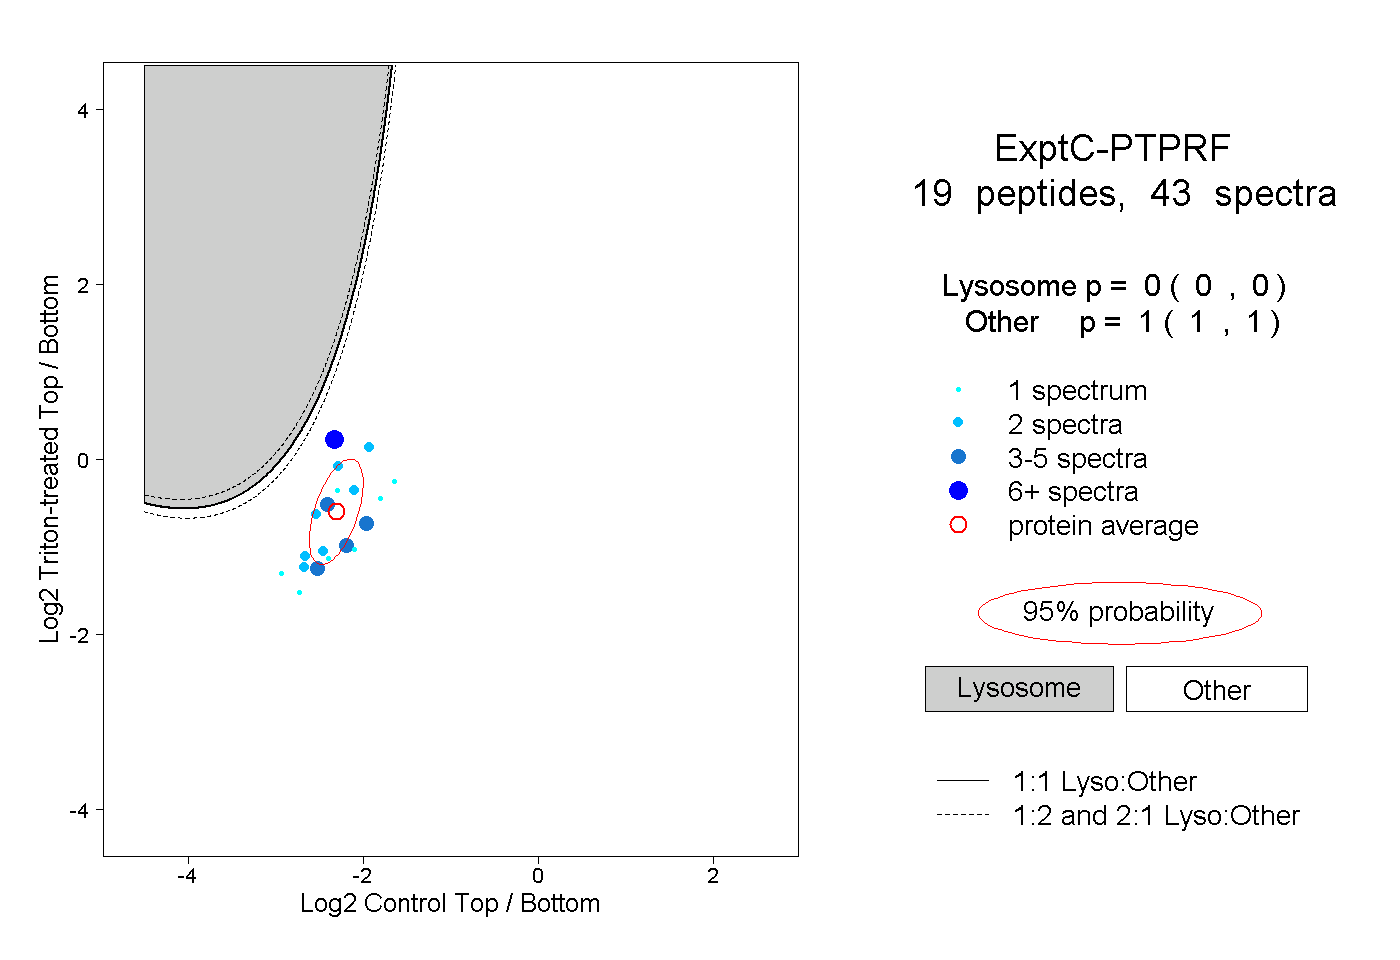 |
0.000 0.000 | 0.000 |
1.000 1.000 | 1.000 |
||||||||
| Plot | Lyso | Other | |||||||||||
| Expt D |
3 peptides |
3 spectra |
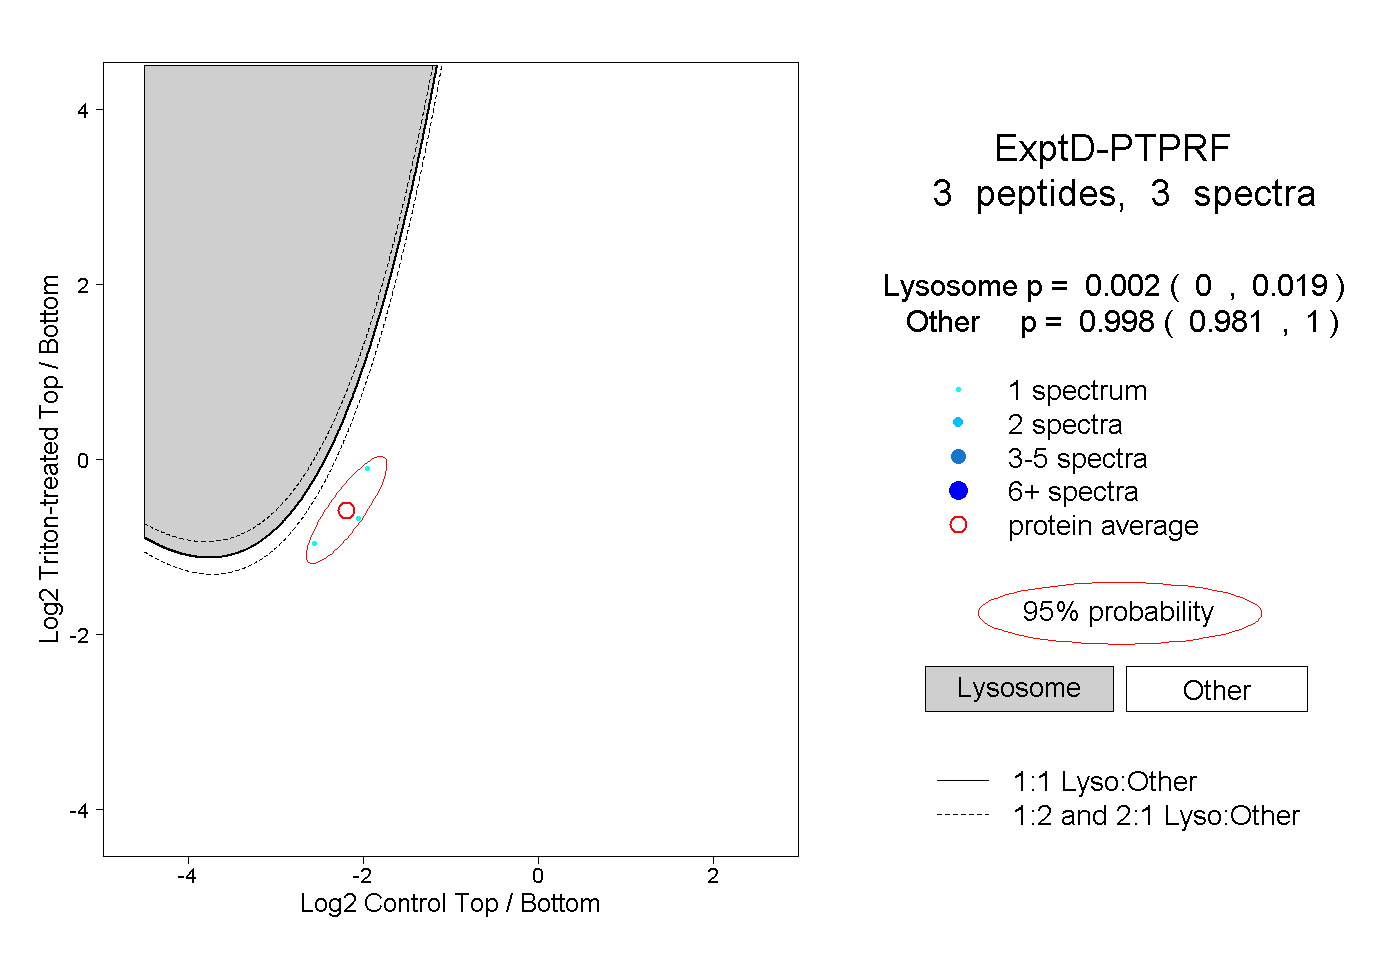 |
0.002 0.000 | 0.019 |
0.998 0.981 | 1.000 |