 12
12peptides
spectra
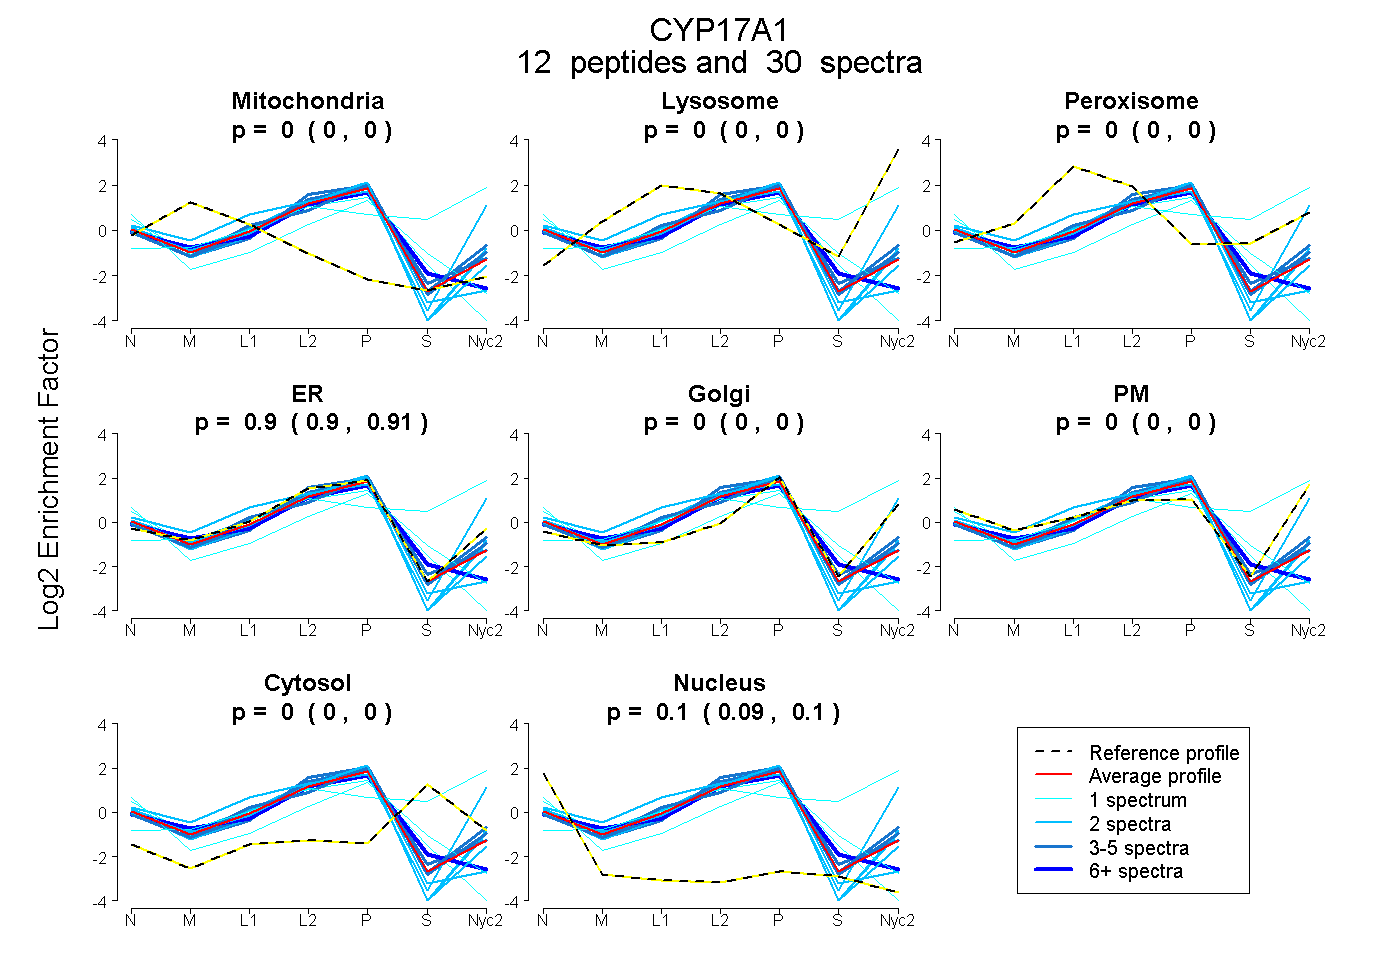
0.000 | 0.000
0.000 | 0.000
0.000 | 0.000
0.897 | 0.910
0.000 | 0.000
0.000 | 0.000
0.000 | 0.000
0.089 | 0.102
1peptide
spectra
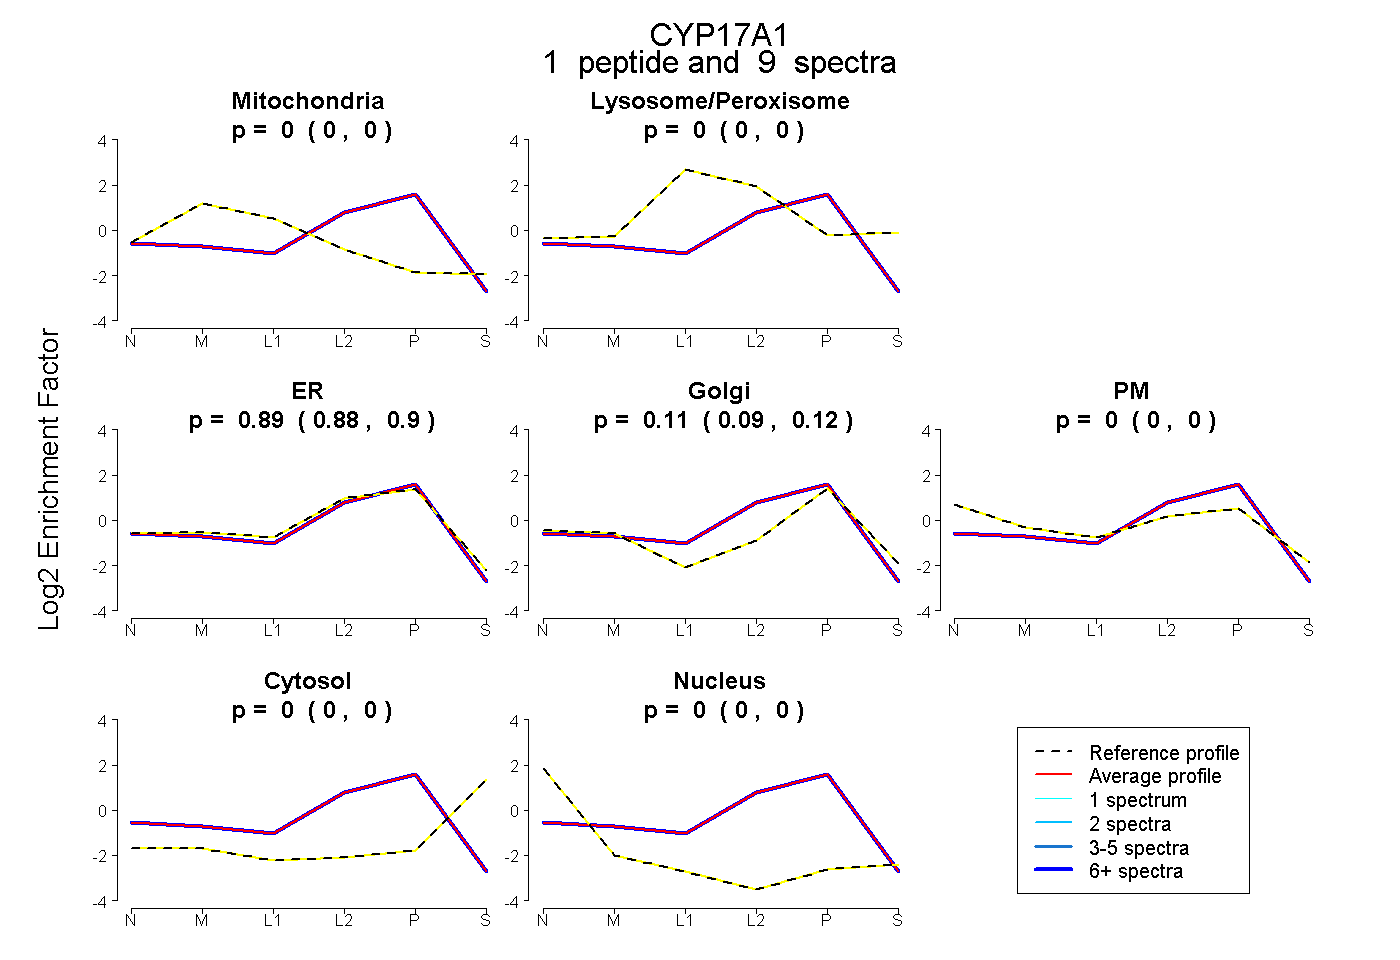
0.000 | 0.000
0.000 | 0.000
0.880 | 0.904
0.093 | 0.118
0.000 | 0.000
0.000 | 0.000
0.000 | 0.000
7peptides
spectra
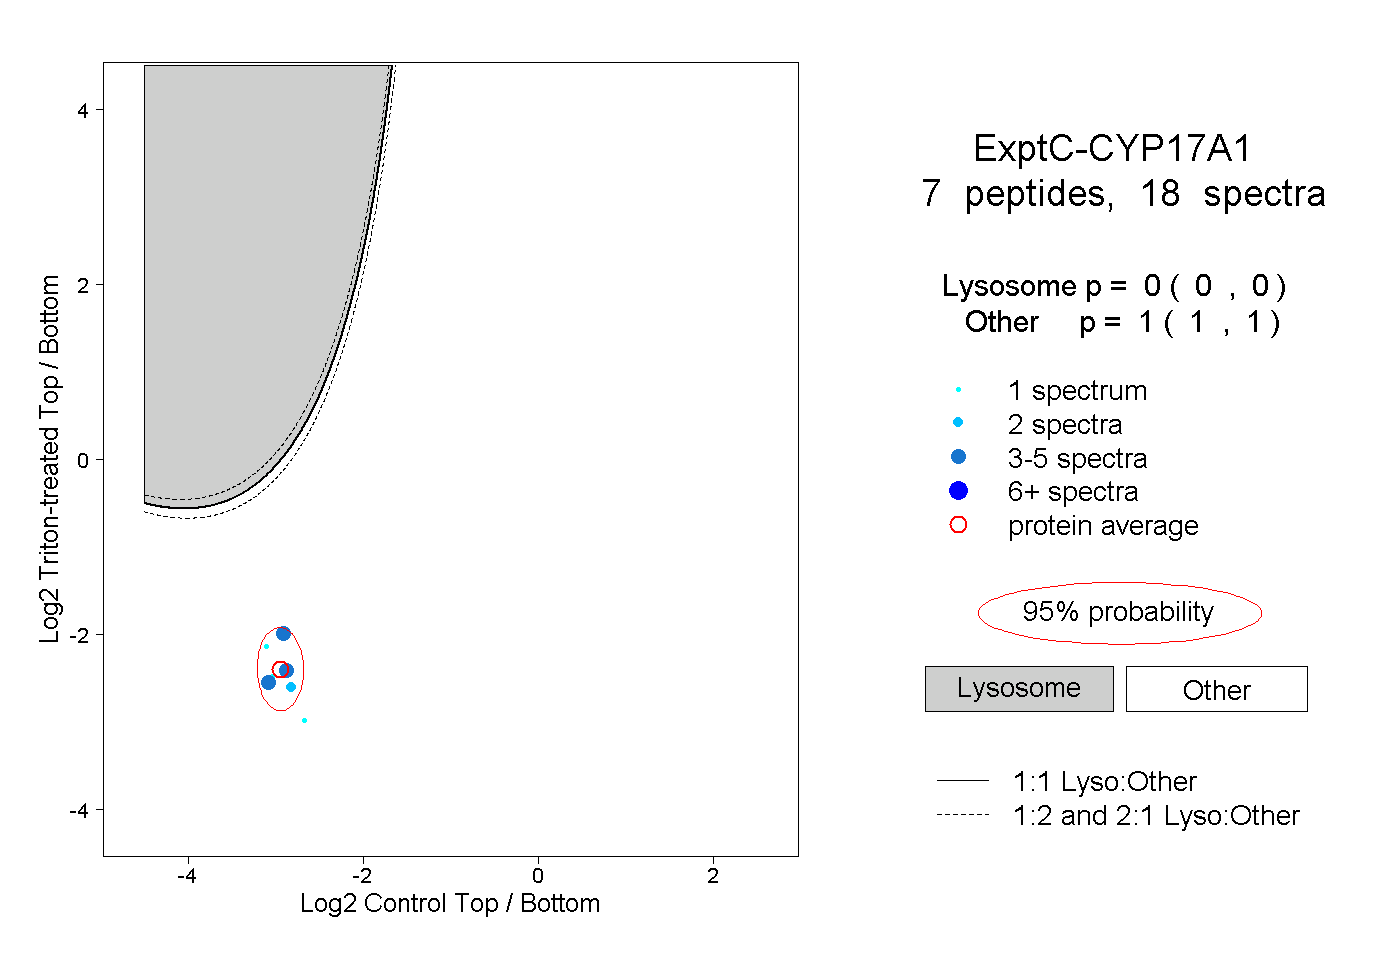
0.000 | 0.000
1.000 | 1.000
1peptide
spectrum
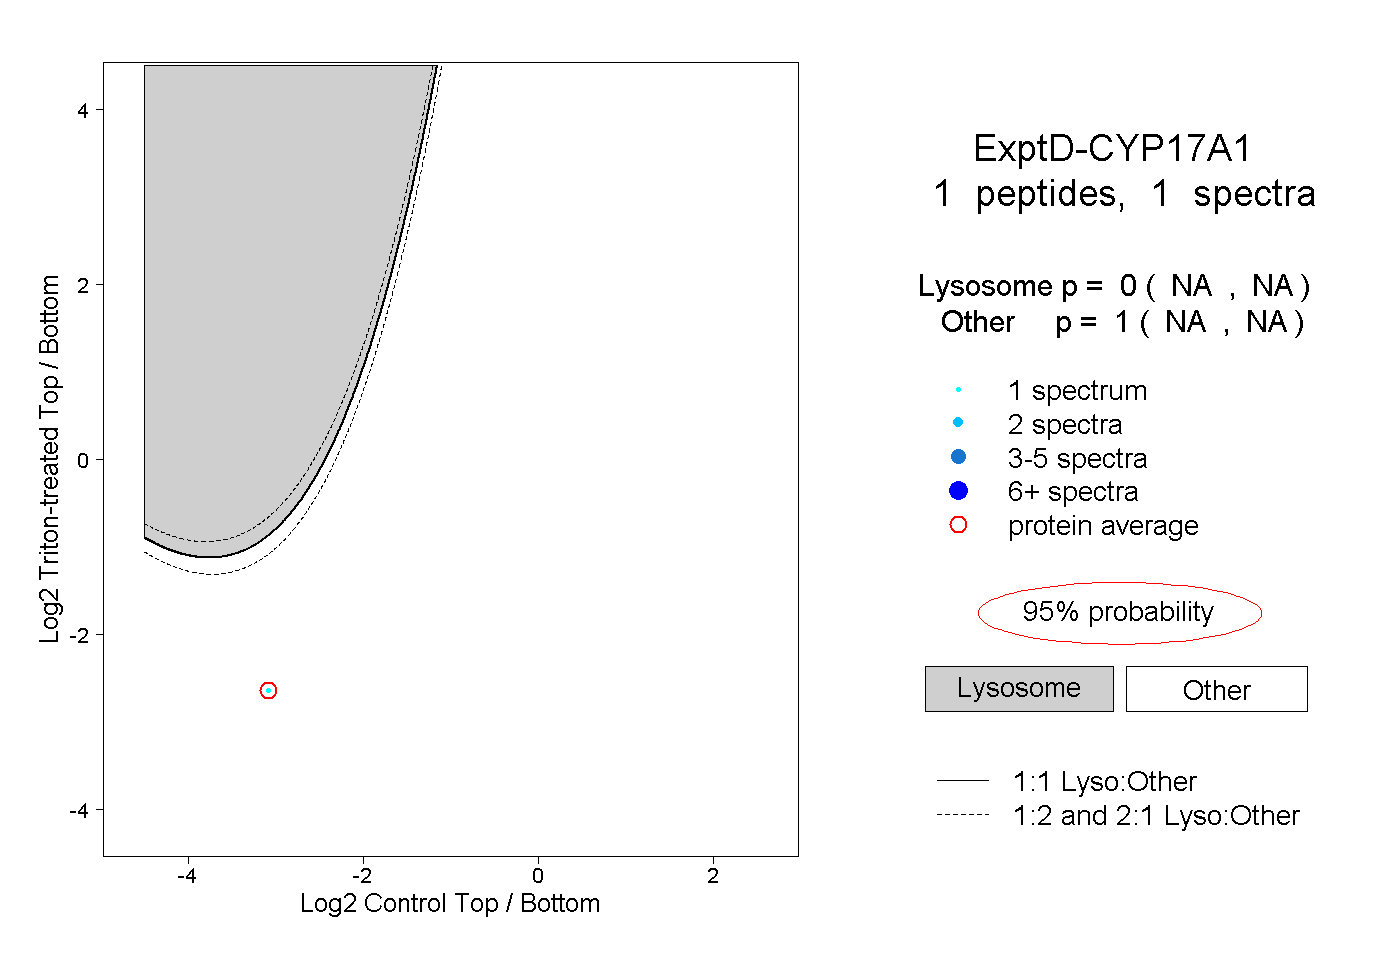
NA | NA
NA | NA