 12
12peptides
spectra
0.000 | 0.000
0.000 | 0.000
0.000 | 0.000
0.897 | 0.910
0.000 | 0.000
0.000 | 0.000
0.000 | 0.000
0.089 | 0.102
| Plot | Mito | Lyso | Perox | ER | Golgi | PM | Cytosol | Nucleus | |||||
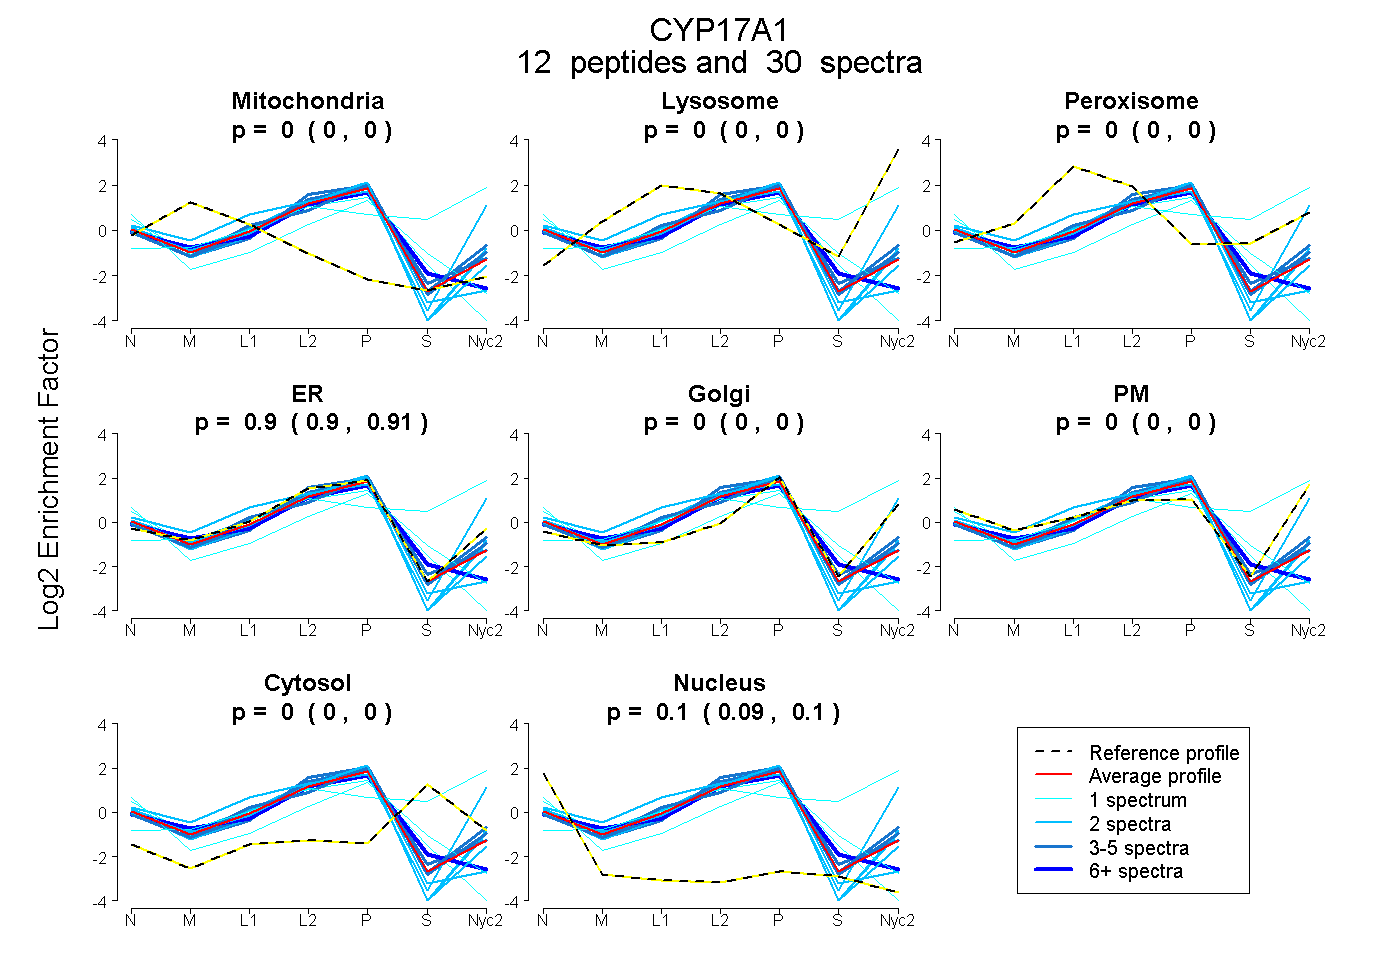
| Expt A |
12 peptides |
30 spectra |
|
0.000 0.000 | 0.000 |
0.000 0.000 | 0.000 |
0.000 0.000 | 0.000 |
0.904 0.897 | 0.910 |
0.000 0.000 | 0.000 |
0.000 0.000 | 0.000 |
0.000 0.000 | 0.000 |
0.096 0.089 | 0.102 |
| 1 spectrum, ANVDSSIGEFTVPK | 0.065 | 0.000 | 0.000 | 0.708 | 0.000 | 0.000 | 0.000 | 0.227 | ||
| 2 spectra, FLDPTGSHLITPTQSYLPFGAGPR | 0.000 | 0.000 | 0.000 | 0.844 | 0.000 | 0.000 | 0.000 | 0.156 | ||
| 2 spectra, YGPIYSLR | 0.000 | 0.000 | 0.000 | 0.907 | 0.000 | 0.000 | 0.000 | 0.093 | ||
| 2 spectra, DPDVFSDR | 0.000 | 0.000 | 0.000 | 0.941 | 0.000 | 0.000 | 0.000 | 0.059 | ||
| 1 spectrum, SHLLMLEATIR | 0.000 | 0.497 | 0.000 | 0.020 | 0.069 | 0.081 | 0.334 | 0.000 | ||
| 3 spectra, GHMHVNFFK | 0.000 | 0.000 | 0.000 | 0.916 | 0.000 | 0.000 | 0.005 | 0.079 | ||
| 1 spectrum, SLCDMMLAHDK | 0.000 | 0.000 | 0.000 | 0.591 | 0.000 | 0.000 | 0.157 | 0.251 | ||
| 4 spectra, SCIGEALAR | 0.000 | 0.000 | 0.000 | 0.909 | 0.034 | 0.000 | 0.000 | 0.057 | ||
| 4 spectra, FDLDVSDDK | 0.000 | 0.000 | 0.000 | 0.941 | 0.000 | 0.000 | 0.000 | 0.059 | ||
| 2 spectra, LGTTTTVIIGHYQLAR | 0.000 | 0.000 | 0.000 | 0.403 | 0.000 | 0.597 | 0.000 | 0.000 | ||
| 2 spectra, EIDQYVGFSR | 0.000 | 0.000 | 0.000 | 0.945 | 0.000 | 0.000 | 0.000 | 0.055 | ||
| 6 spectra, IRPVAPMLIPHK | 0.050 | 0.000 | 0.000 | 0.800 | 0.000 | 0.000 | 0.017 | 0.133 |
| Plot | Mito | Lyso or Perox | ER | Golgi | PM | Cytosol | Nucleus | ||||||
| Expt B |
1 peptide |
9 spectra |
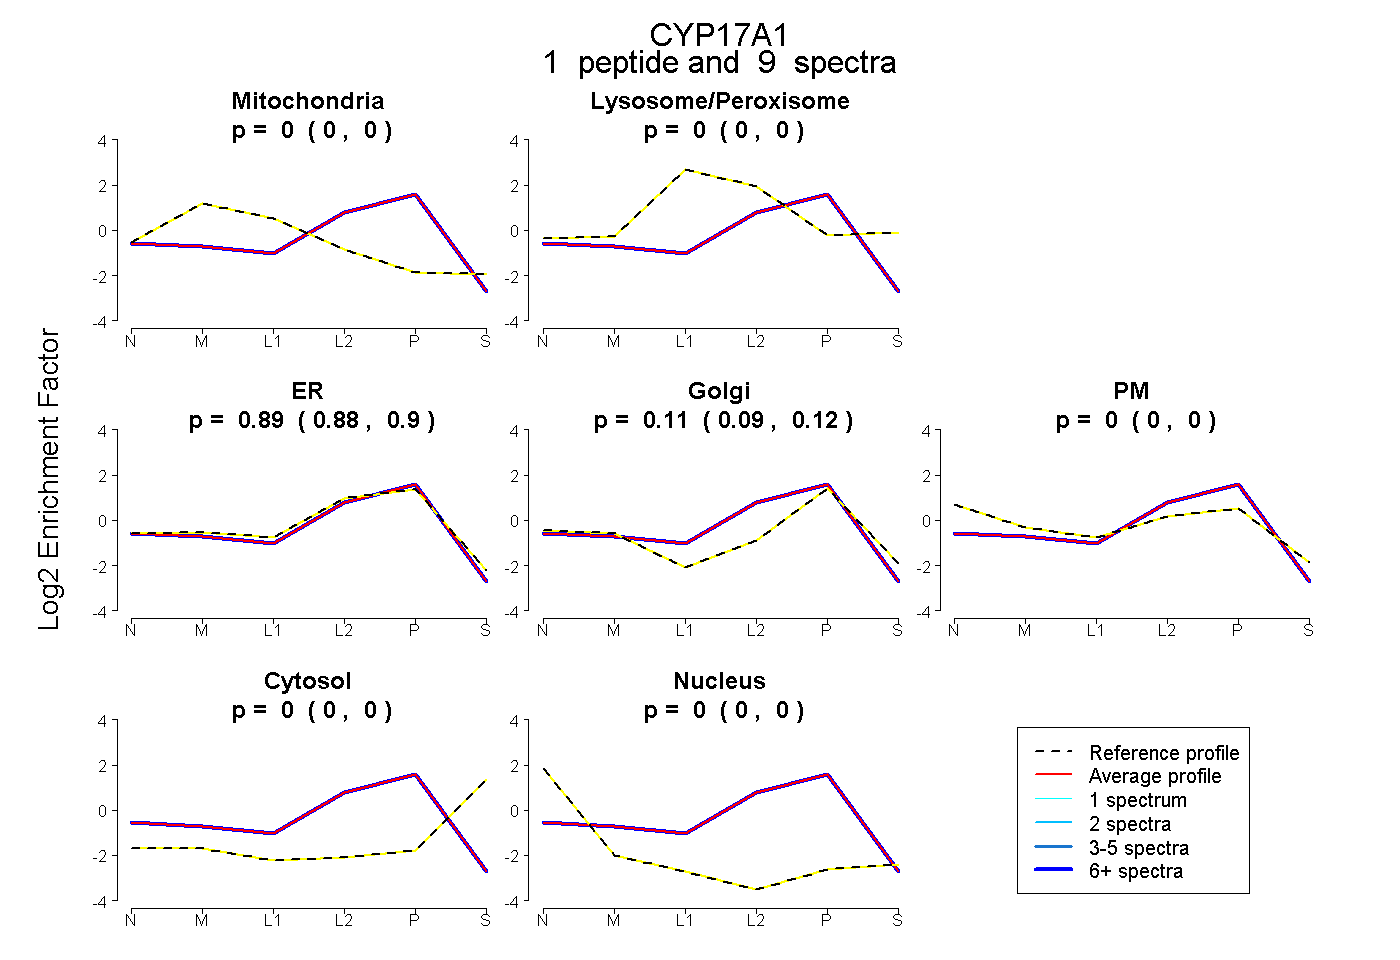 |
0.000 0.000 | 0.000 |
0.000 0.000 | 0.000 |
0.893 0.880 | 0.904 |
0.107 0.093 | 0.118 |
0.000 0.000 | 0.000 |
0.000 0.000 | 0.000 |
0.000 0.000 | 0.000 |
|||
| Plot | Lyso | Other | |||||||||||
| Expt C |
7 peptides |
18 spectra |
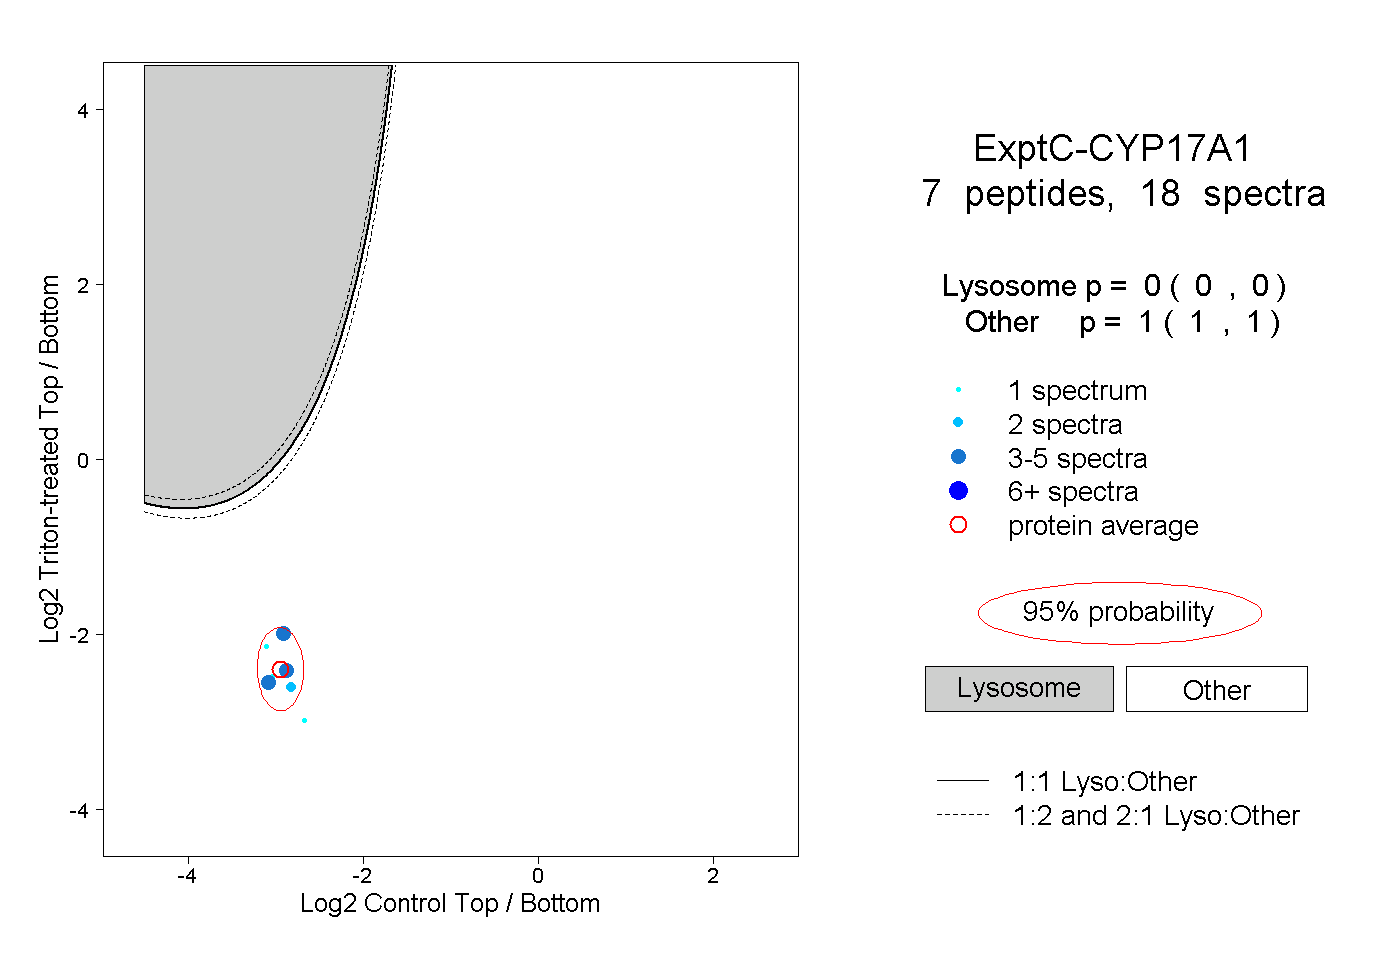 |
0.000 0.000 | 0.000 |
1.000 1.000 | 1.000 |
||||||||
| Plot | Lyso | Other | |||||||||||
| Expt D |
1 peptide |
1 spectrum |
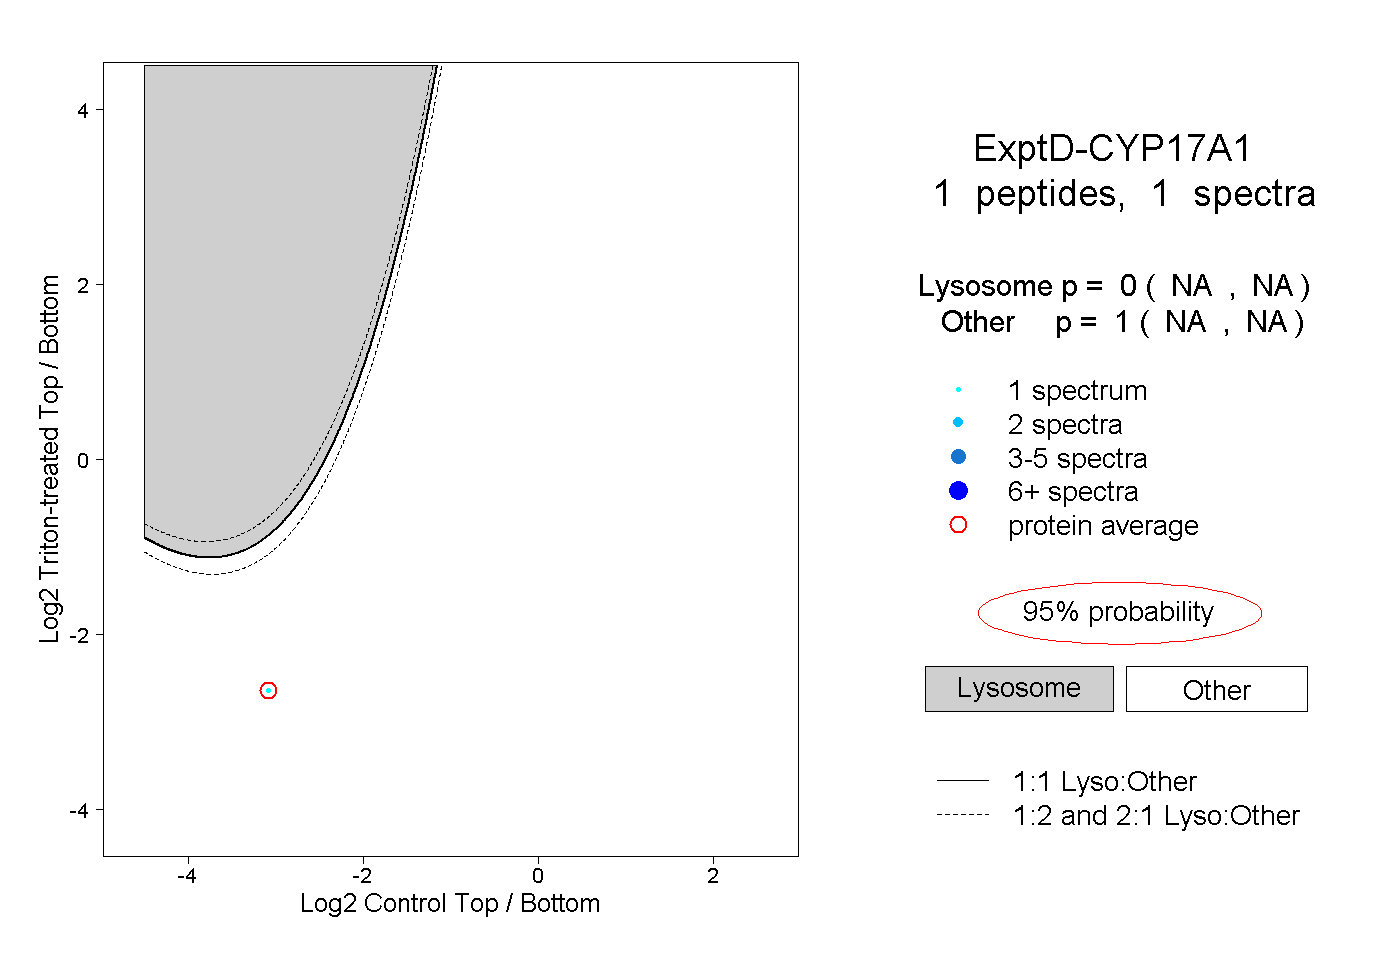 |
0.000 NA | NA |
1.000 NA | NA |