 7
7peptides
spectra
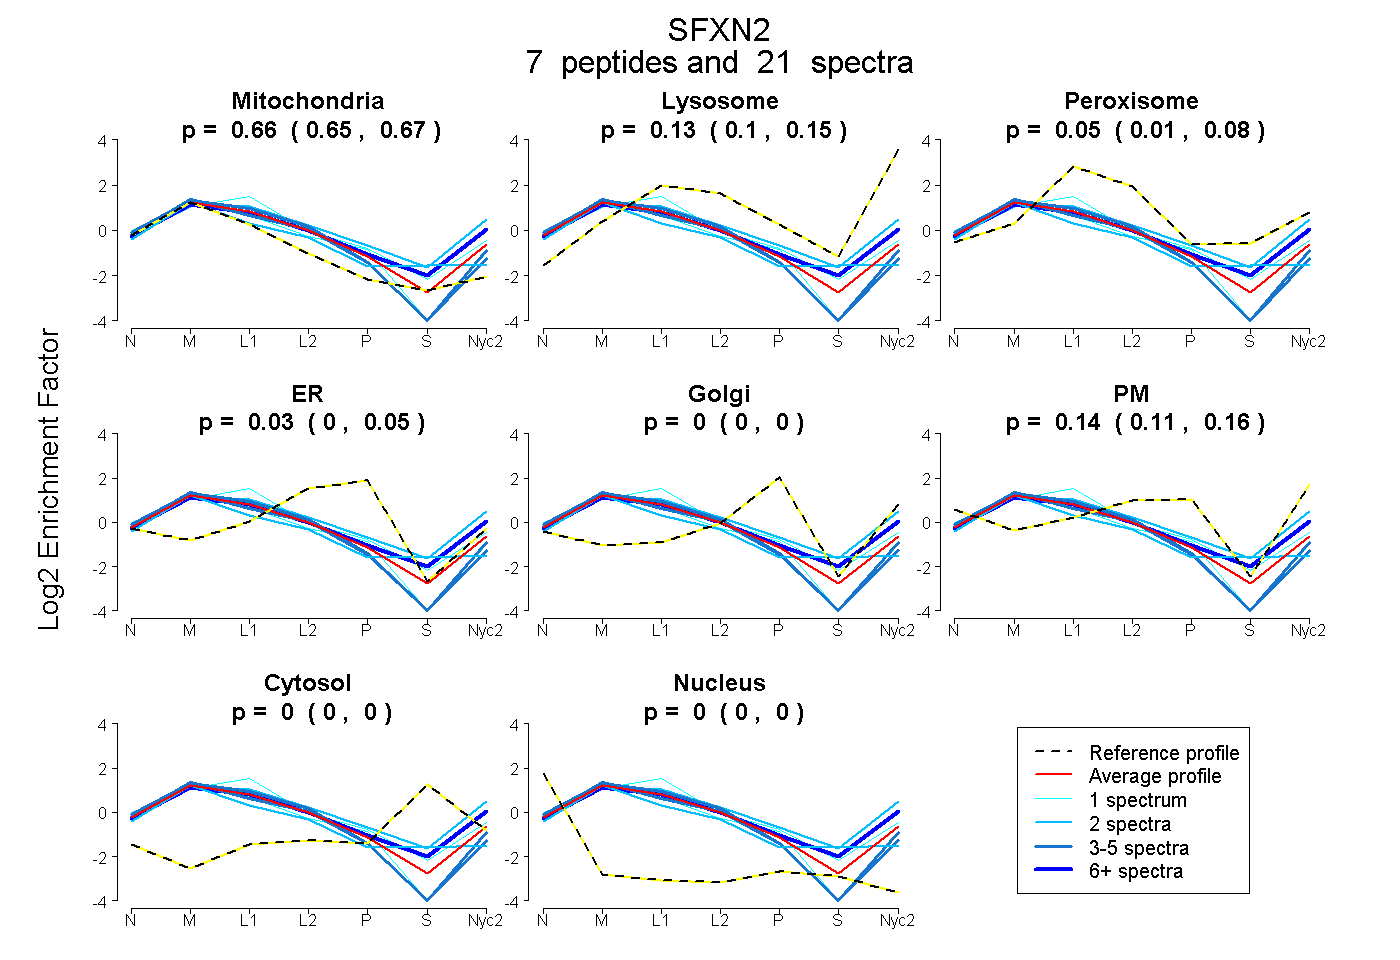
0.647 | 0.673
0.104 | 0.148
0.009 | 0.083
0.000 | 0.052
0.000 | 0.000
0.109 | 0.158
0.000 | 0.000
0.000 | 0.000
2peptides
spectra
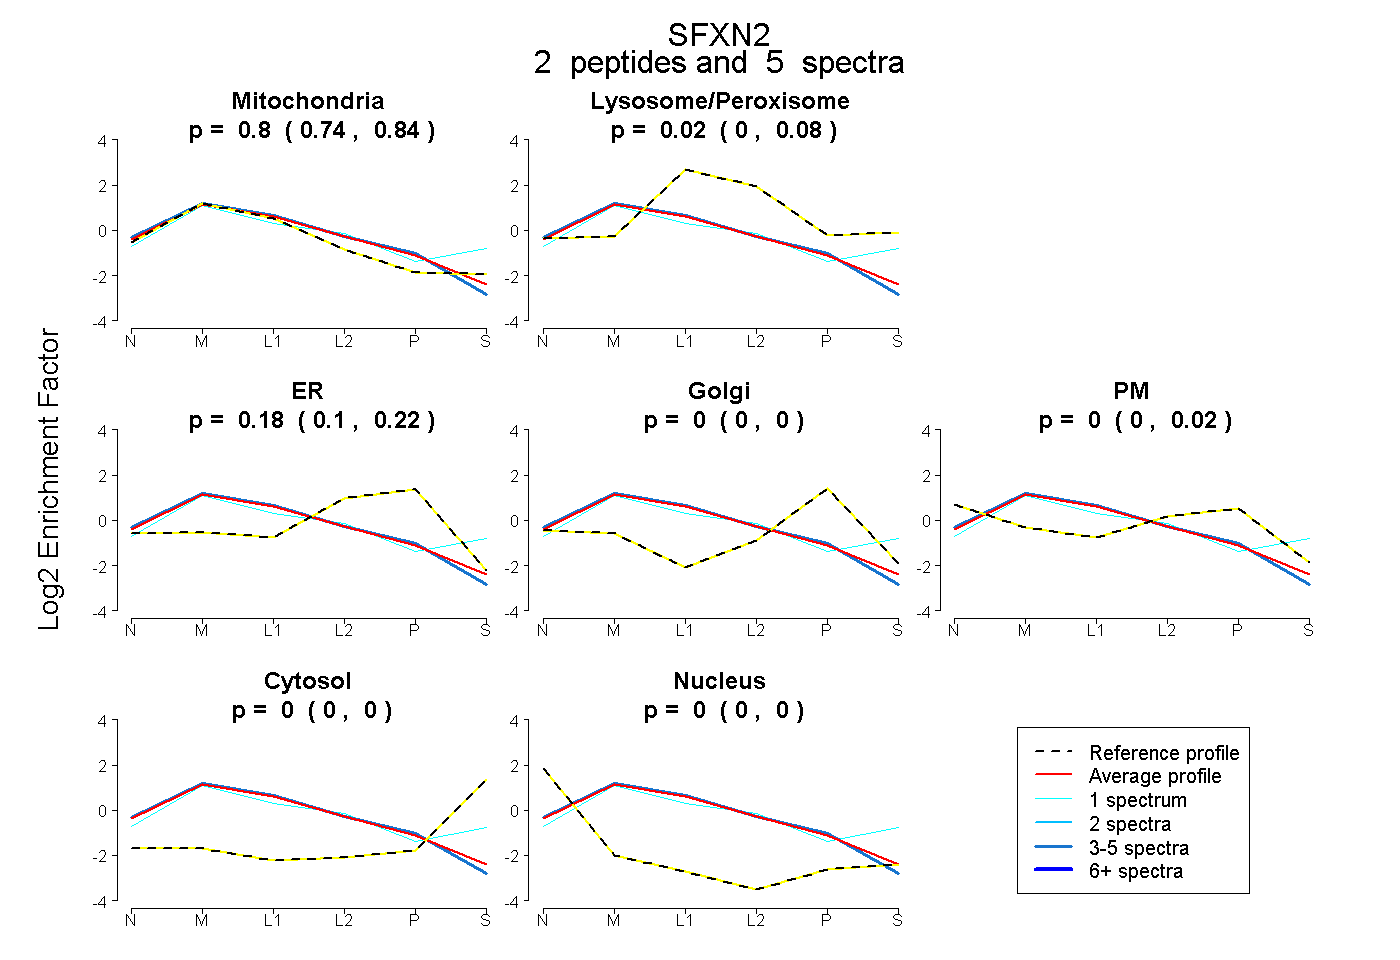
0.736 | 0.835
0.000 | 0.081
0.101 | 0.224
0.000 | 0.000
0.000 | 0.019
0.000 | 0.000
0.000 | 0.000
6peptides
spectra
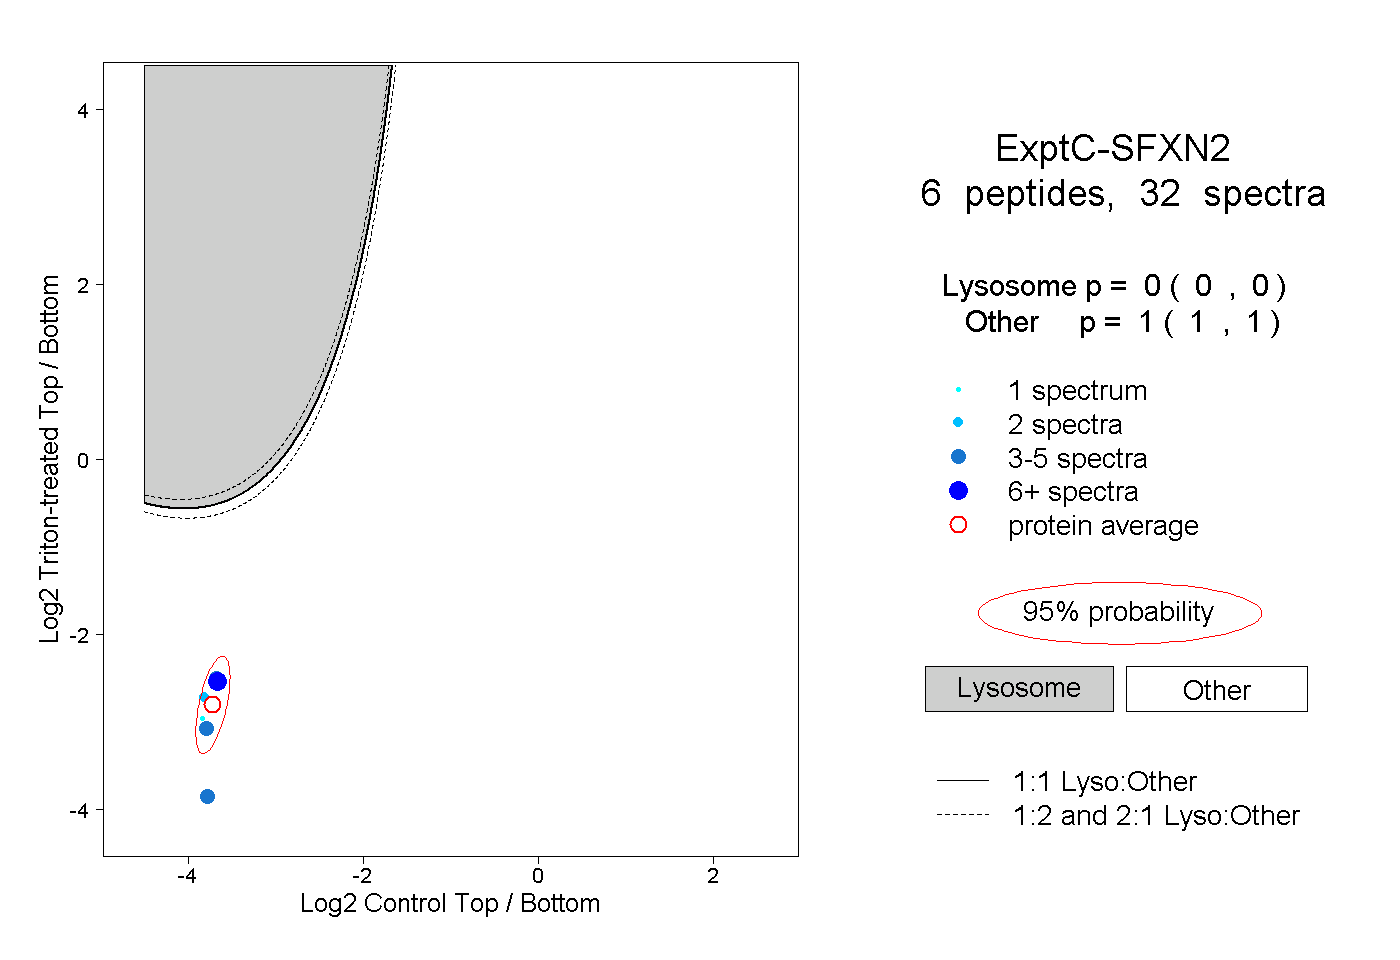
0.000 | 0.000
1.000 | 1.000
1peptide
spectrum
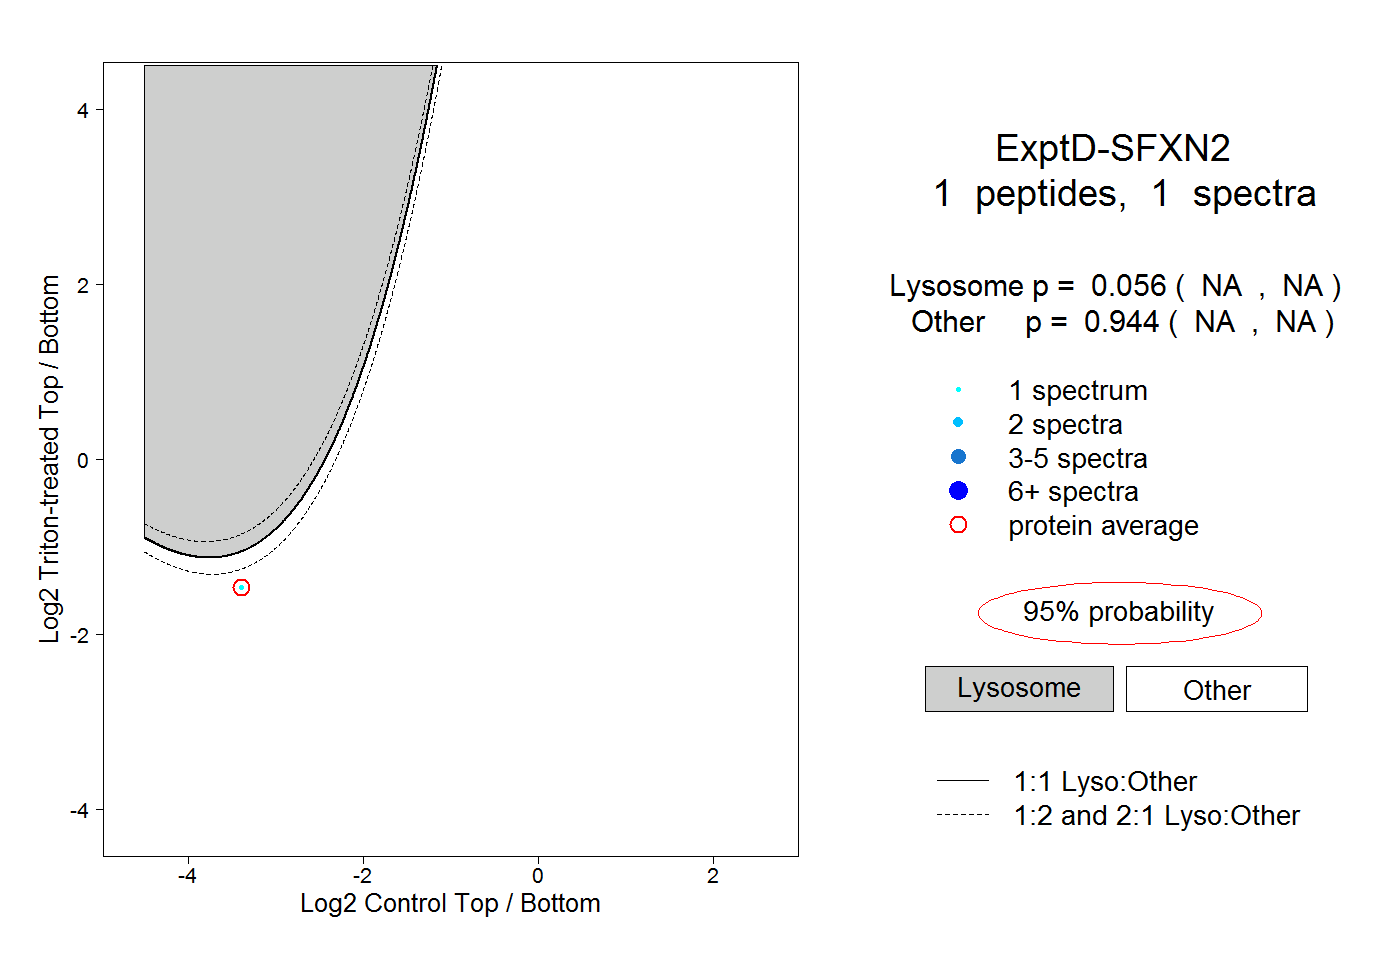
NA | NA
NA | NA