 7
7peptides
spectra
0.647 | 0.673
0.104 | 0.148
0.009 | 0.083
0.000 | 0.052
0.000 | 0.000
0.109 | 0.158
0.000 | 0.000
0.000 | 0.000
| Plot | Mito | Lyso | Perox | ER | Golgi | PM | Cytosol | Nucleus | |||||
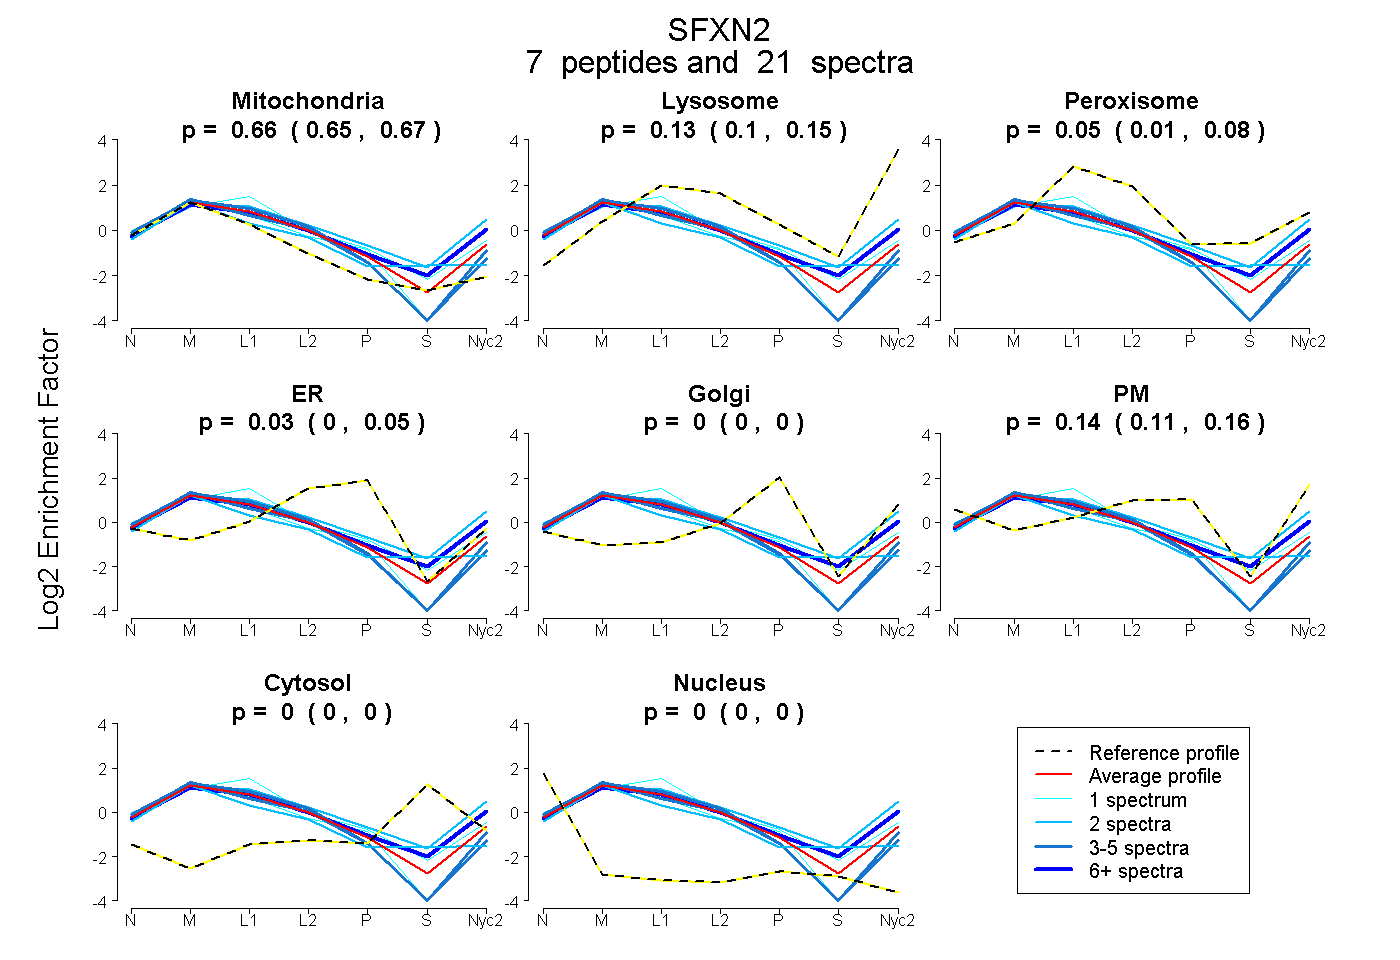
| Expt A |
7 peptides |
21 spectra |
|
0.661 0.647 | 0.673 |
0.128 0.104 | 0.148 |
0.048 0.009 | 0.083 |
0.025 0.000 | 0.052 |
0.000 0.000 | 0.000 |
0.137 0.109 | 0.158 |
0.000 0.000 | 0.000 |
0.000 0.000 | 0.000 |
| 2 spectra, WDQCTFLGR | 0.716 | 0.000 | 0.181 | 0.016 | 0.000 | 0.000 | 0.087 | 0.000 | ||
| 2 spectra, MGLMPPGTQVEQLLYAK | 0.448 | 0.279 | 0.130 | 0.000 | 0.000 | 0.143 | 0.000 | 0.000 | ||
| 1 spectrum, LYDSAFHPDTGEK | 0.511 | 0.009 | 0.308 | 0.000 | 0.000 | 0.173 | 0.000 | 0.000 | ||
| 3 spectra, TVFVSEQELDWAK | 0.753 | 0.034 | 0.000 | 0.131 | 0.000 | 0.083 | 0.000 | 0.000 | ||
| 4 spectra, NAVSPTSVR | 0.736 | 0.025 | 0.000 | 0.018 | 0.000 | 0.221 | 0.000 | 0.000 | ||
| 8 spectra, MNVIGR | 0.582 | 0.268 | 0.040 | 0.000 | 0.000 | 0.111 | 0.000 | 0.000 | ||
| 1 spectrum, HFFNITDPR | 0.693 | 0.000 | 0.000 | 0.115 | 0.000 | 0.192 | 0.000 | 0.000 |
| Plot | Mito | Lyso or Perox | ER | Golgi | PM | Cytosol | Nucleus | ||||||
| Expt B |
2 peptides |
5 spectra |
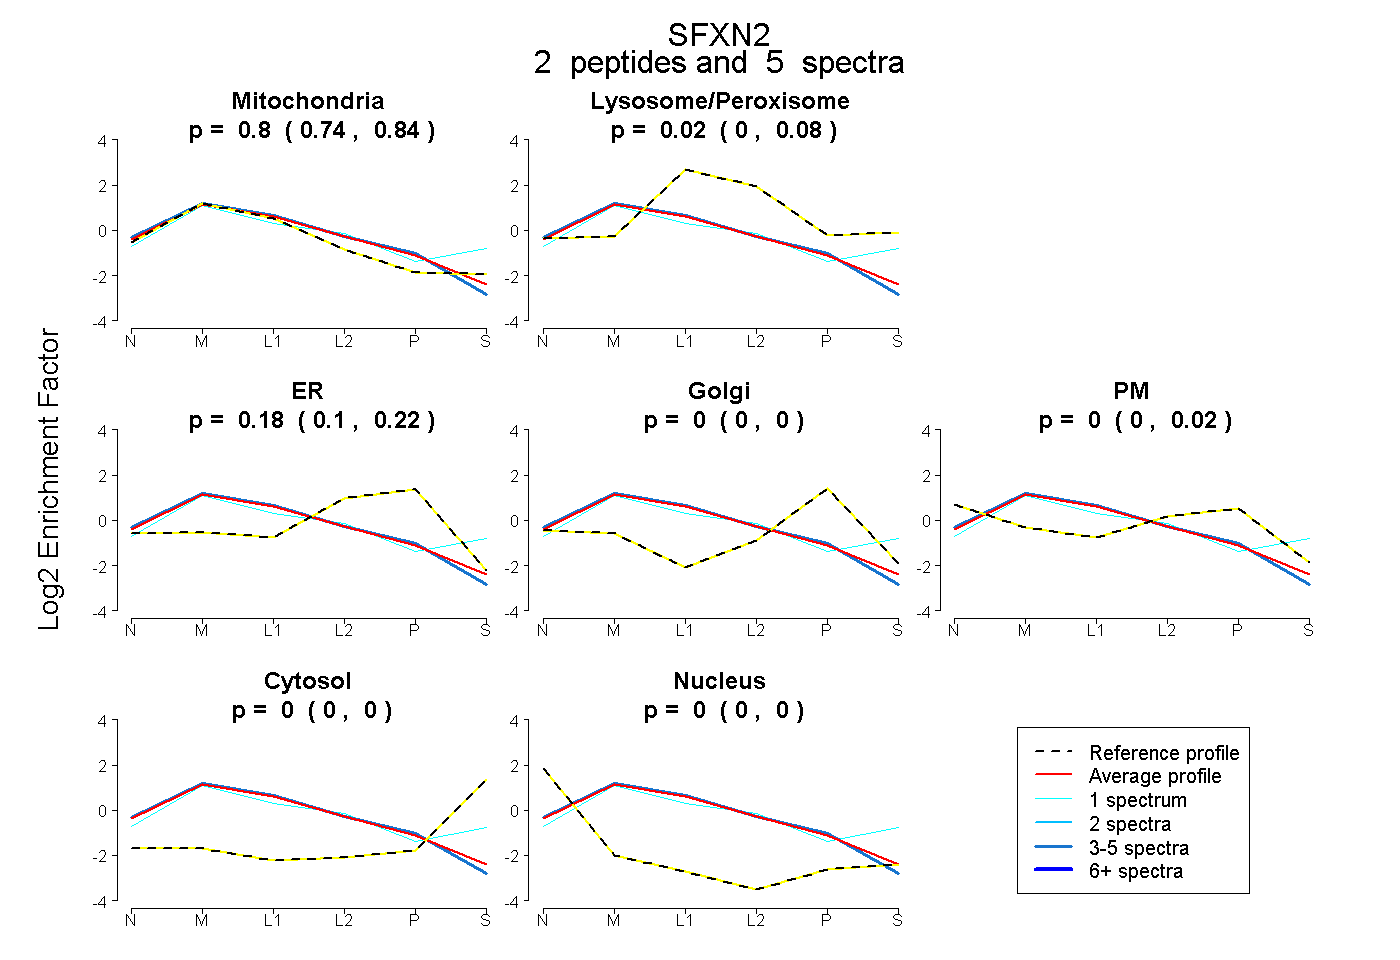 |
0.796 0.736 | 0.835 |
0.021 0.000 | 0.081 |
0.183 0.101 | 0.224 |
0.000 0.000 | 0.000 |
0.000 0.000 | 0.019 |
0.000 0.000 | 0.000 |
0.000 0.000 | 0.000 |
|||
| Plot | Lyso | Other | |||||||||||
| Expt C |
6 peptides |
32 spectra |
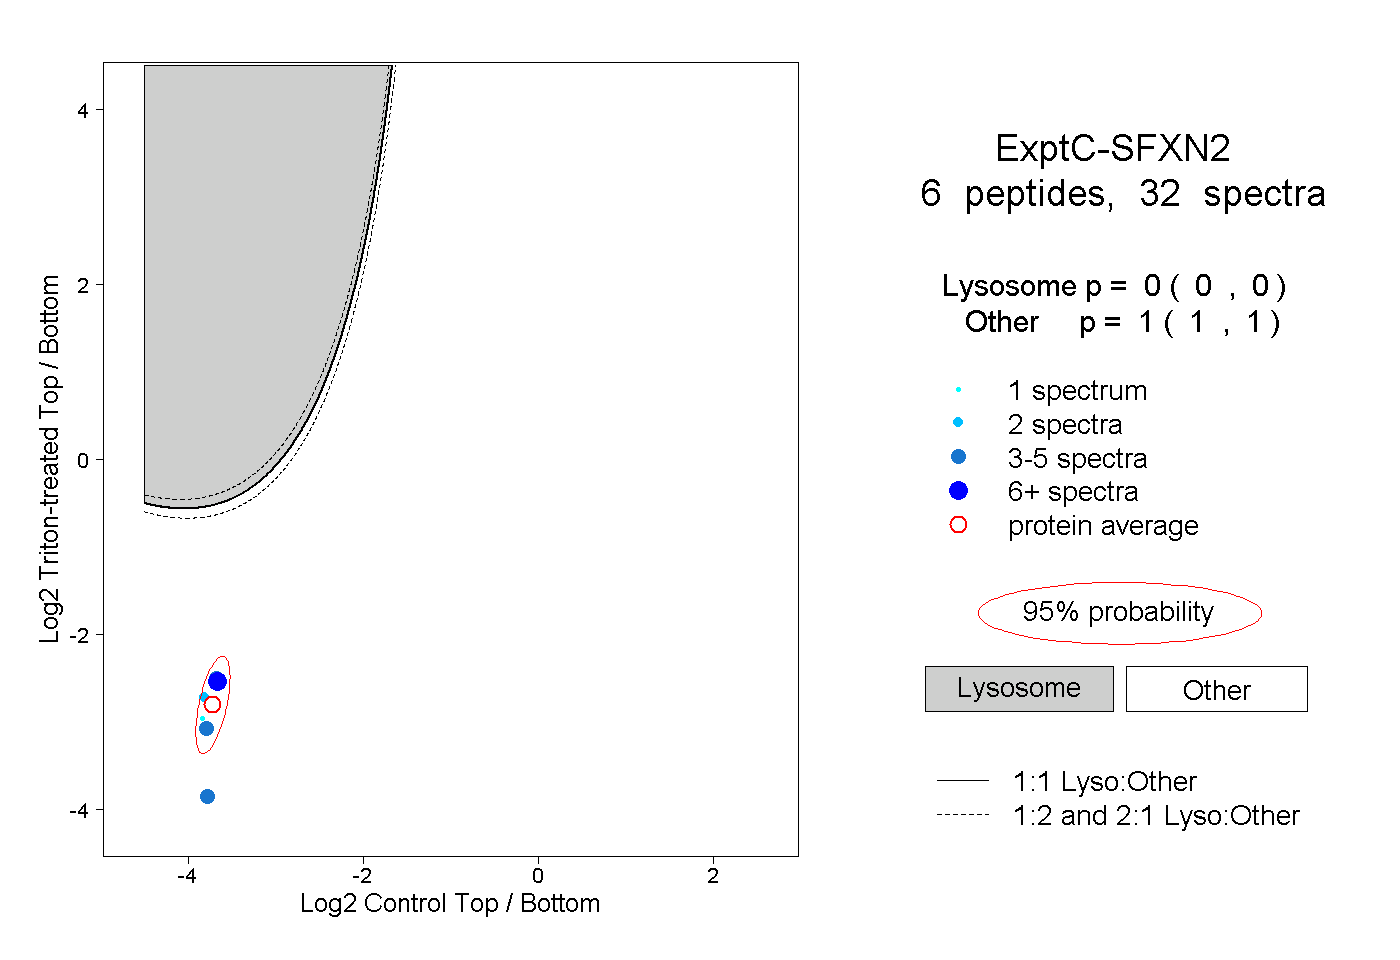 |
0.000 0.000 | 0.000 |
1.000 1.000 | 1.000 |
||||||||
| Plot | Lyso | Other | |||||||||||
| Expt D |
1 peptide |
1 spectrum |
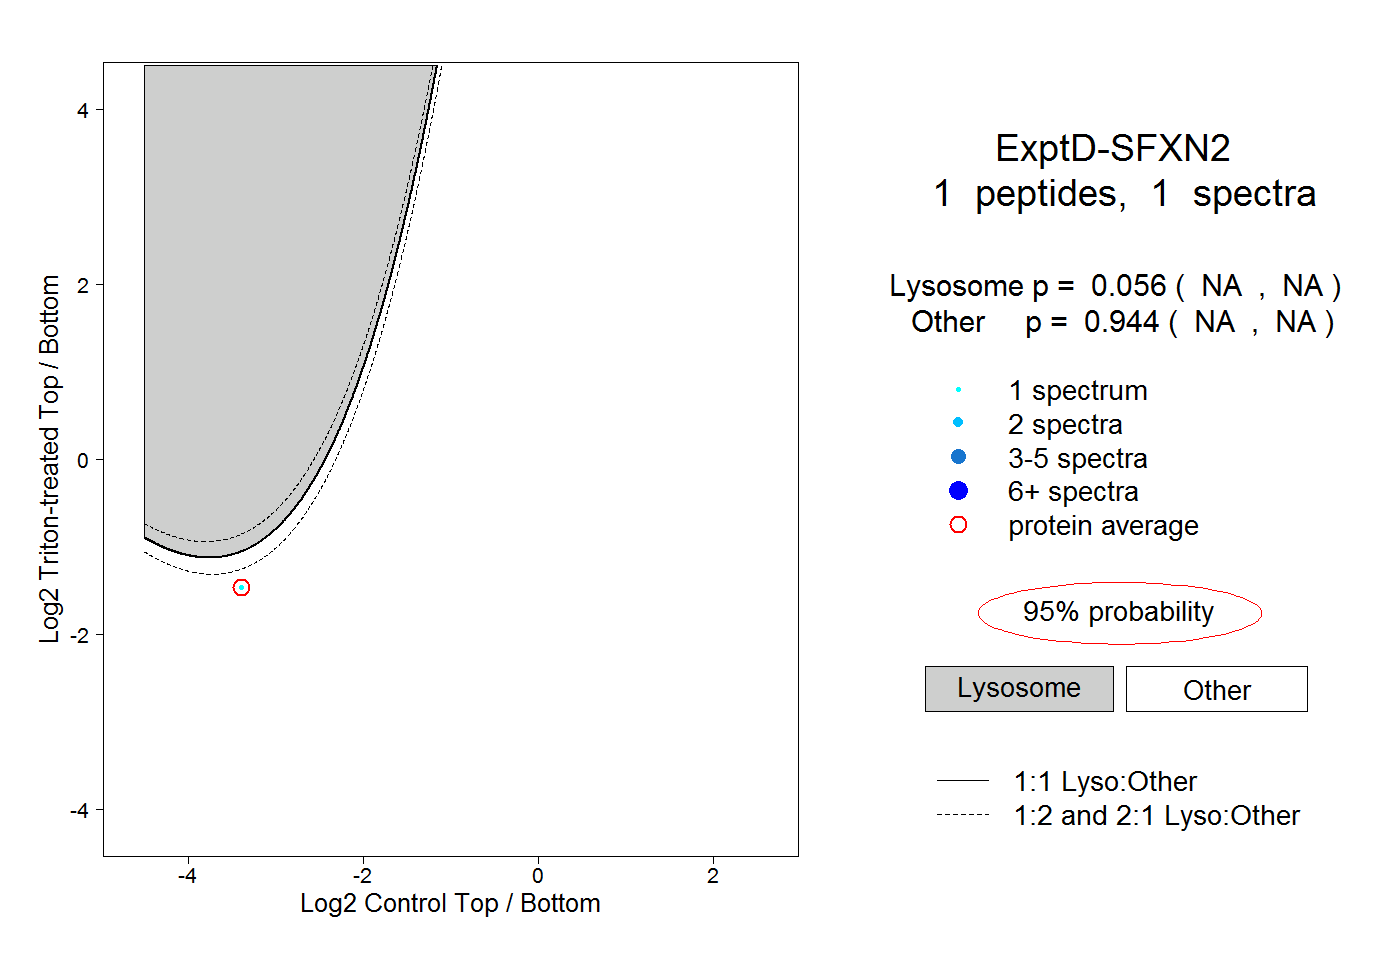 |
0.056 NA | NA |
0.944 NA | NA |