 6
6peptides
spectra
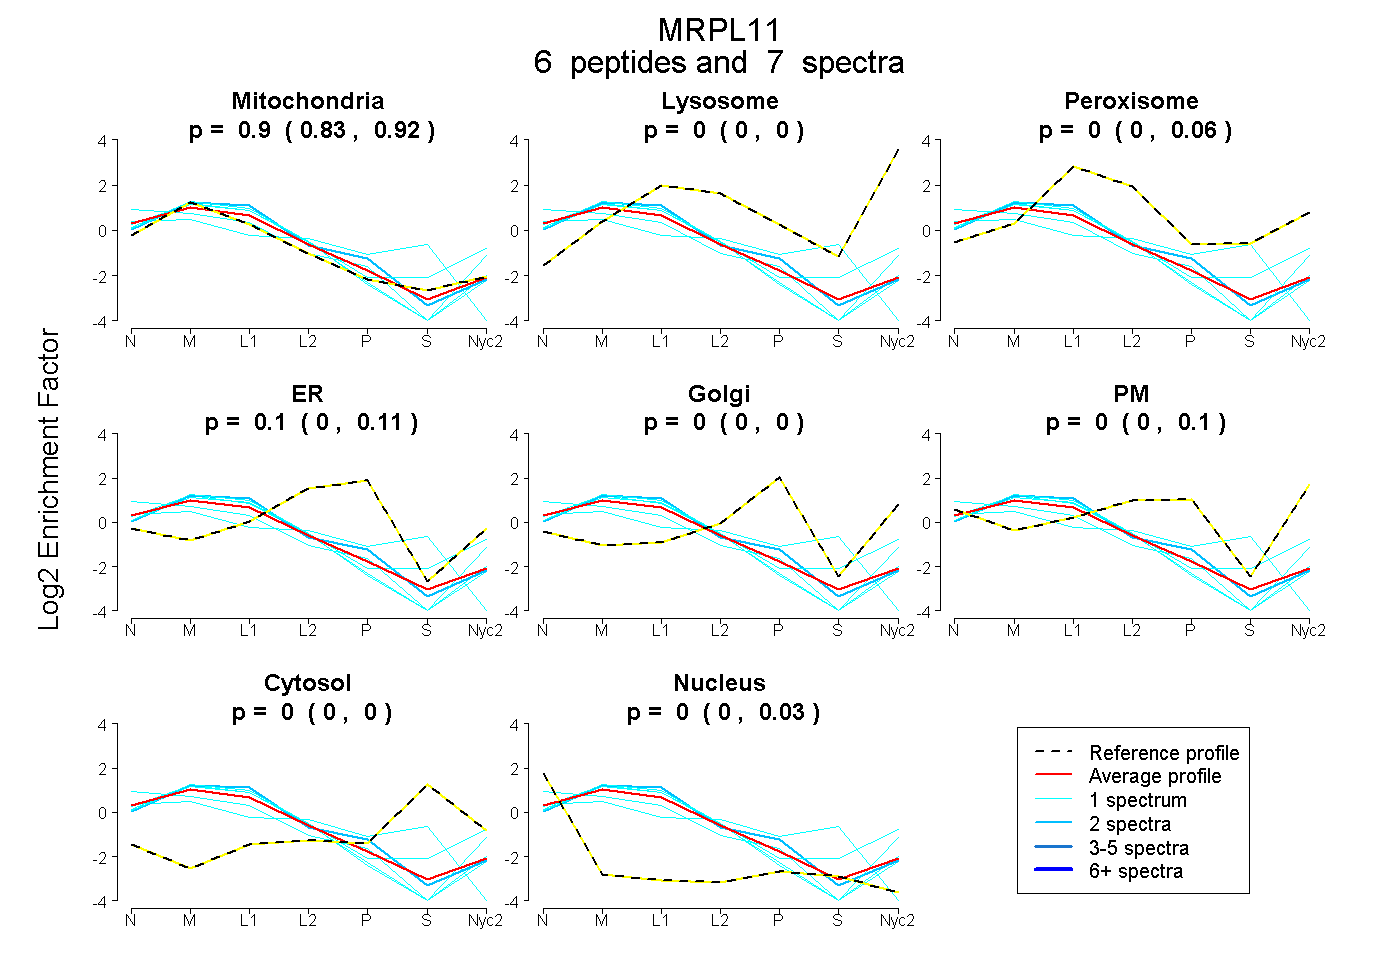
0.835 | 0.916
0.000 | 0.000
0.000 | 0.063
0.000 | 0.113
0.000 | 0.000
0.000 | 0.101
0.000 | 0.000
0.000 | 0.028
4peptides
spectra
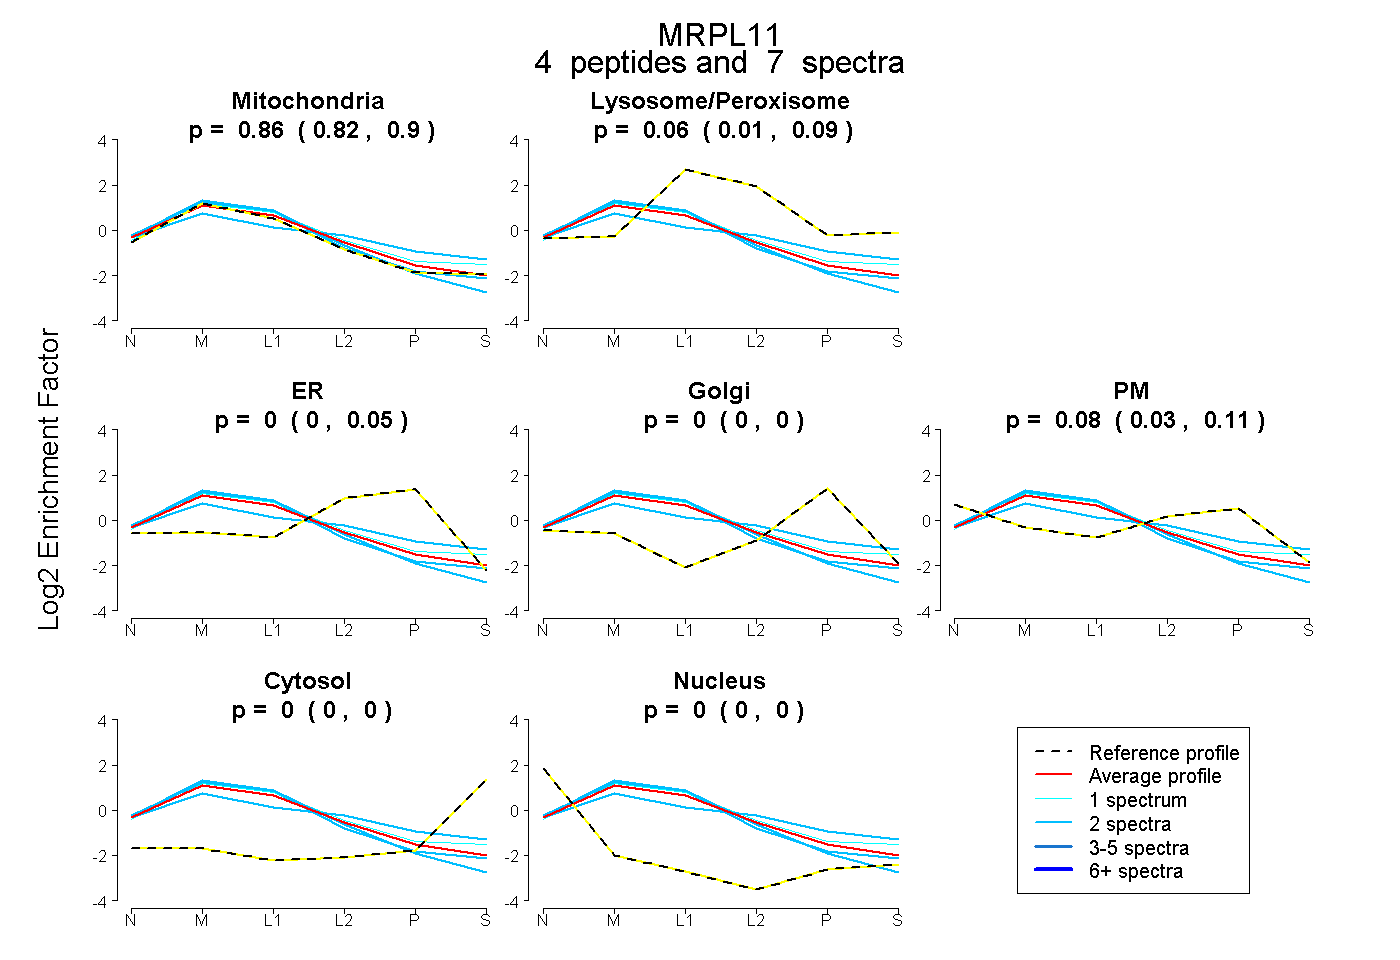
0.818 | 0.901
0.013 | 0.090
0.000 | 0.046
0.000 | 0.000
0.025 | 0.108
0.000 | 0.000
0.000 | 0.000
11peptides
spectra
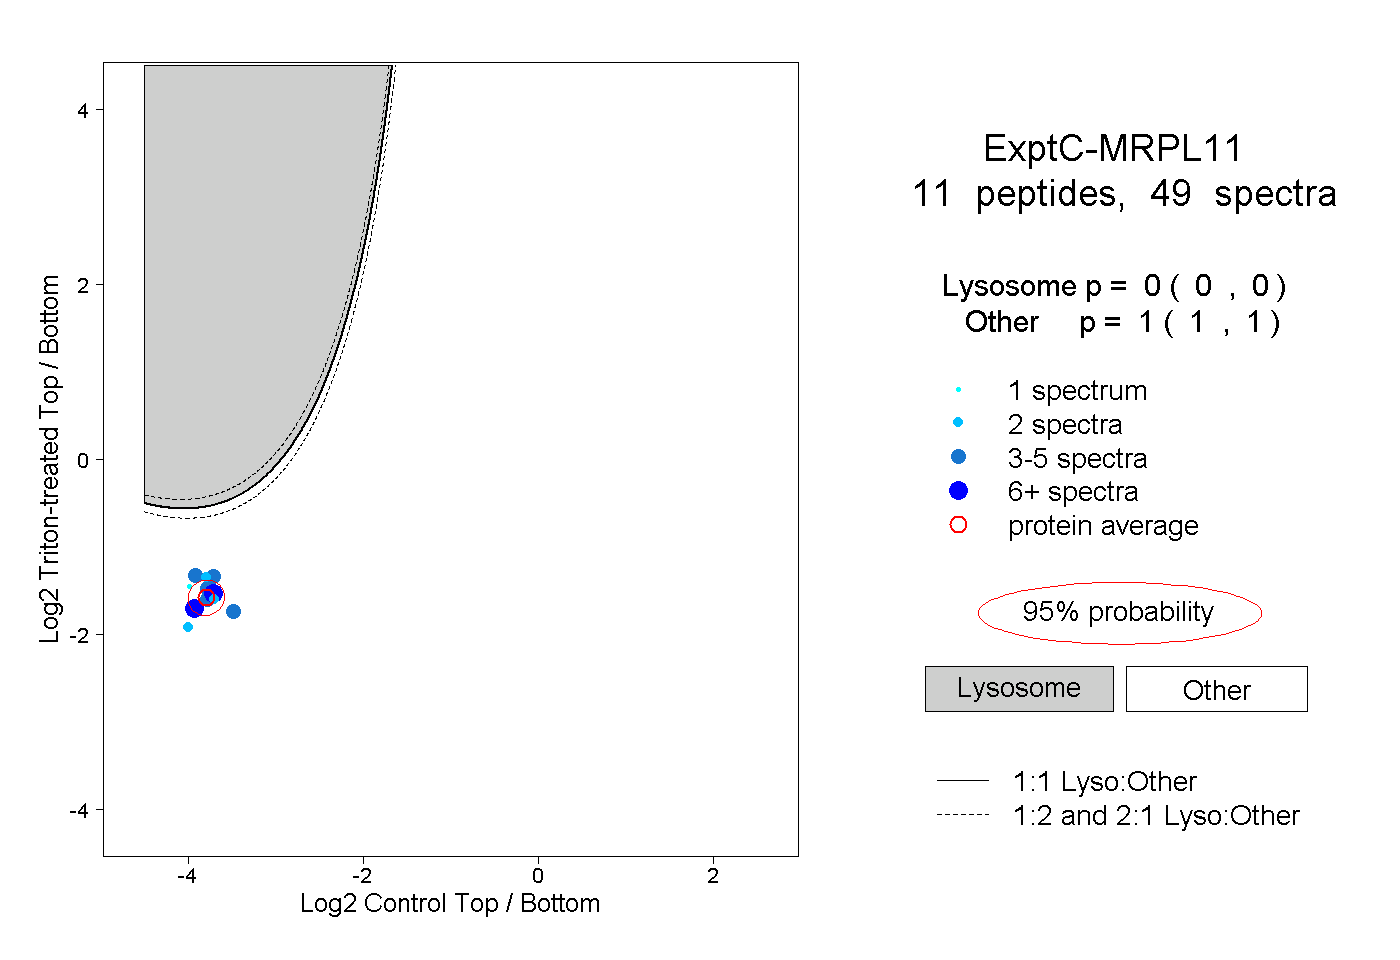
0.000 | 0.000
1.000 | 1.000
4peptides
spectra
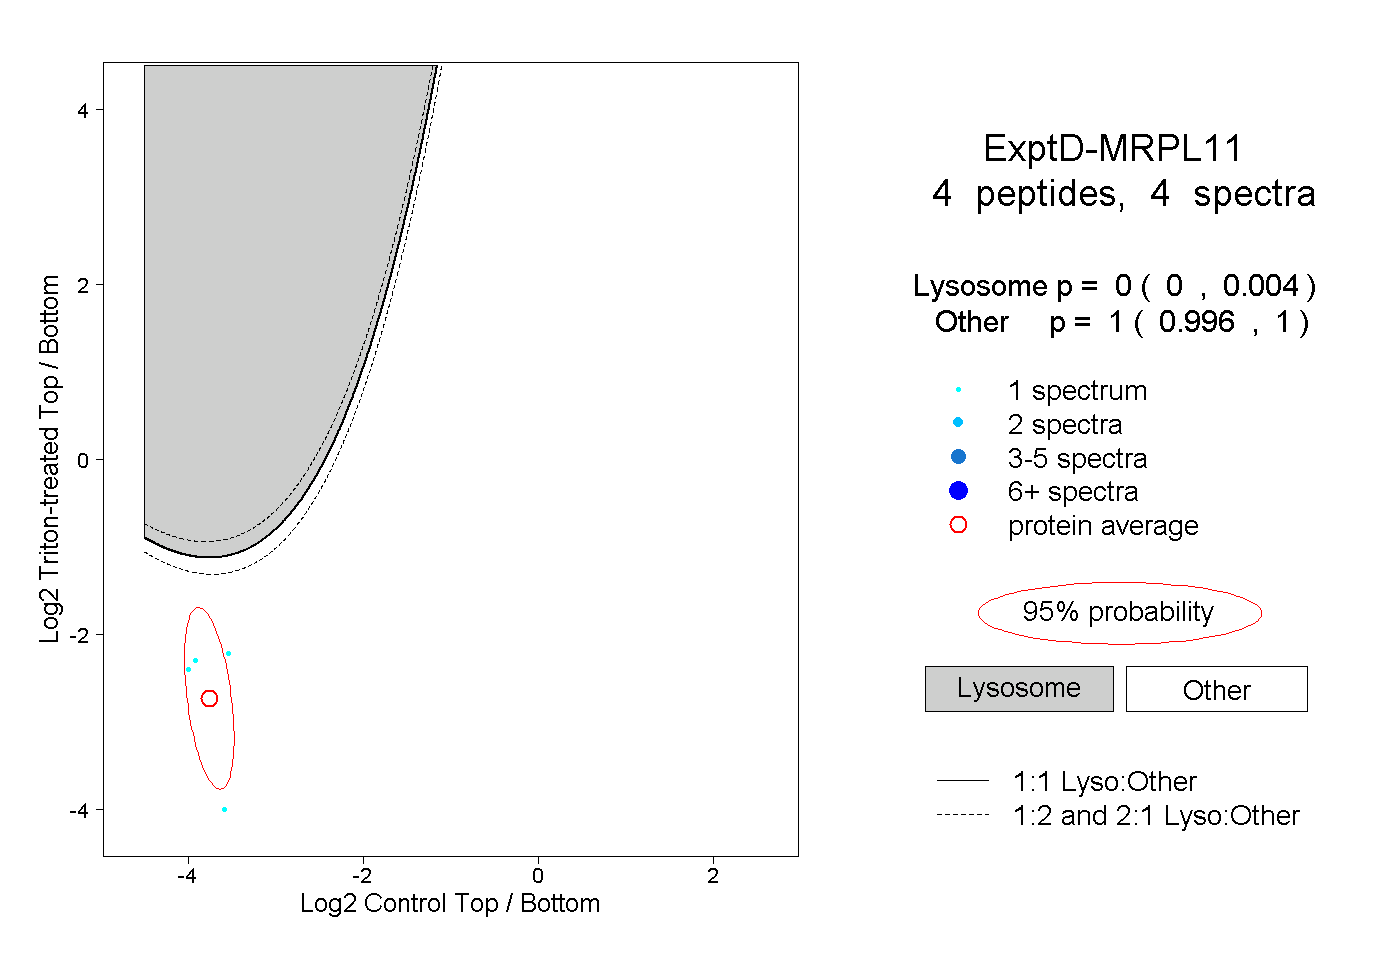
0.000 | 0.004
0.996 | 1.000