 6
6peptides
spectra
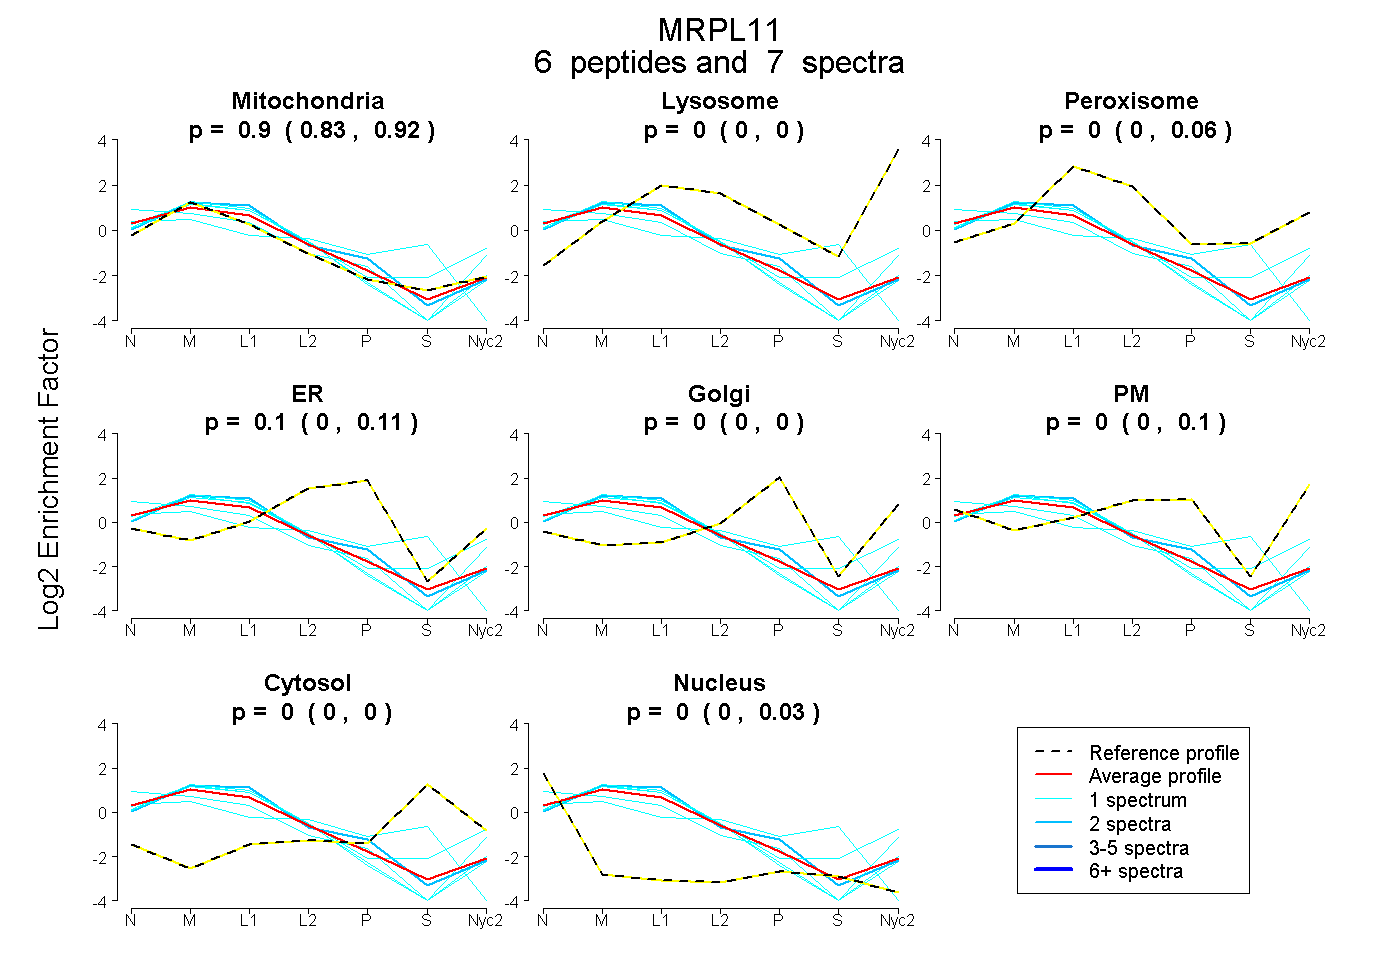
0.835 | 0.916
0.000 | 0.000
0.000 | 0.063
0.000 | 0.113
0.000 | 0.000
0.000 | 0.101
0.000 | 0.000
0.000 | 0.028
| Plot | Mito | Lyso | Perox | ER | Golgi | PM | Cytosol | Nucleus | |||||
| Expt A |
6 peptides |
7 spectra |
|
0.899 0.835 | 0.916 |
0.000 0.000 | 0.000 |
0.000 0.000 | 0.063 |
0.101 0.000 | 0.113 |
0.000 0.000 | 0.000 |
0.000 0.000 | 0.101 |
0.000 0.000 | 0.000 |
0.000 0.000 | 0.028 |
| 1 spectrum, AGQAIPGPPLGPILGQR | 0.986 | 0.000 | 0.000 | 0.014 | 0.000 | 0.000 | 0.000 | 0.000 | ||
| 1 spectrum, SIIGSAR | 0.745 | 0.089 | 0.158 | 0.000 | 0.000 | 0.000 | 0.000 | 0.008 | ||
| 2 spectra, GVSINQFCK | 0.858 | 0.000 | 0.000 | 0.142 | 0.000 | 0.000 | 0.000 | 0.000 | ||
| 1 spectrum, DLSVDELAAFQK | 0.651 | 0.000 | 0.000 | 0.068 | 0.000 | 0.000 | 0.188 | 0.093 | ||
| 1 spectrum, AVFLAAQK | 0.756 | 0.000 | 0.000 | 0.006 | 0.000 | 0.119 | 0.000 | 0.119 | ||
| 1 spectrum, IGQPTISYFLK | 0.885 | 0.043 | 0.000 | 0.000 | 0.000 | 0.072 | 0.000 | 0.000 |
| Plot | Mito | Lyso or Perox | ER | Golgi | PM | Cytosol | Nucleus | ||||||
| Expt B |
4 peptides |
7 spectra |
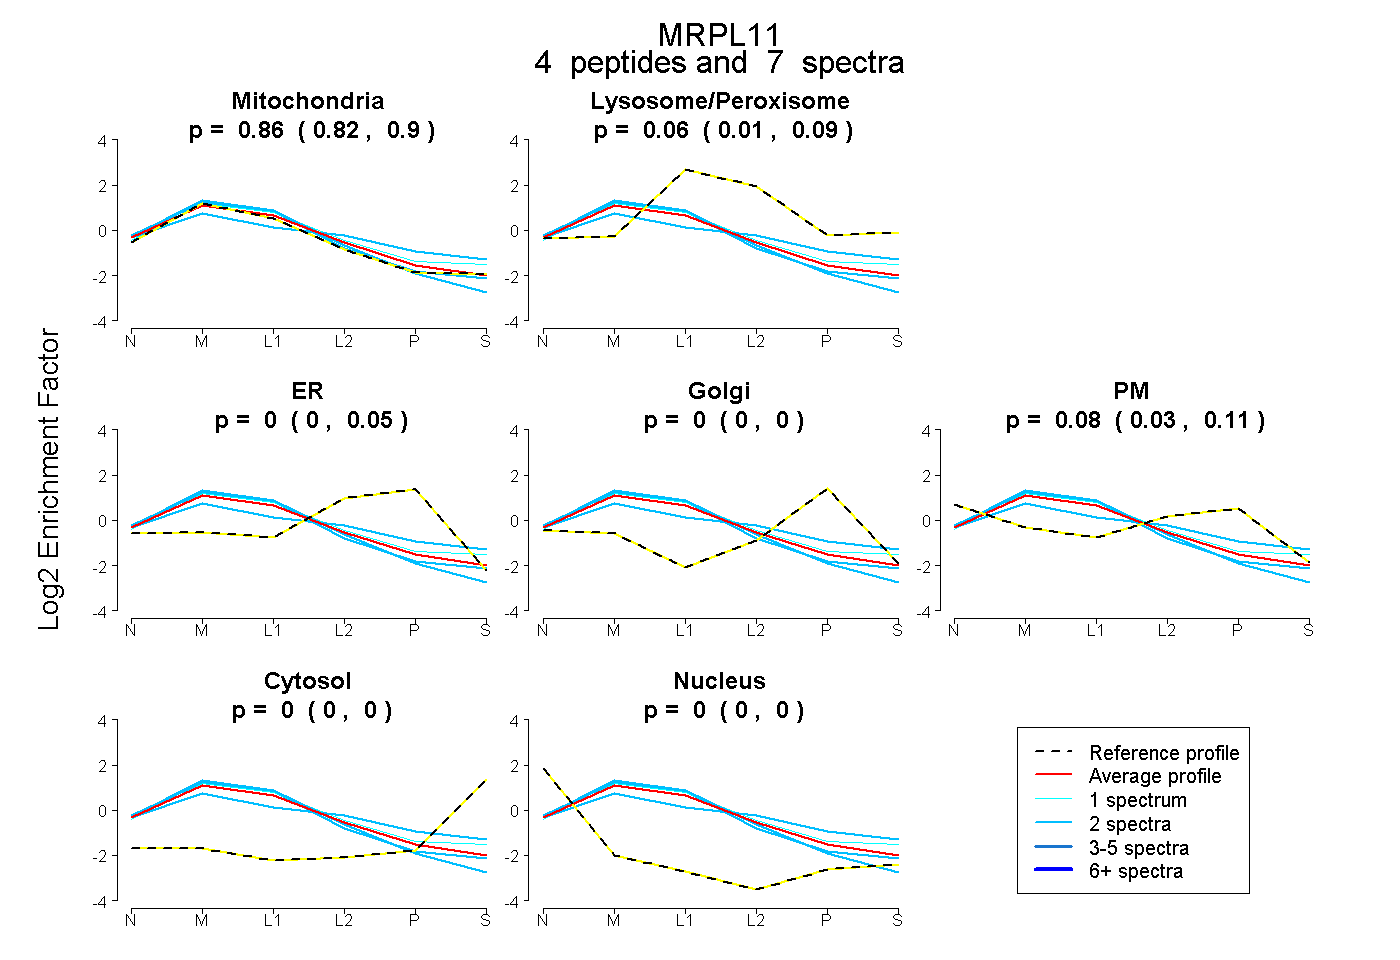 |
0.863 0.818 | 0.901 |
0.056 0.013 | 0.090 |
0.000 0.000 | 0.046 |
0.000 0.000 | 0.000 |
0.081 0.025 | 0.108 |
0.000 0.000 | 0.000 |
0.000 0.000 | 0.000 |
|||
| Plot | Lyso | Other | |||||||||||
| Expt C |
11 peptides |
49 spectra |
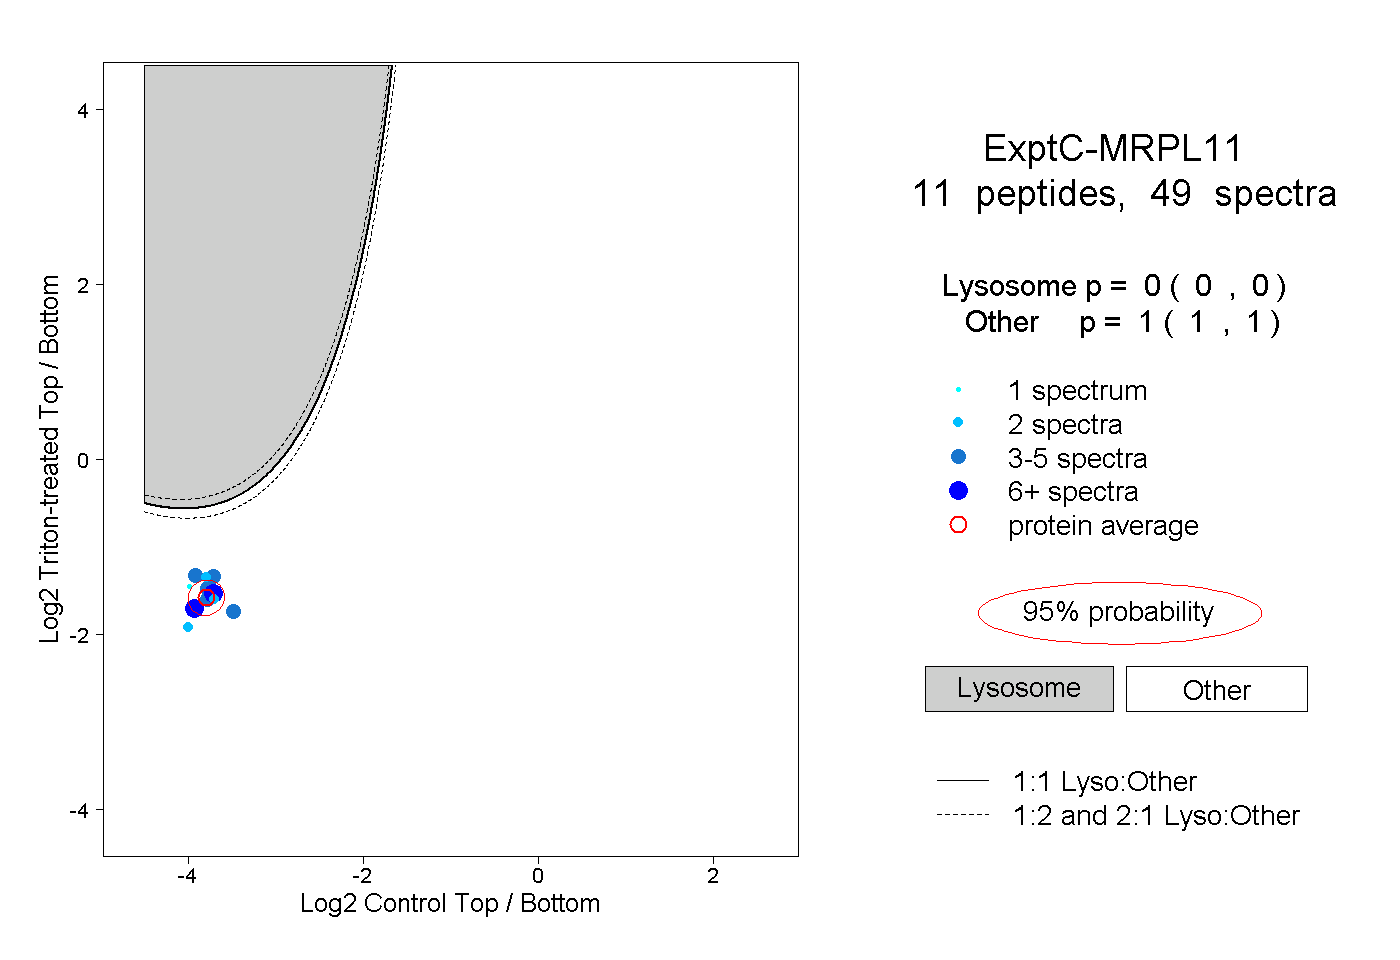 |
0.000 0.000 | 0.000 |
1.000 1.000 | 1.000 |
||||||||
| Plot | Lyso | Other | |||||||||||
| Expt D |
4 peptides |
4 spectra |
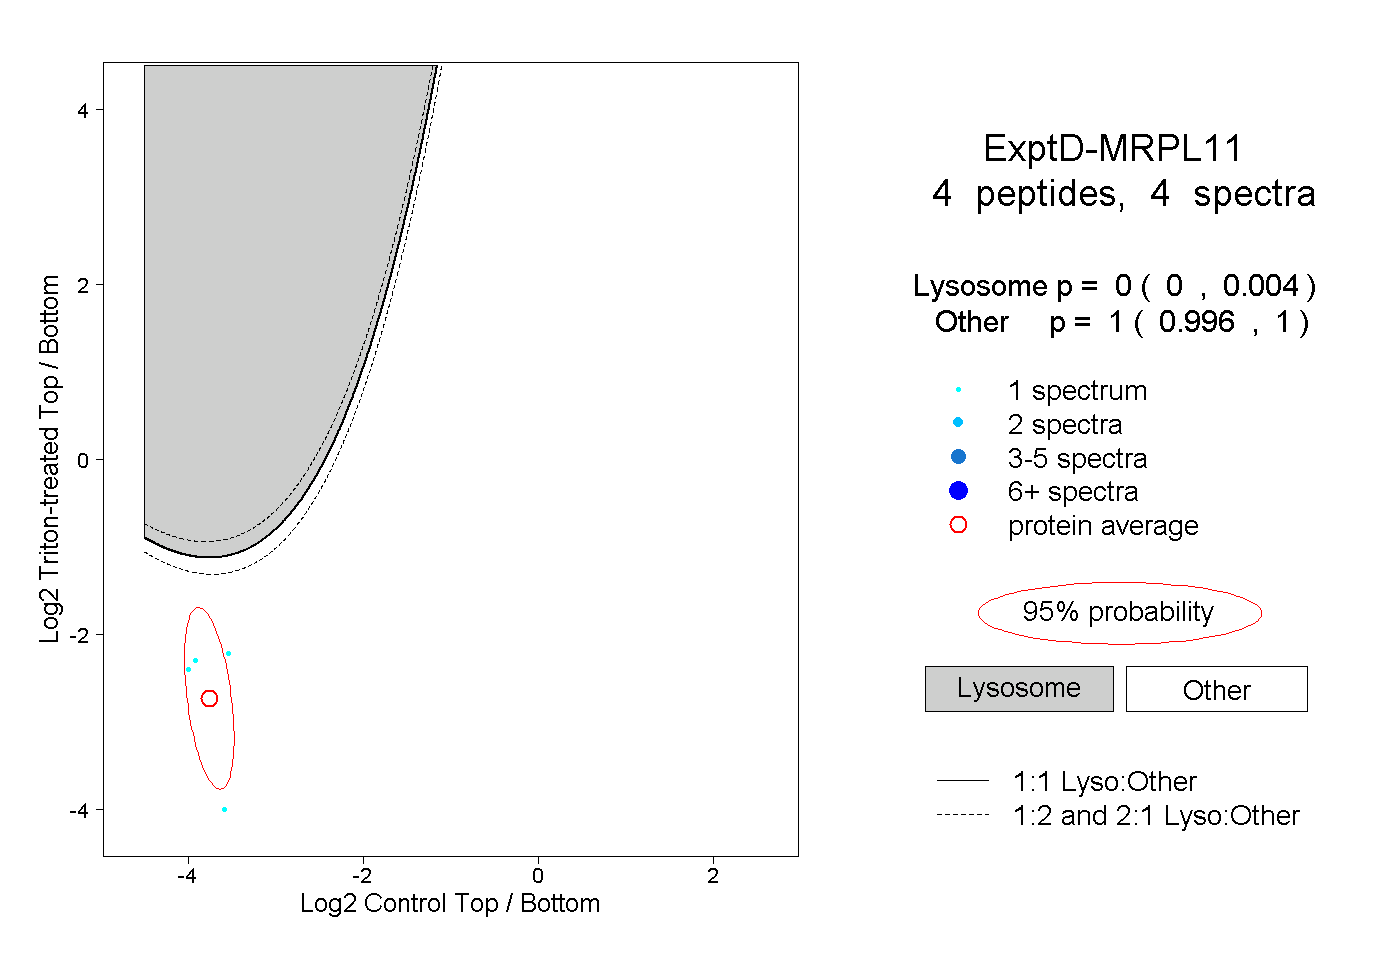 |
0.000 0.000 | 0.004 |
1.000 0.996 | 1.000 |