 8
8peptides
spectra
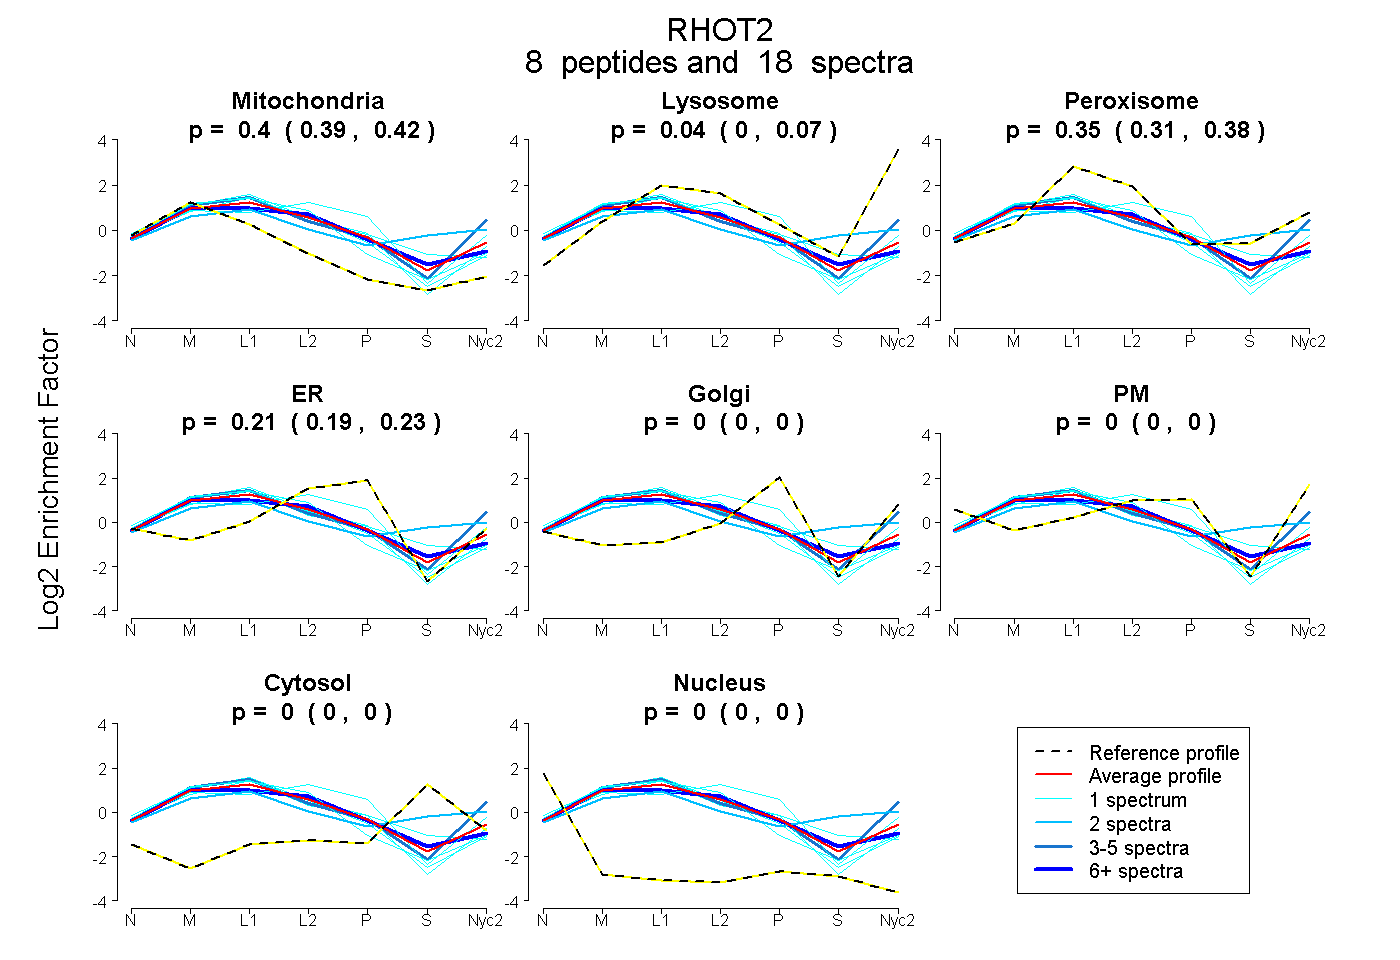
0.386 | 0.416
0.005 | 0.067
0.308 | 0.378
0.189 | 0.226
0.000 | 0.000
0.000 | 0.000
0.000 | 0.000
0.000 | 0.000
3peptides
spectra
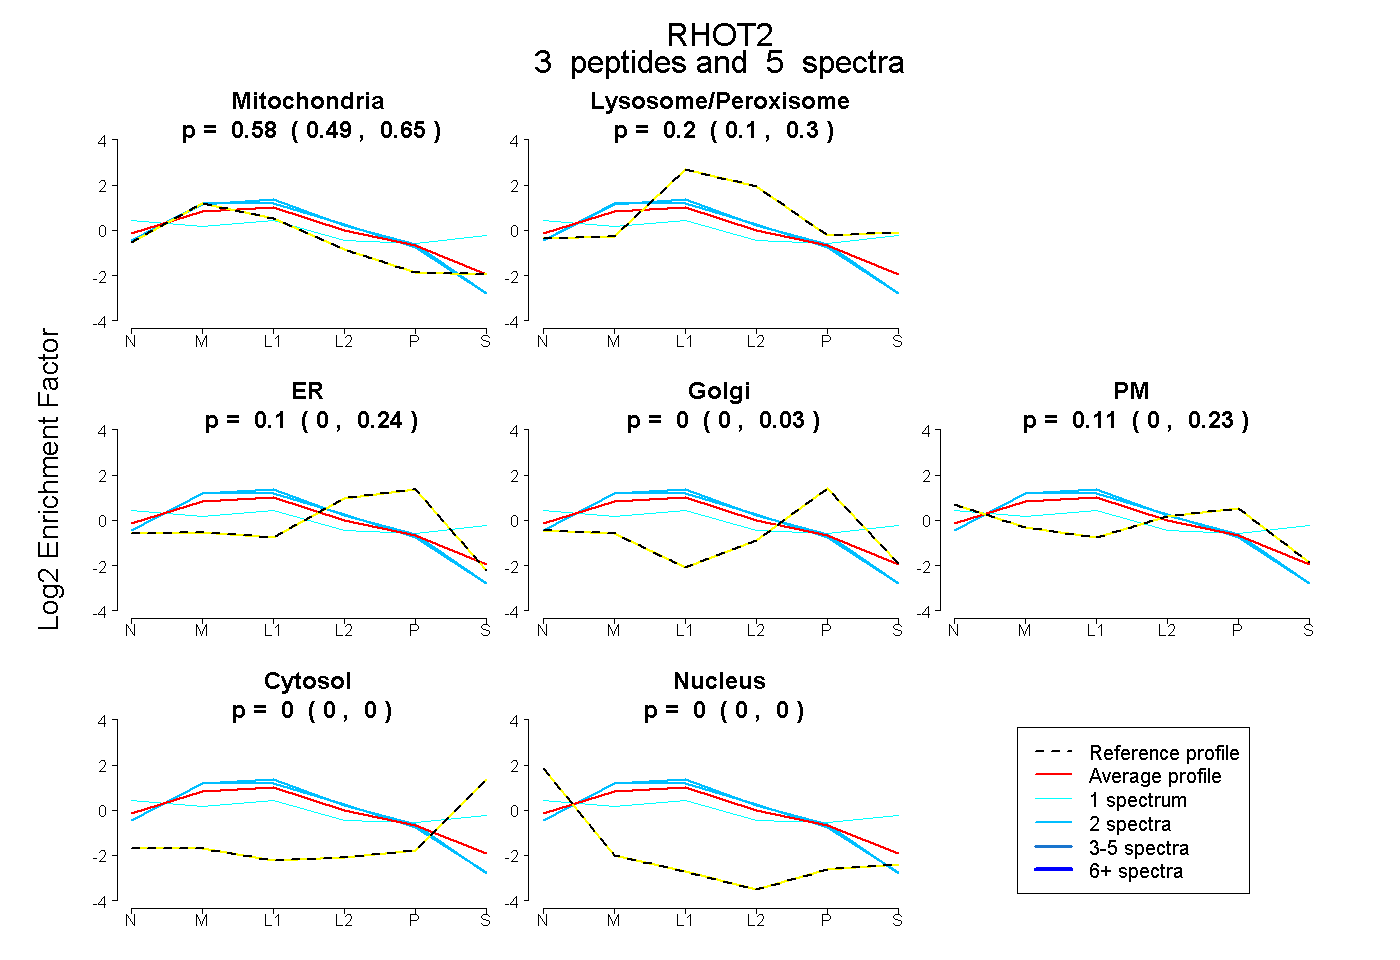
0.494 | 0.647
0.095 | 0.299
0.000 | 0.237
0.000 | 0.035
0.000 | 0.235
0.000 | 0.000
0.000 | 0.000
11peptides
spectra
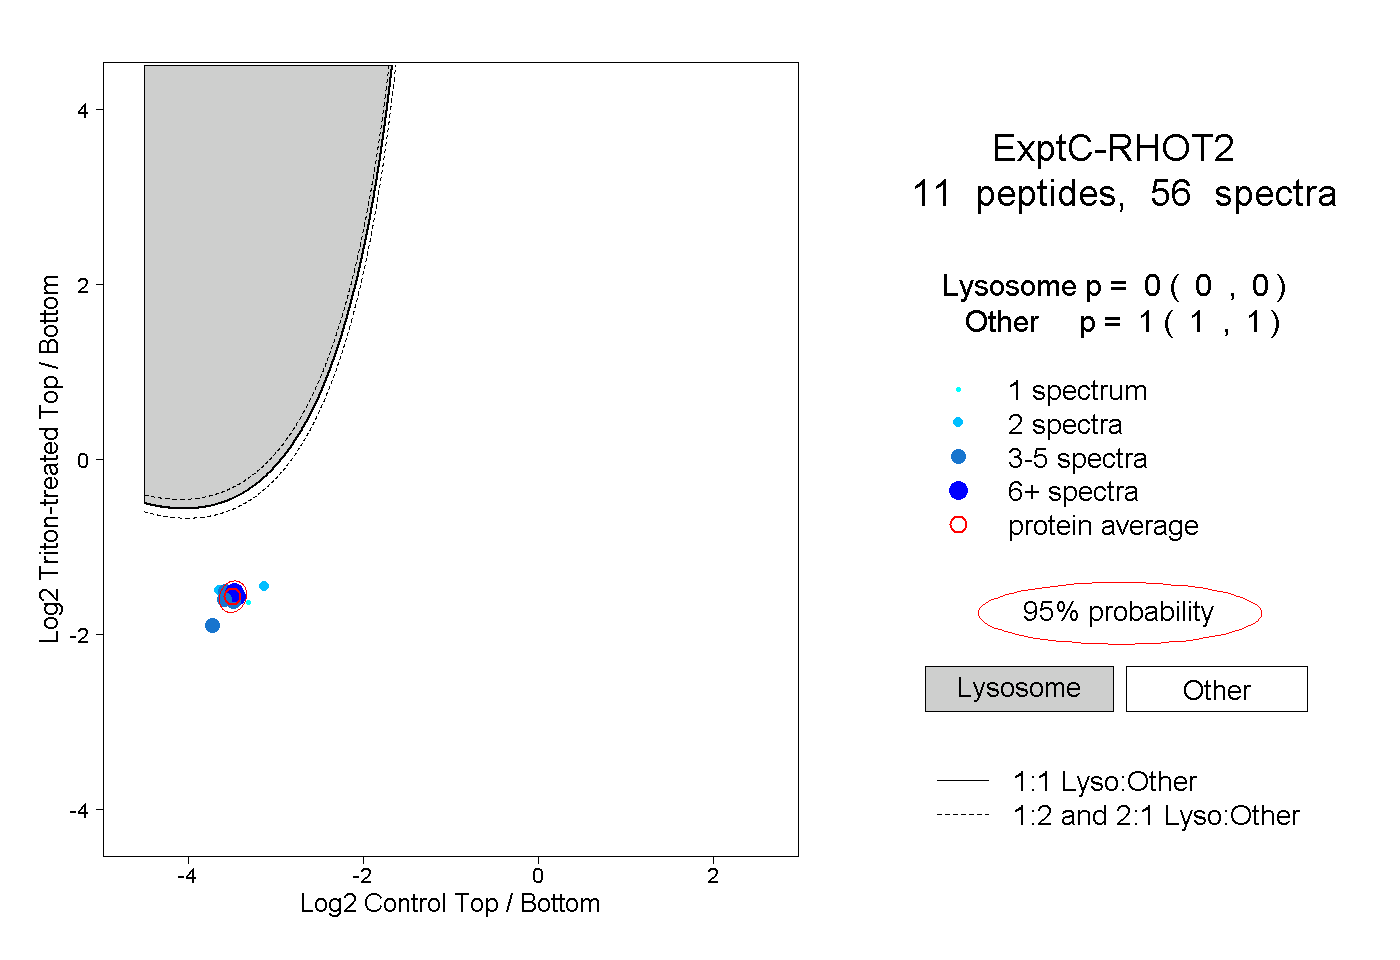
0.000 | 0.000
1.000 | 1.000
3peptides
spectra
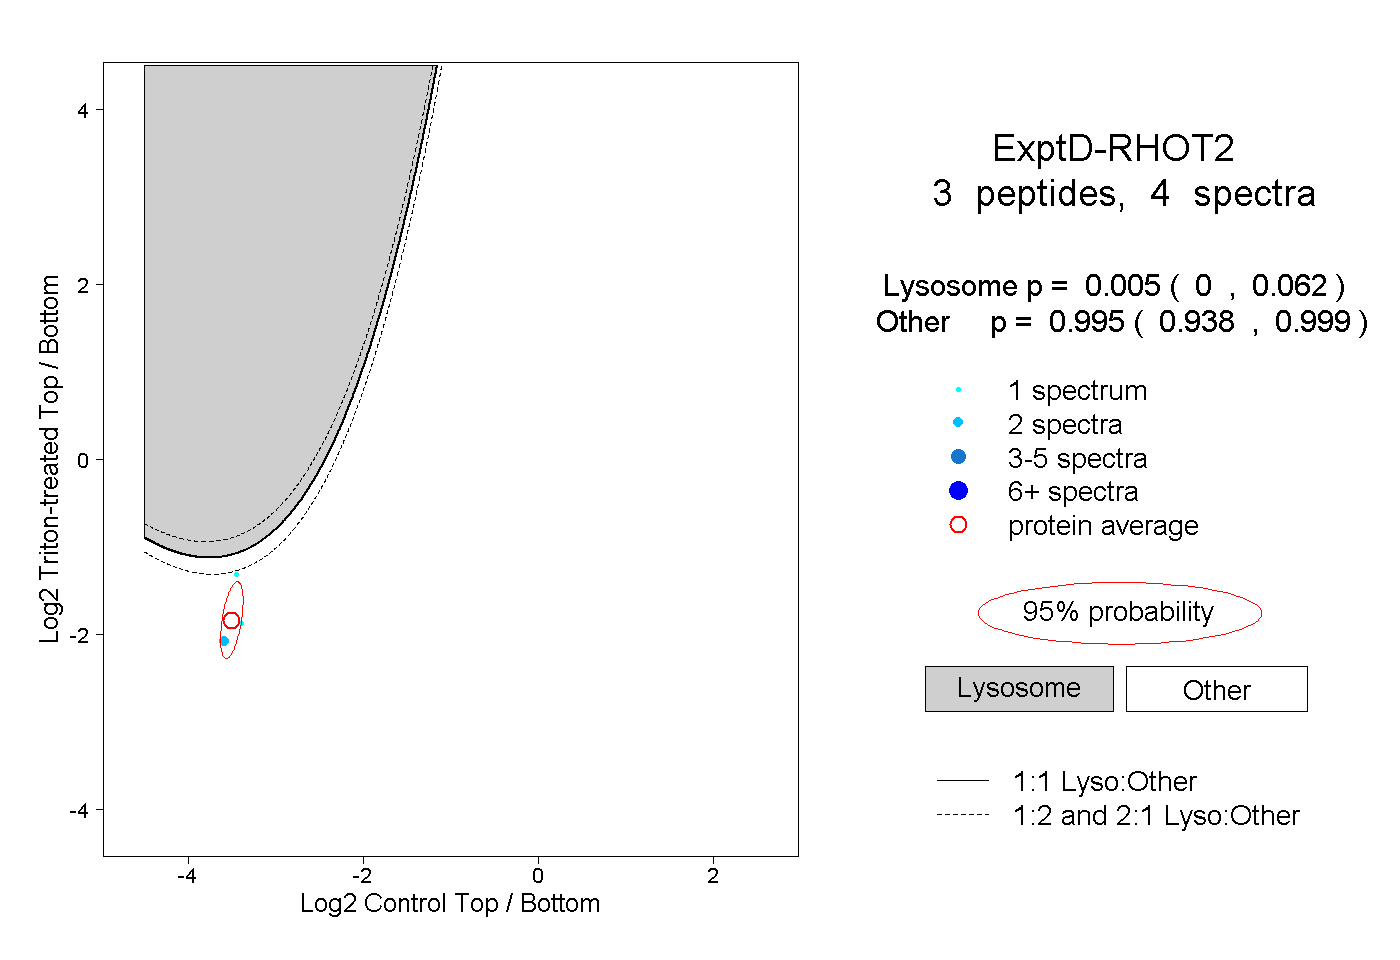
0.000 | 0.062
0.938 | 0.999