 8
8peptides
spectra
0.386 | 0.416
0.005 | 0.067
0.308 | 0.378
0.189 | 0.226
0.000 | 0.000
0.000 | 0.000
0.000 | 0.000
0.000 | 0.000
| Plot | Mito | Lyso | Perox | ER | Golgi | PM | Cytosol | Nucleus | |||||
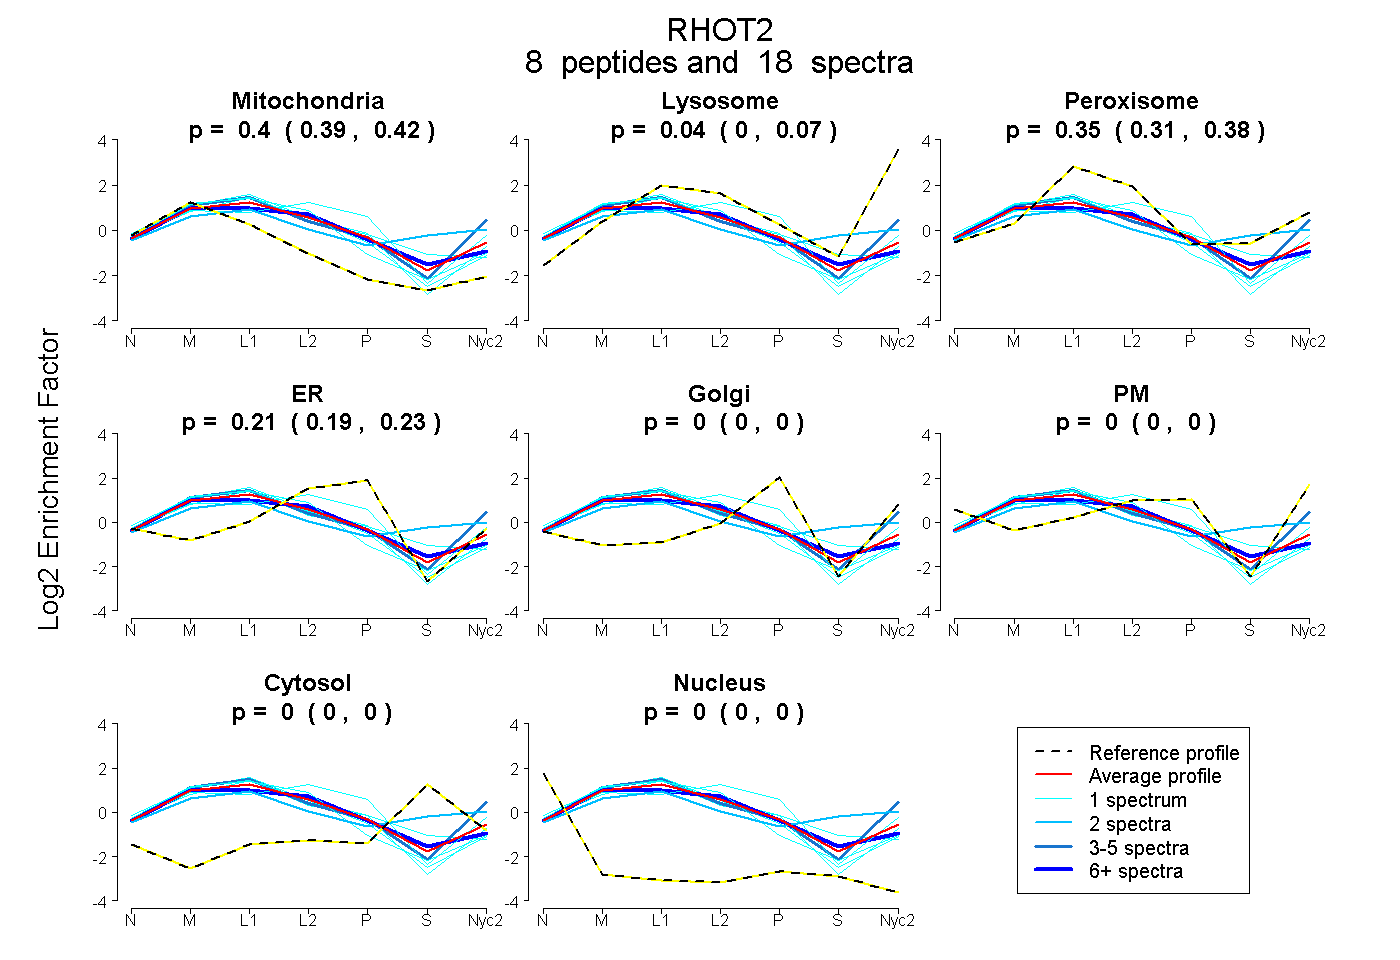
| Expt A |
8 peptides |
18 spectra |
|
0.403 0.386 | 0.416 |
0.039 0.005 | 0.067 |
0.347 0.308 | 0.378 |
0.211 0.189 | 0.226 |
0.000 0.000 | 0.000 |
0.000 0.000 | 0.000 |
0.000 0.000 | 0.000 |
0.000 0.000 | 0.000 |
| 1 spectrum, WIPLVNGR | 0.254 | 0.100 | 0.160 | 0.486 | 0.000 | 0.000 | 0.000 | 0.000 | ||
| 1 spectrum, ANVVCVVYDVSEEATIEK | 0.396 | 0.000 | 0.401 | 0.167 | 0.000 | 0.000 | 0.037 | 0.000 | ||
| 1 spectrum, ILLLGEAQVGK | 0.450 | 0.044 | 0.218 | 0.288 | 0.000 | 0.000 | 0.000 | 0.000 | ||
| 7 spectra, QLRPACAQALTR | 0.422 | 0.000 | 0.349 | 0.229 | 0.000 | 0.000 | 0.000 | 0.000 | ||
| 1 spectrum, TSLILSLVGEEFPEEVPAR | 0.504 | 0.000 | 0.389 | 0.107 | 0.000 | 0.000 | 0.000 | 0.000 | ||
| 4 spectra, GYQFVQR | 0.404 | 0.265 | 0.156 | 0.031 | 0.000 | 0.143 | 0.000 | 0.000 | ||
| 2 spectra, YYMDGQTPCLFISSK | 0.267 | 0.113 | 0.379 | 0.000 | 0.020 | 0.000 | 0.220 | 0.000 | ||
| 1 spectrum, AEEITIPADVTPEK | 0.488 | 0.000 | 0.309 | 0.203 | 0.000 | 0.000 | 0.000 | 0.000 |
| Plot | Mito | Lyso or Perox | ER | Golgi | PM | Cytosol | Nucleus | ||||||
| Expt B |
3 peptides |
5 spectra |
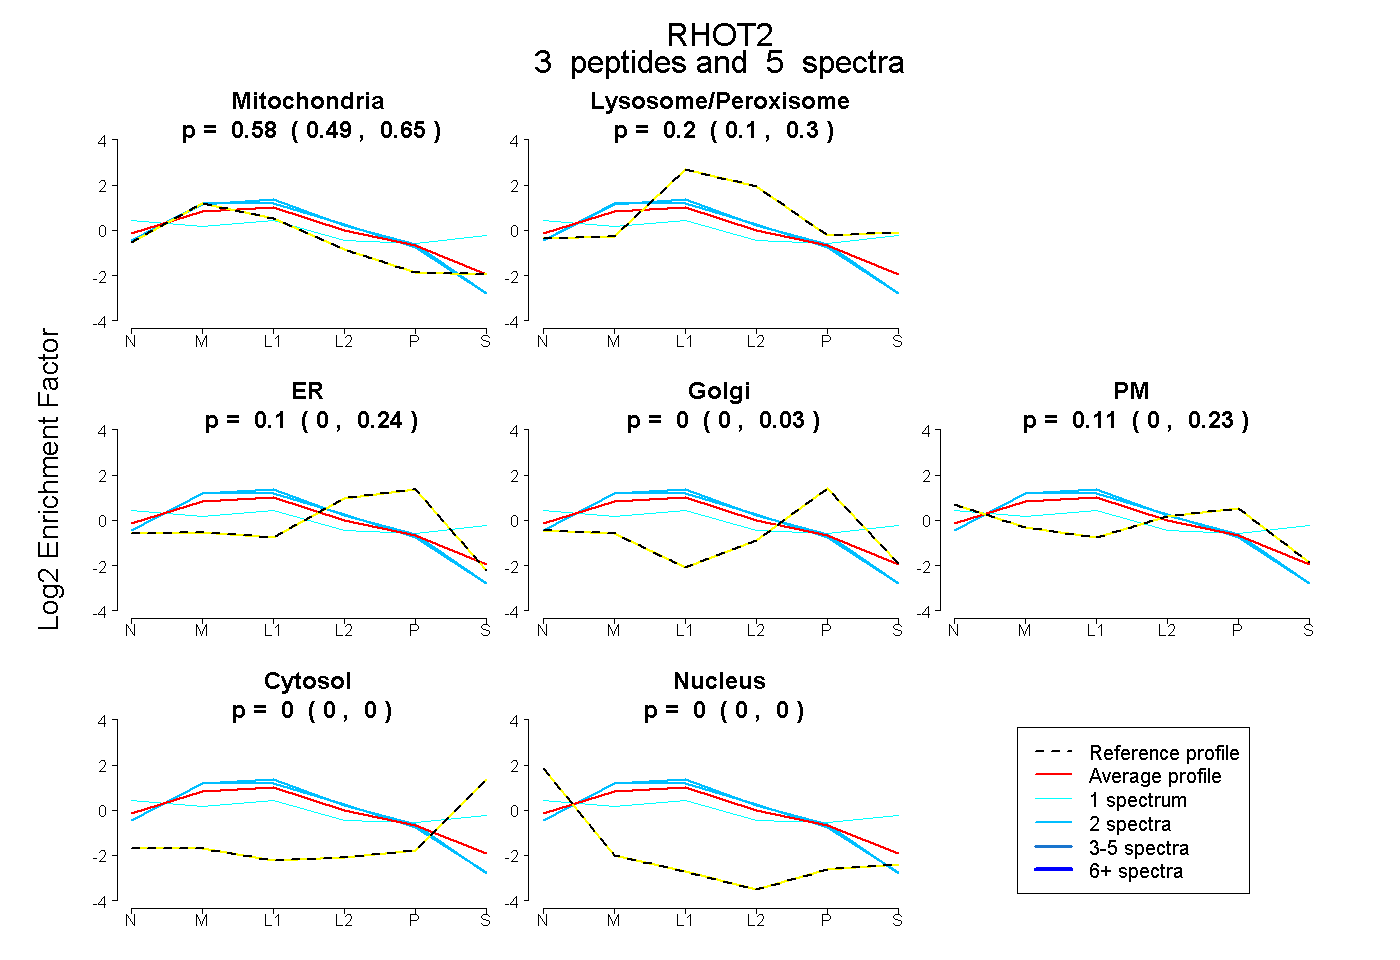 |
0.581 0.494 | 0.647 |
0.203 0.095 | 0.299 |
0.104 0.000 | 0.237 |
0.000 0.000 | 0.035 |
0.112 0.000 | 0.235 |
0.000 0.000 | 0.000 |
0.000 0.000 | 0.000 |
|||
| Plot | Lyso | Other | |||||||||||
| Expt C |
11 peptides |
56 spectra |
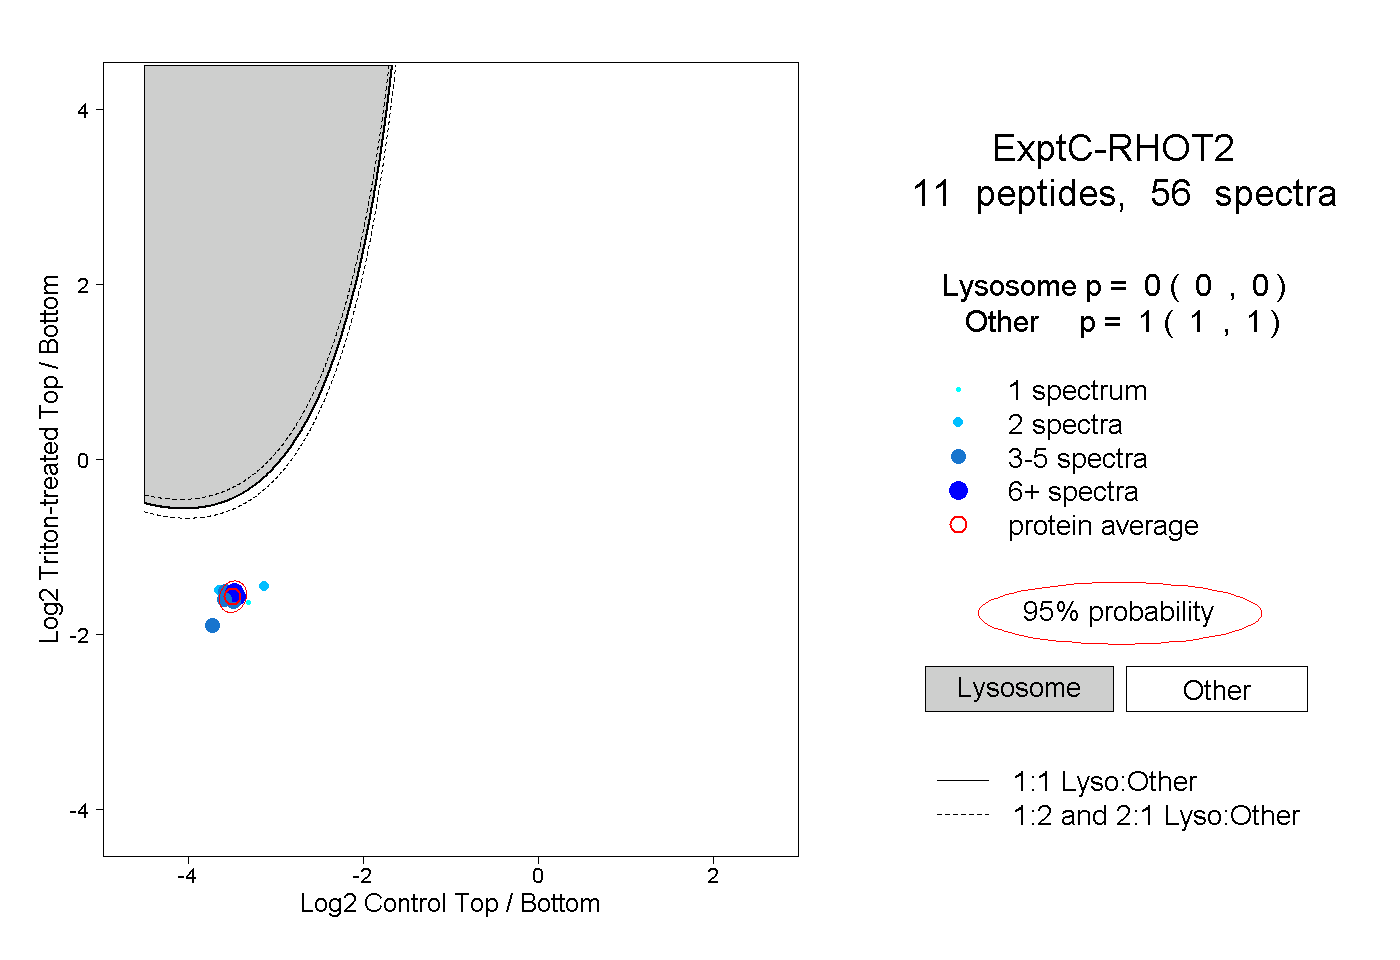 |
0.000 0.000 | 0.000 |
1.000 1.000 | 1.000 |
||||||||
| Plot | Lyso | Other | |||||||||||
| Expt D |
3 peptides |
4 spectra |
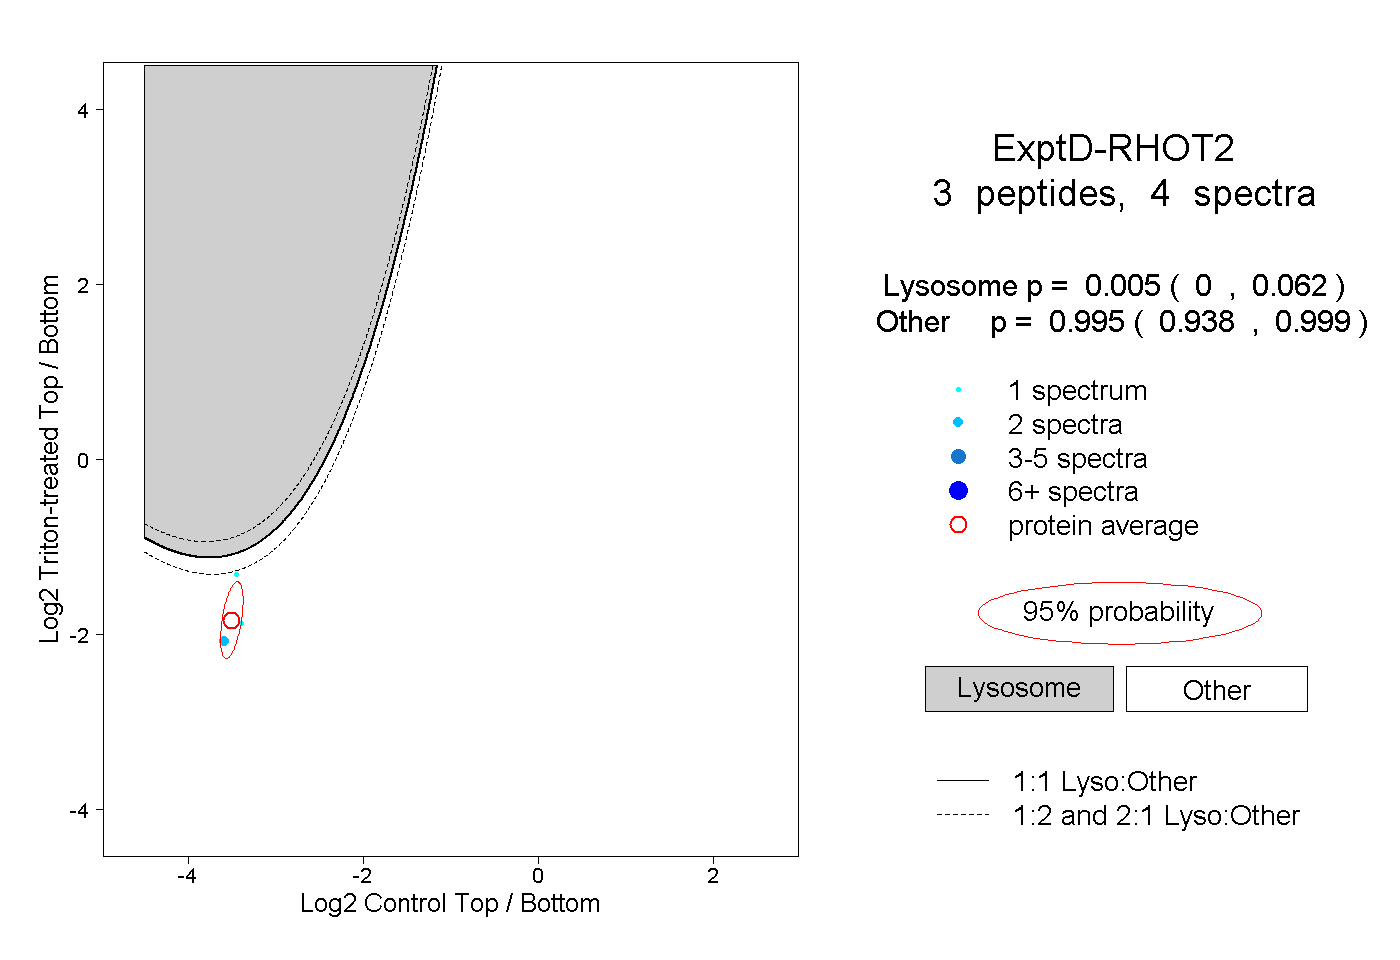 |
0.005 0.000 | 0.062 |
0.995 0.938 | 0.999 |