 11
11peptides
spectra
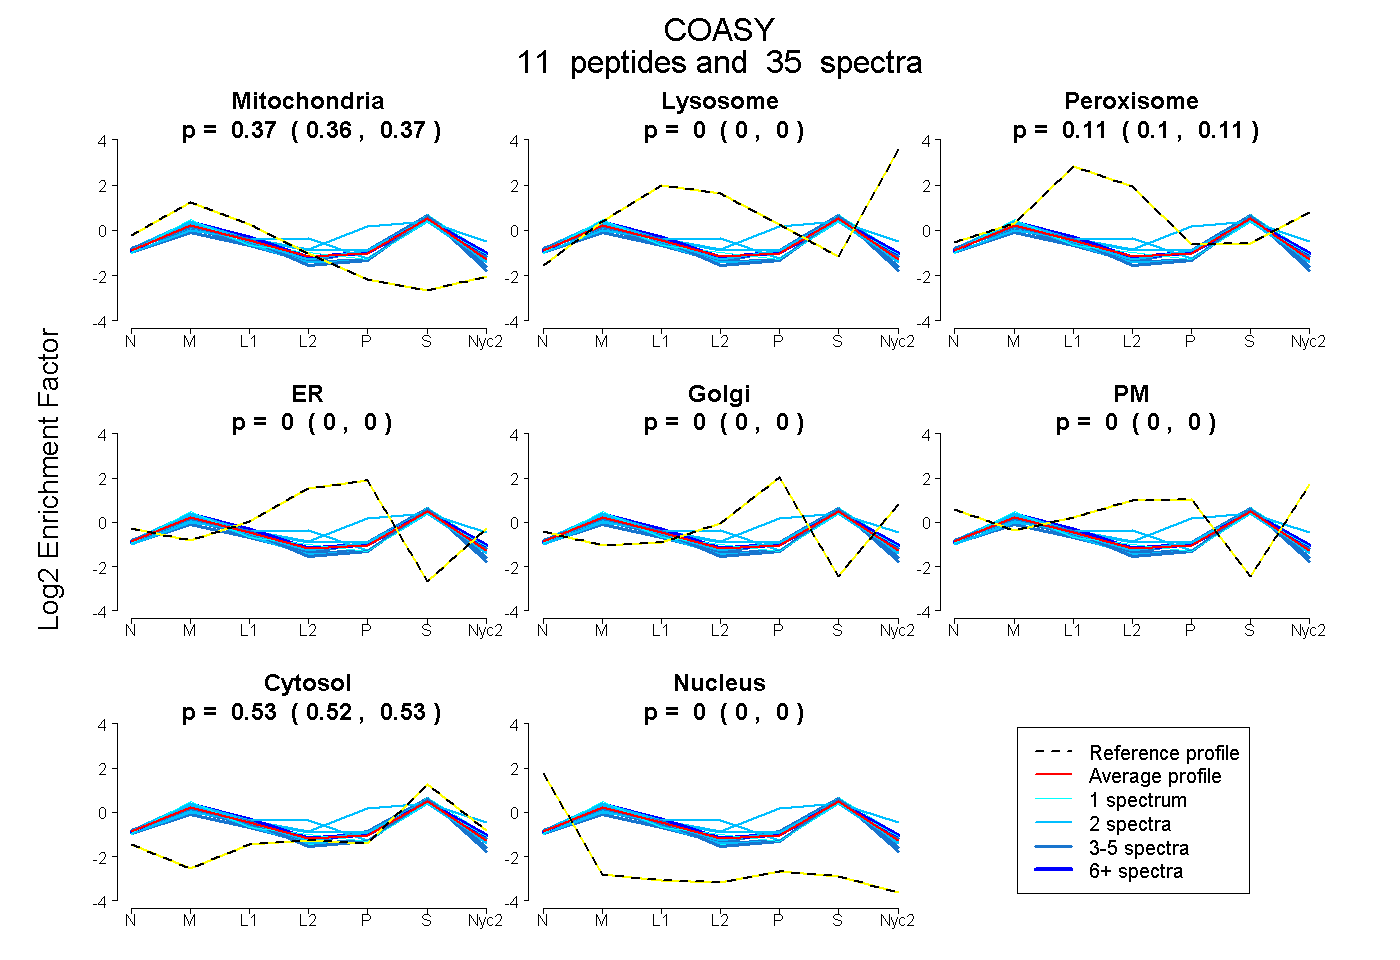
0.363 | 0.373
0.000 | 0.000
0.101 | 0.112
0.000 | 0.000
0.000 | 0.000
0.000 | 0.000
0.522 | 0.527
0.000 | 0.000
5peptides
spectra
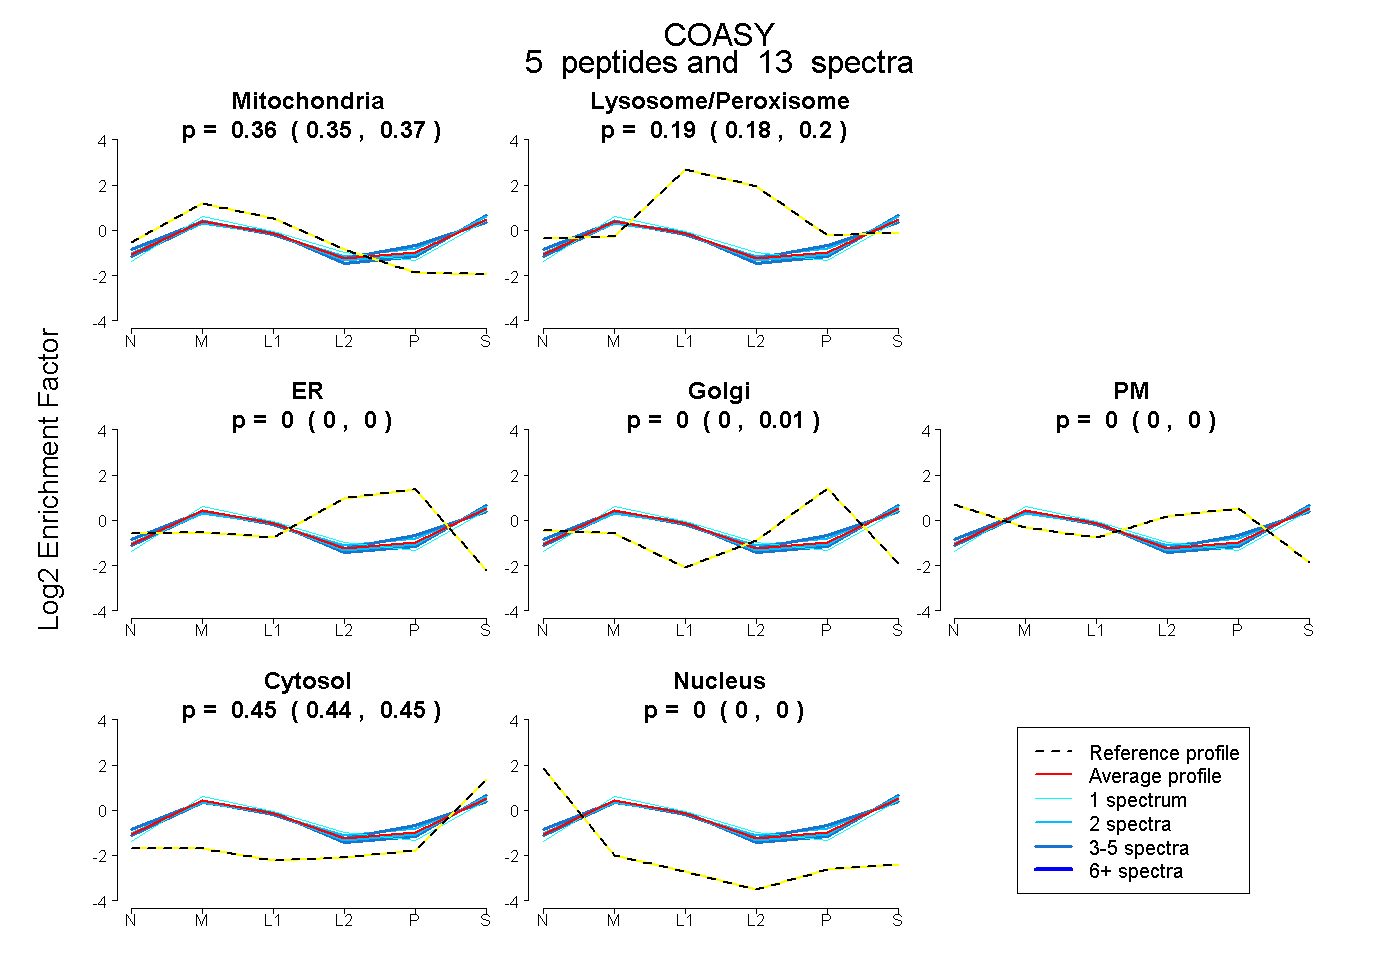
0.348 | 0.370
0.183 | 0.196
0.000 | 0.000
0.000 | 0.014
0.000 | 0.000
0.438 | 0.451
0.000 | 0.000
11peptides
spectra
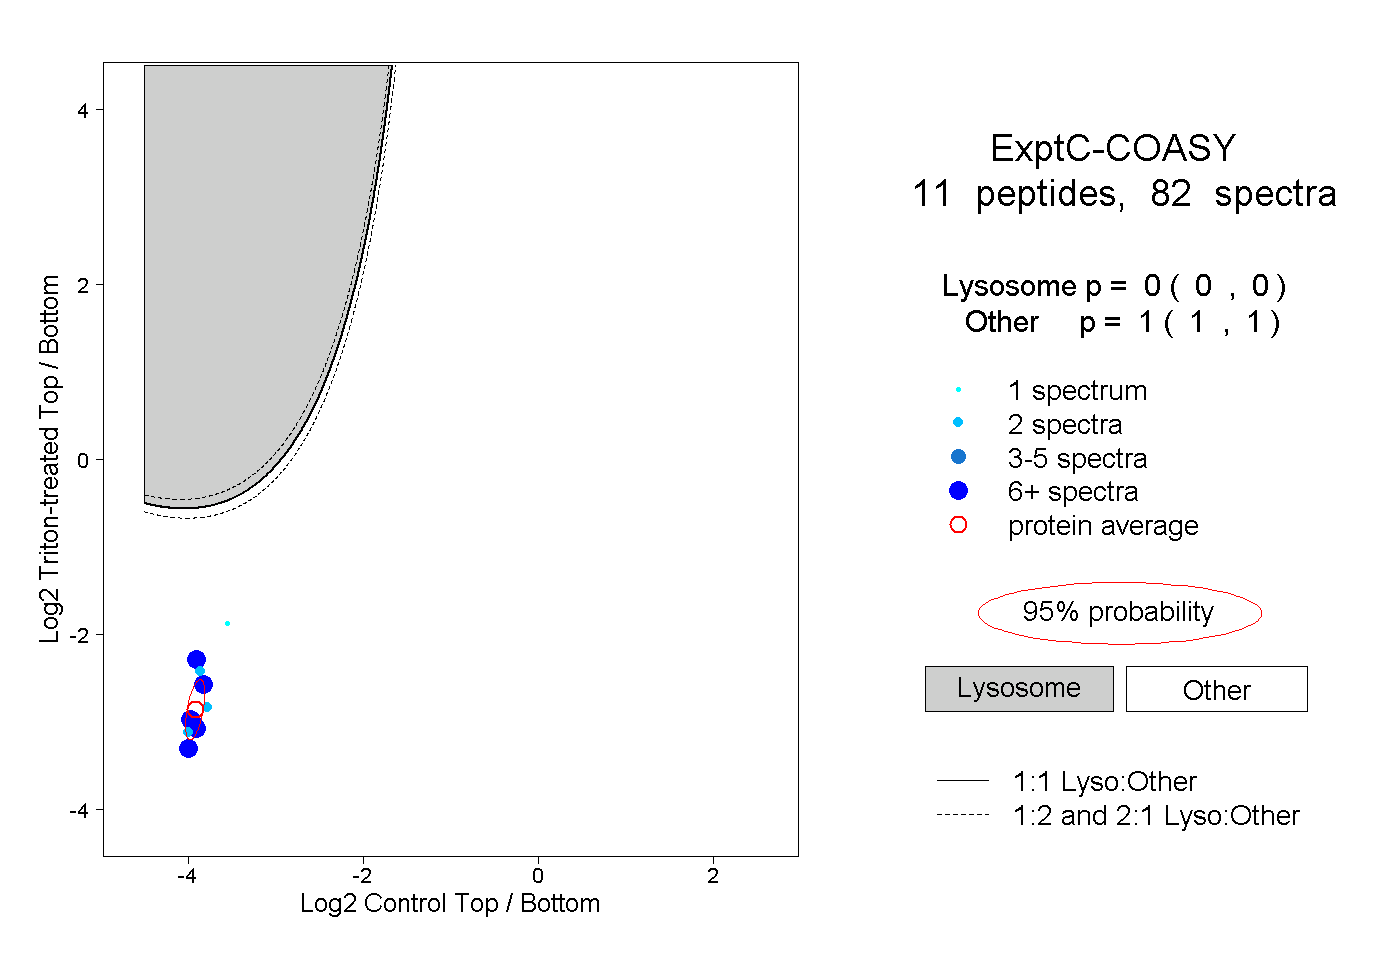
0.000 | 0.000
1.000 | 1.000
4peptides
spectra
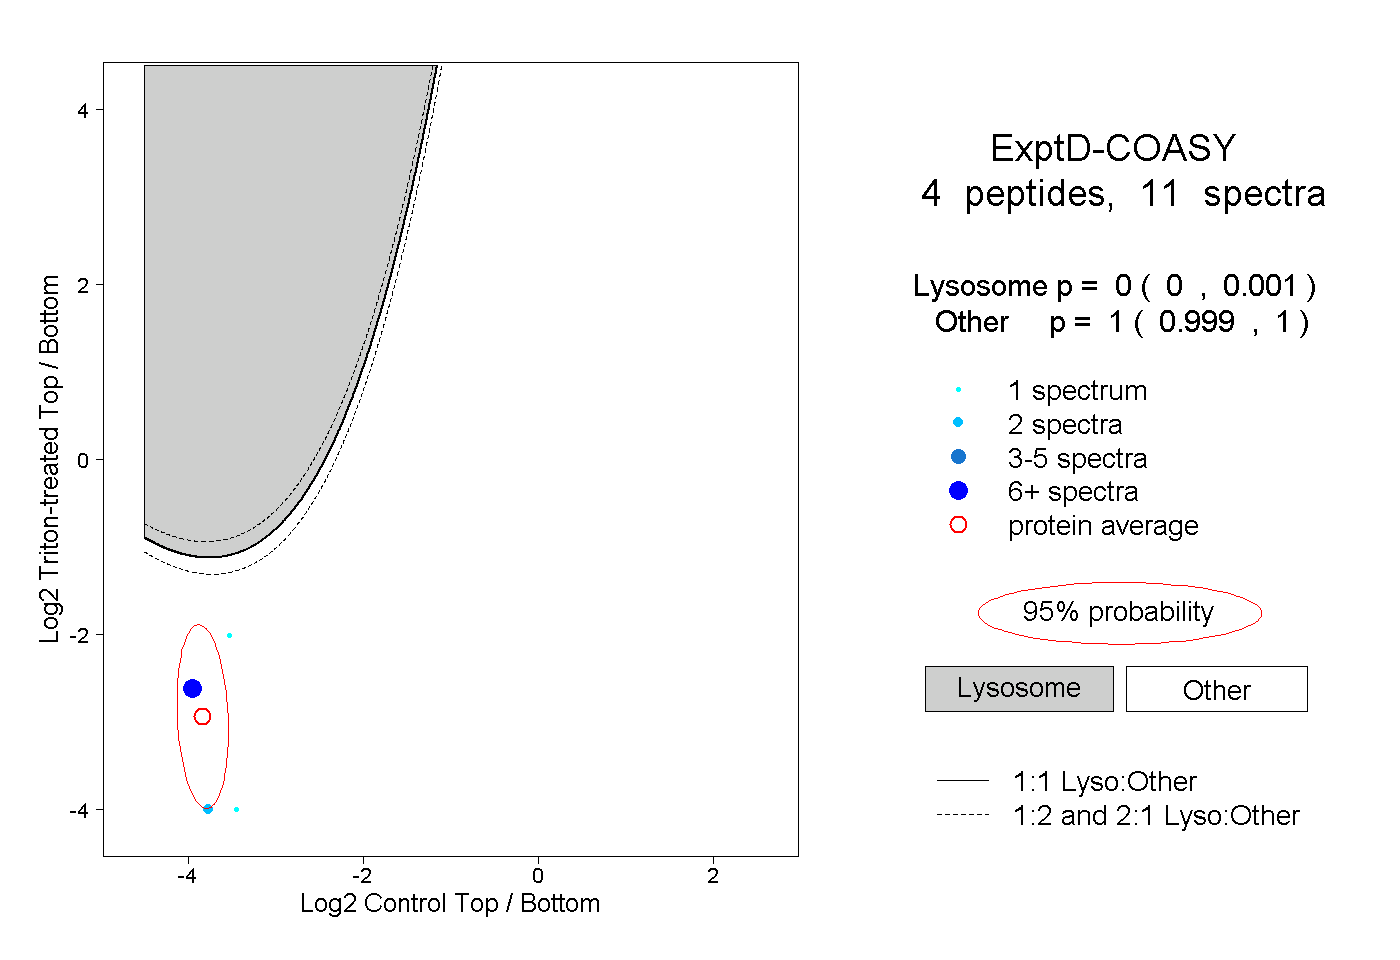
0.000 | 0.001
0.999 | 1.000