 11
11peptides
spectra
0.363 | 0.373
0.000 | 0.000
0.101 | 0.112
0.000 | 0.000
0.000 | 0.000
0.000 | 0.000
0.522 | 0.527
0.000 | 0.000
| Plot | Mito | Lyso | Perox | ER | Golgi | PM | Cytosol | Nucleus | |||||
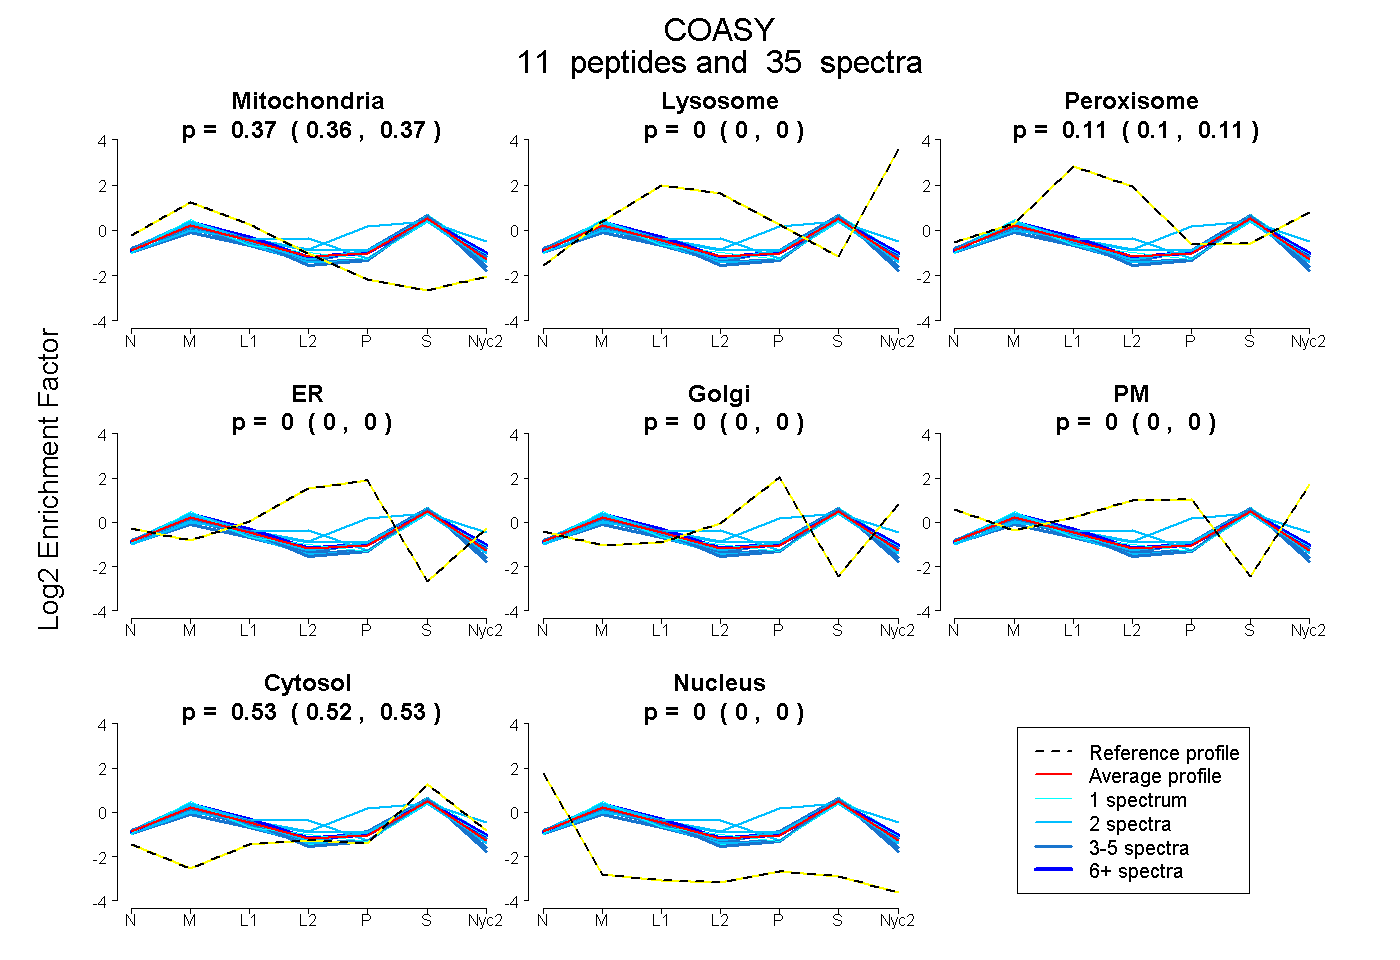
| Expt A |
11 peptides |
35 spectra |
|
0.368 0.363 | 0.373 |
0.000 0.000 | 0.000 |
0.107 0.101 | 0.112 |
0.000 0.000 | 0.000 |
0.000 0.000 | 0.000 |
0.000 0.000 | 0.000 |
0.525 0.522 | 0.527 |
0.000 0.000 | 0.000 |
| 3 spectra, AWDLLQK | 0.376 | 0.000 | 0.026 | 0.000 | 0.000 | 0.000 | 0.598 | 0.000 | ||
| 5 spectra, DGLSEAAAQSR | 0.371 | 0.000 | 0.069 | 0.000 | 0.000 | 0.000 | 0.559 | 0.000 | ||
| 2 spectra, LHNAHK | 0.304 | 0.106 | 0.142 | 0.000 | 0.000 | 0.000 | 0.448 | 0.000 | ||
| 1 spectrum, VFGNK | 0.412 | 0.056 | 0.042 | 0.000 | 0.000 | 0.000 | 0.489 | 0.000 | ||
| 1 spectrum, AYAPGGPAYQPVVEAFGTDILHQDGTINR | 0.337 | 0.000 | 0.112 | 0.000 | 0.000 | 0.000 | 0.551 | 0.000 | ||
| 2 spectra, EEMDVAVAK | 0.360 | 0.000 | 0.121 | 0.000 | 0.000 | 0.000 | 0.518 | 0.000 | ||
| 12 spectra, GGMAVNR | 0.374 | 0.043 | 0.094 | 0.000 | 0.000 | 0.000 | 0.489 | 0.000 | ||
| 2 spectra, ILLTNIQTK | 0.432 | 0.000 | 0.034 | 0.000 | 0.000 | 0.000 | 0.534 | 0.000 | ||
| 2 spectra, GAVGGTFDR | 0.237 | 0.000 | 0.090 | 0.137 | 0.055 | 0.000 | 0.481 | 0.000 | ||
| 2 spectra, MLTDIVWPVIAK | 0.402 | 0.003 | 0.088 | 0.000 | 0.000 | 0.000 | 0.508 | 0.000 | ||
| 3 spectra, LLPELLQPYSER | 0.428 | 0.000 | 0.032 | 0.000 | 0.000 | 0.000 | 0.540 | 0.000 |
| Plot | Mito | Lyso or Perox | ER | Golgi | PM | Cytosol | Nucleus | ||||||
| Expt B |
5 peptides |
13 spectra |
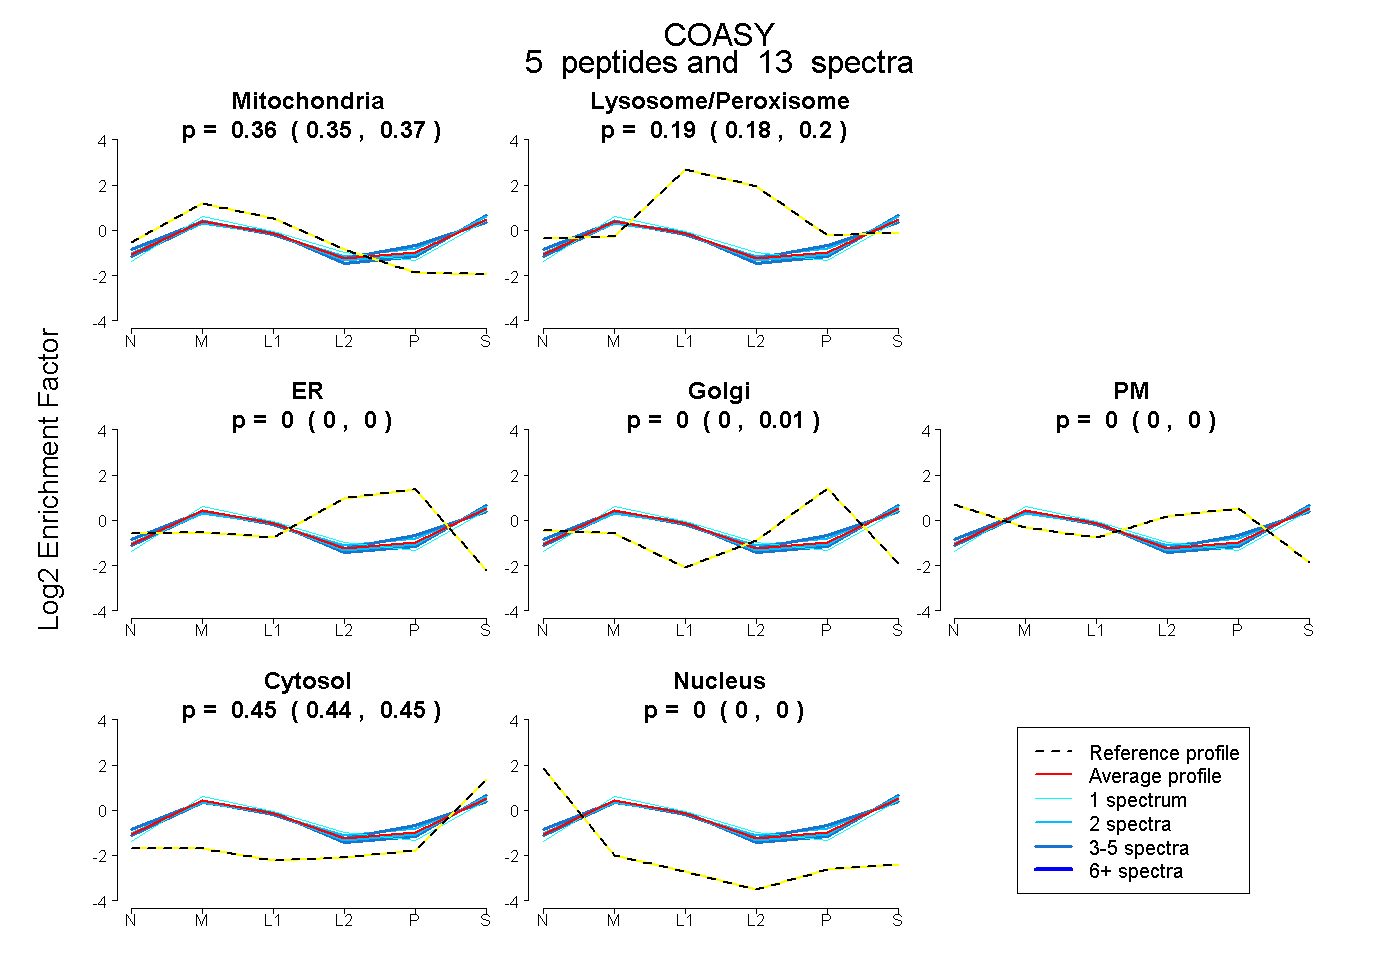 |
0.361 0.348 | 0.370 |
0.190 0.183 | 0.196 |
0.000 0.000 | 0.000 |
0.003 0.000 | 0.014 |
0.000 0.000 | 0.000 |
0.446 0.438 | 0.451 |
0.000 0.000 | 0.000 |
|||
| Plot | Lyso | Other | |||||||||||
| Expt C |
11 peptides |
82 spectra |
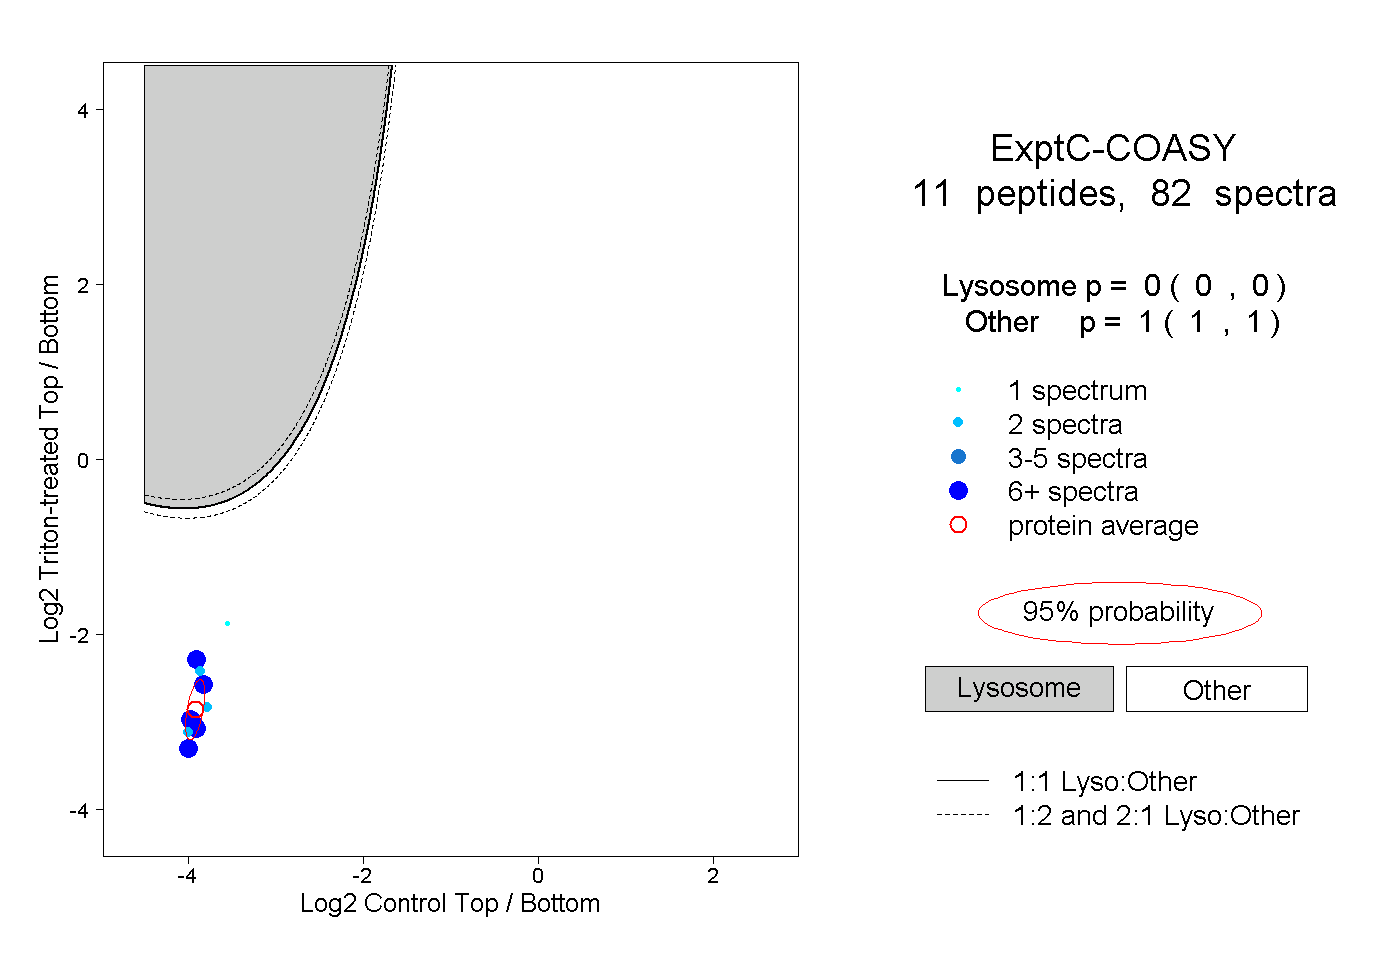 |
0.000 0.000 | 0.000 |
1.000 1.000 | 1.000 |
||||||||
| Plot | Lyso | Other | |||||||||||
| Expt D |
4 peptides |
11 spectra |
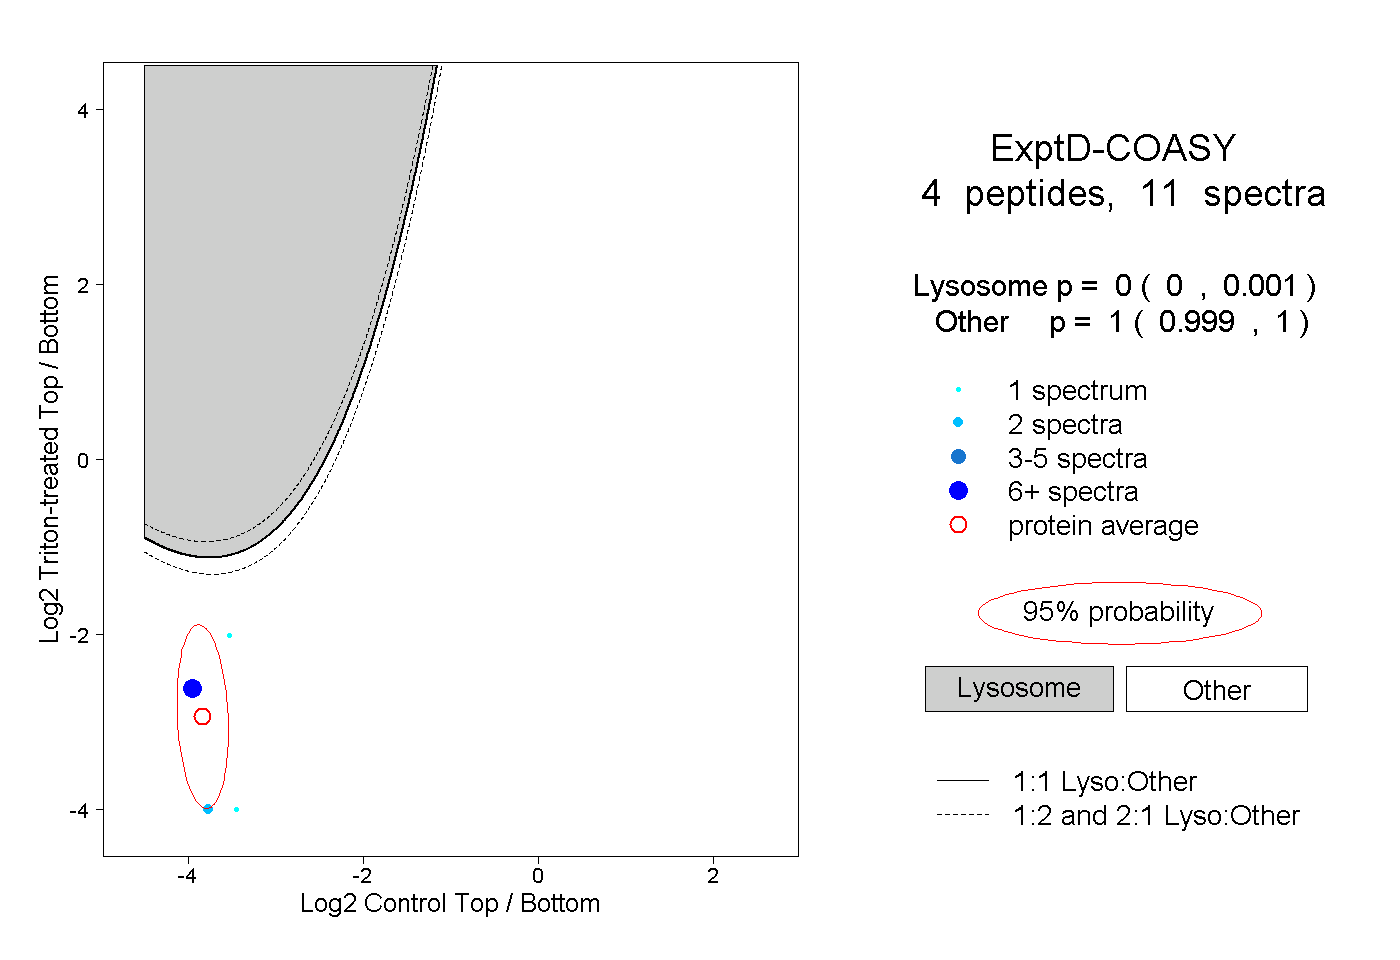 |
0.000 0.000 | 0.001 |
1.000 0.999 | 1.000 |