 8
8peptides
spectra
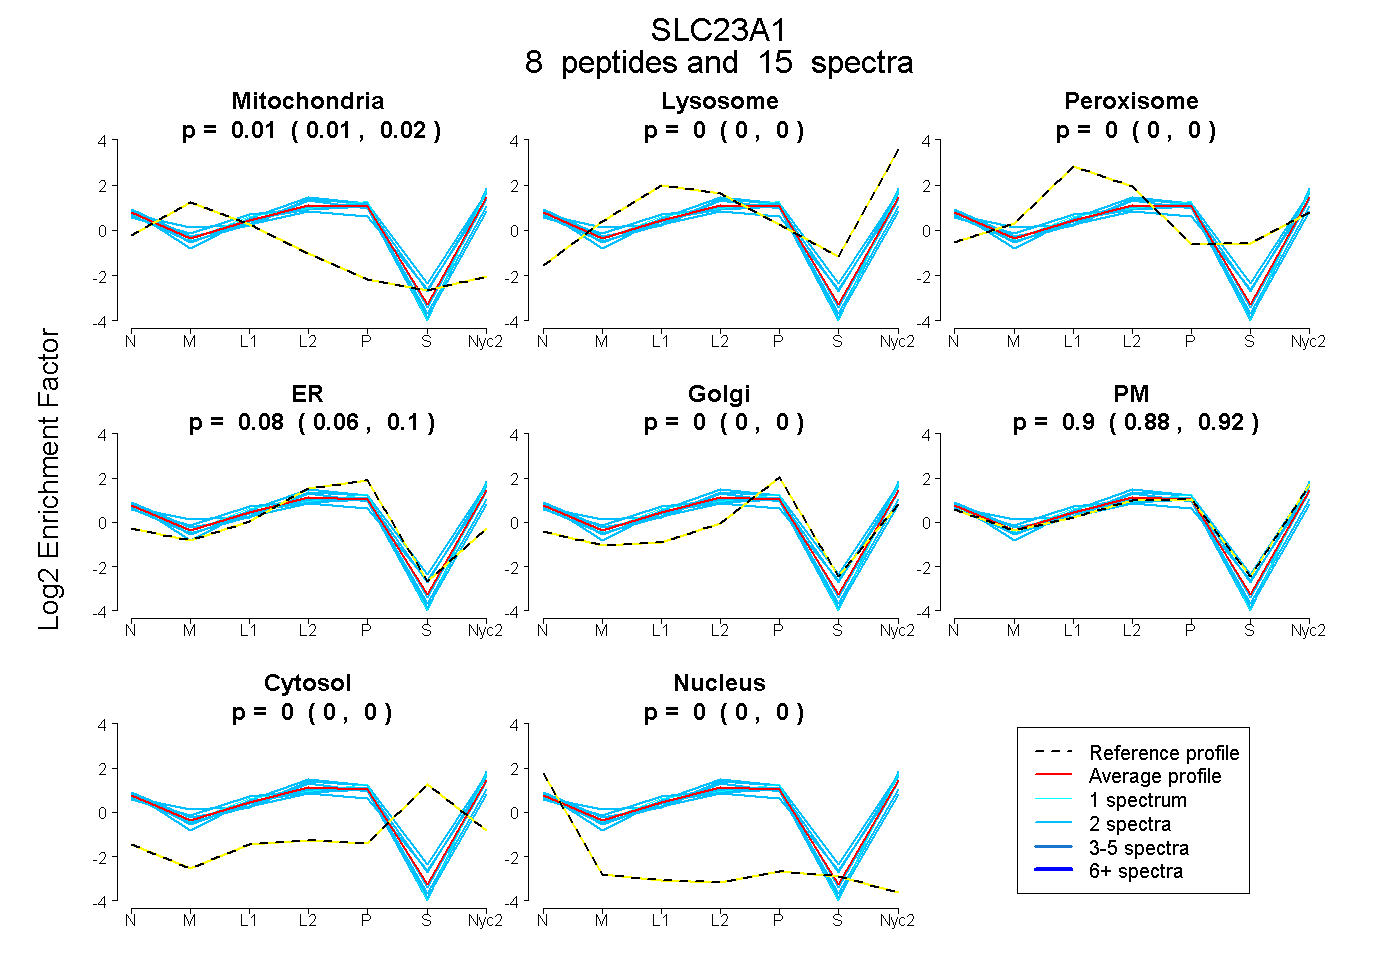
0.006 | 0.022
0.000 | 0.000
0.000 | 0.000
0.060 | 0.099
0.000 | 0.000
0.880 | 0.923
0.000 | 0.000
0.000 | 0.000
2peptides
spectra
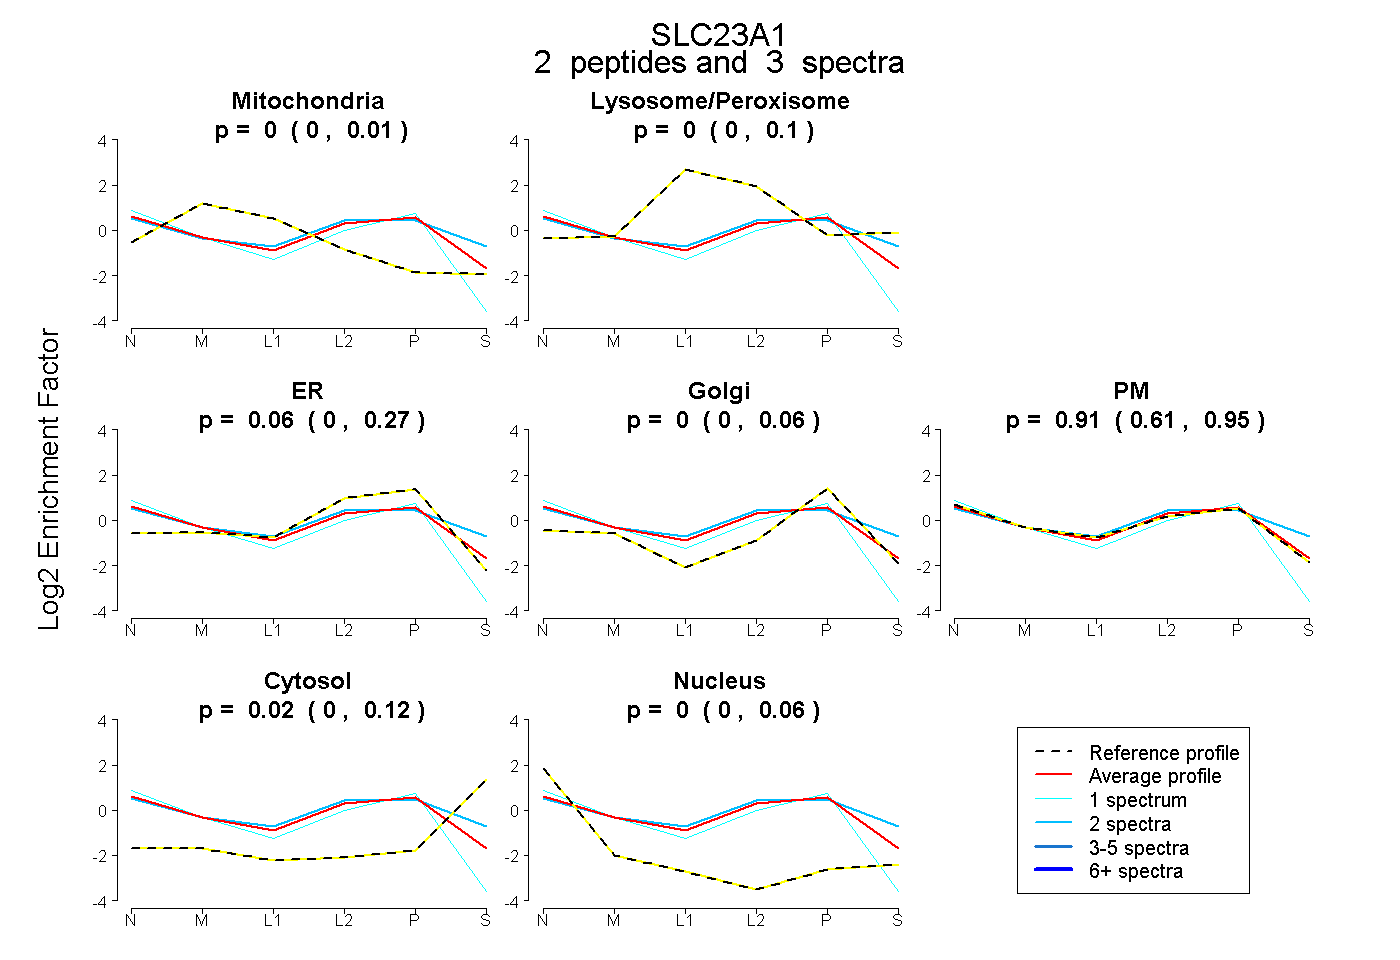
0.000 | 0.012
0.000 | 0.097
0.000 | 0.273
0.000 | 0.064
0.609 | 0.952
0.000 | 0.123
0.000 | 0.056
8peptides
spectra
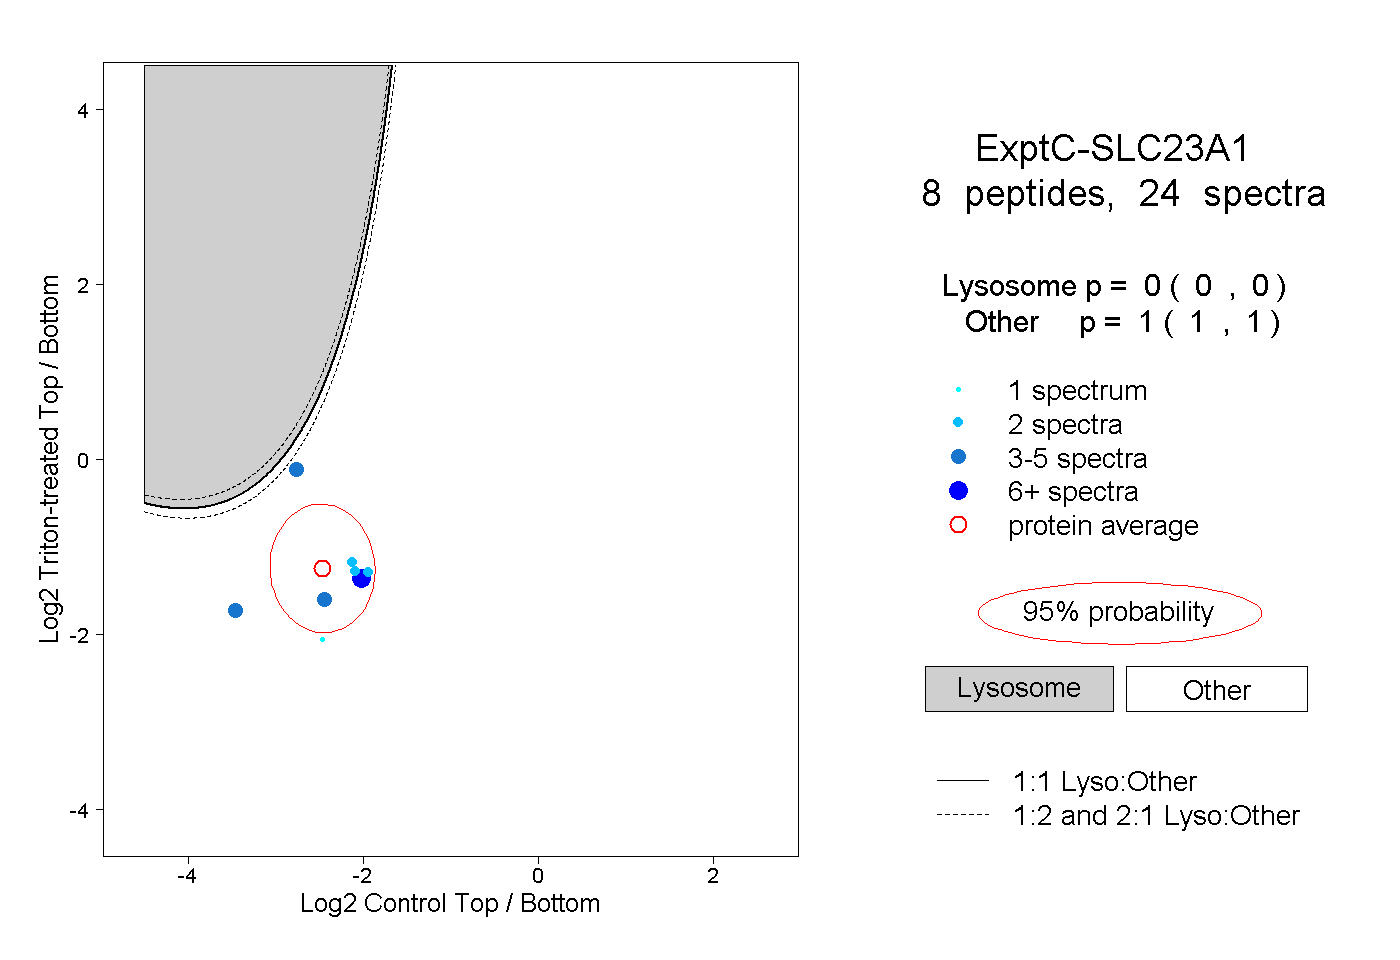
0.000 | 0.000
1.000 | 1.000
3peptides
spectra
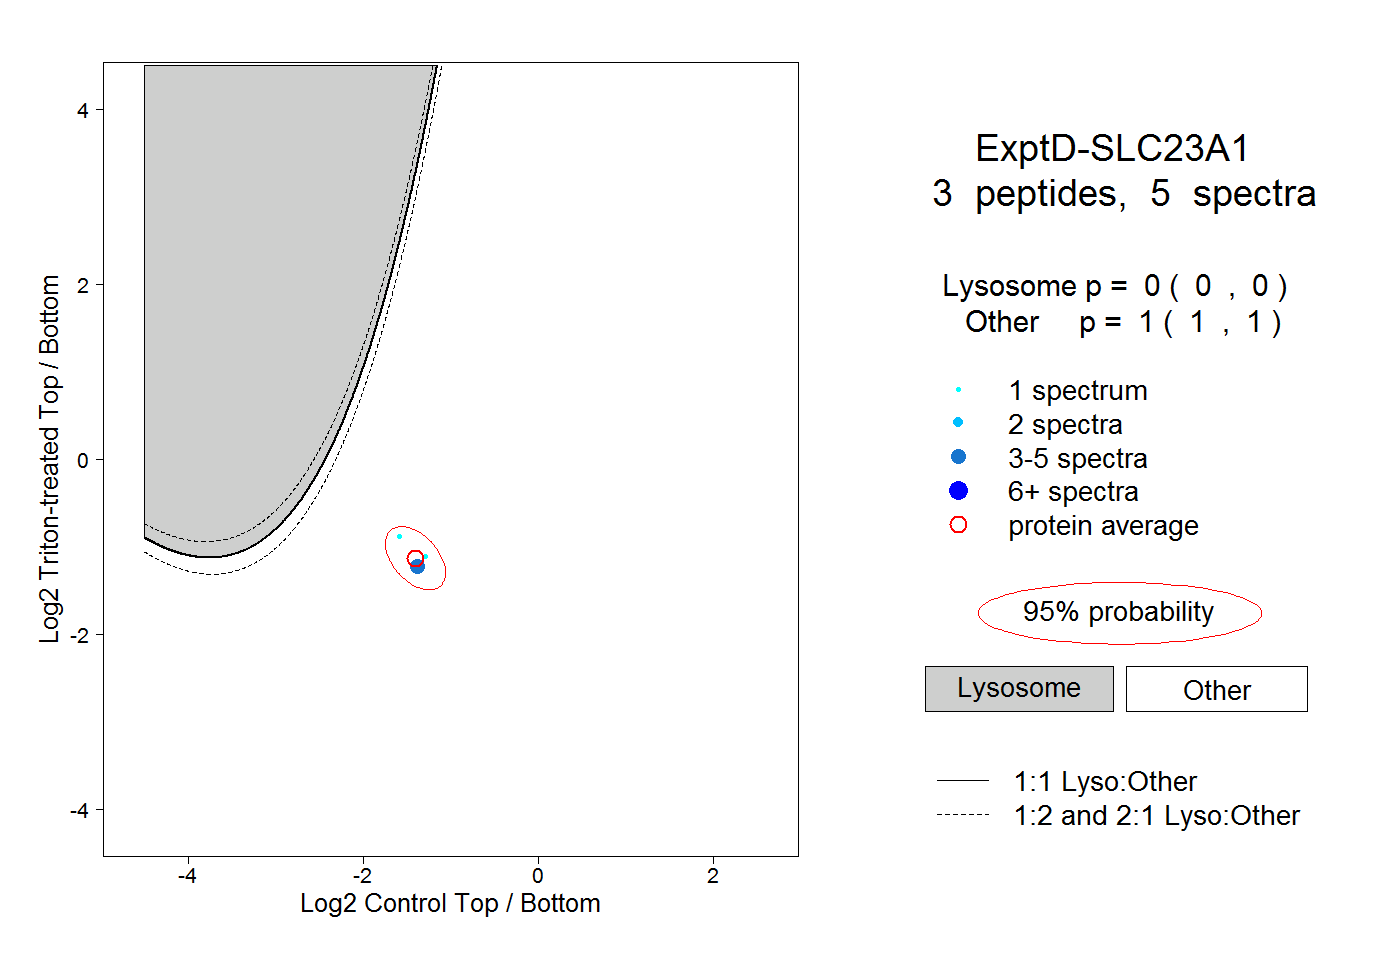
0.000 | 0.000
1.000 | 1.000