 8
8peptides
spectra
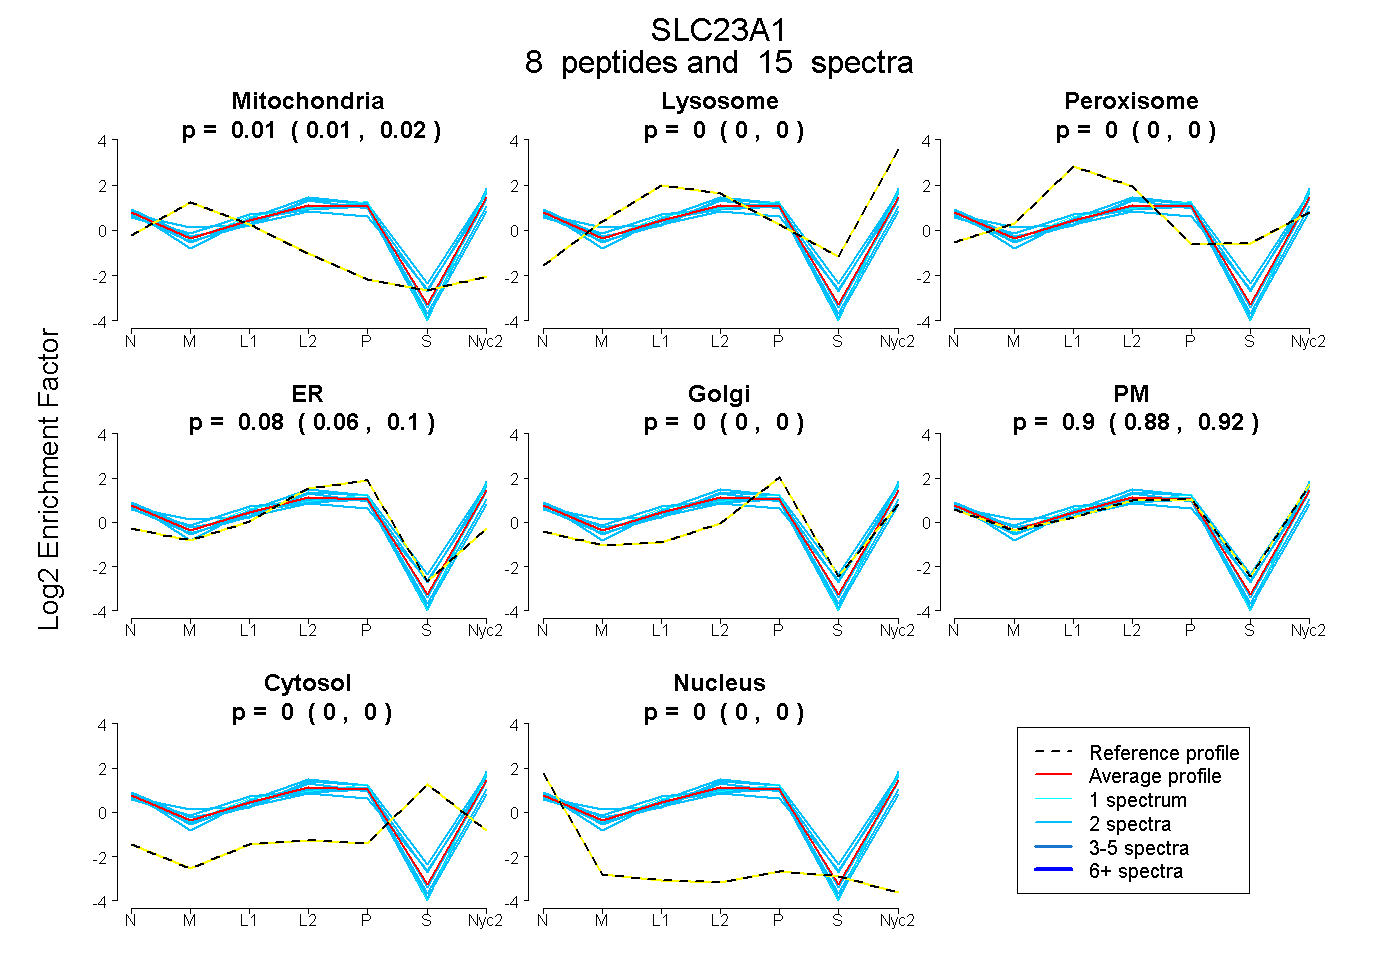
0.006 | 0.022
0.000 | 0.000
0.000 | 0.000
0.060 | 0.099
0.000 | 0.000
0.880 | 0.923
0.000 | 0.000
0.000 | 0.000
| Plot | Mito | Lyso | Perox | ER | Golgi | PM | Cytosol | Nucleus | |||||
| Expt A |
8 peptides |
15 spectra |
|
0.015 0.006 | 0.022 |
0.000 0.000 | 0.000 |
0.000 0.000 | 0.000 |
0.082 0.060 | 0.099 |
0.000 0.000 | 0.000 |
0.903 0.880 | 0.923 |
0.000 0.000 | 0.000 |
0.000 0.000 | 0.000 |
| 2 spectra, FDMLYK | 0.000 | 0.016 | 0.007 | 0.060 | 0.000 | 0.918 | 0.000 | 0.000 | ||
| 2 spectra, YIPICPVFR | 0.013 | 0.000 | 0.000 | 0.273 | 0.000 | 0.676 | 0.000 | 0.038 | ||
| 2 spectra, QHECPDSAGTSTR | 0.000 | 0.000 | 0.000 | 0.184 | 0.000 | 0.816 | 0.000 | 0.000 | ||
| 1 spectrum, SYDFPFGMGMVK | 0.000 | 0.000 | 0.000 | 0.036 | 0.000 | 0.964 | 0.000 | 0.000 | ||
| 2 spectra, LAGAPPPPVHAINR | 0.007 | 0.000 | 0.061 | 0.000 | 0.000 | 0.932 | 0.000 | 0.000 | ||
| 2 spectra, DQQAPLPAEPK | 0.055 | 0.000 | 0.000 | 0.159 | 0.000 | 0.775 | 0.000 | 0.011 | ||
| 2 spectra, GLTLFR | 0.114 | 0.006 | 0.000 | 0.000 | 0.000 | 0.880 | 0.000 | 0.000 | ||
| 2 spectra, NLTFLLPVYR | 0.000 | 0.000 | 0.000 | 0.000 | 0.000 | 1.000 | 0.000 | 0.000 |
| Plot | Mito | Lyso or Perox | ER | Golgi | PM | Cytosol | Nucleus | ||||||
| Expt B |
2 peptides |
3 spectra |
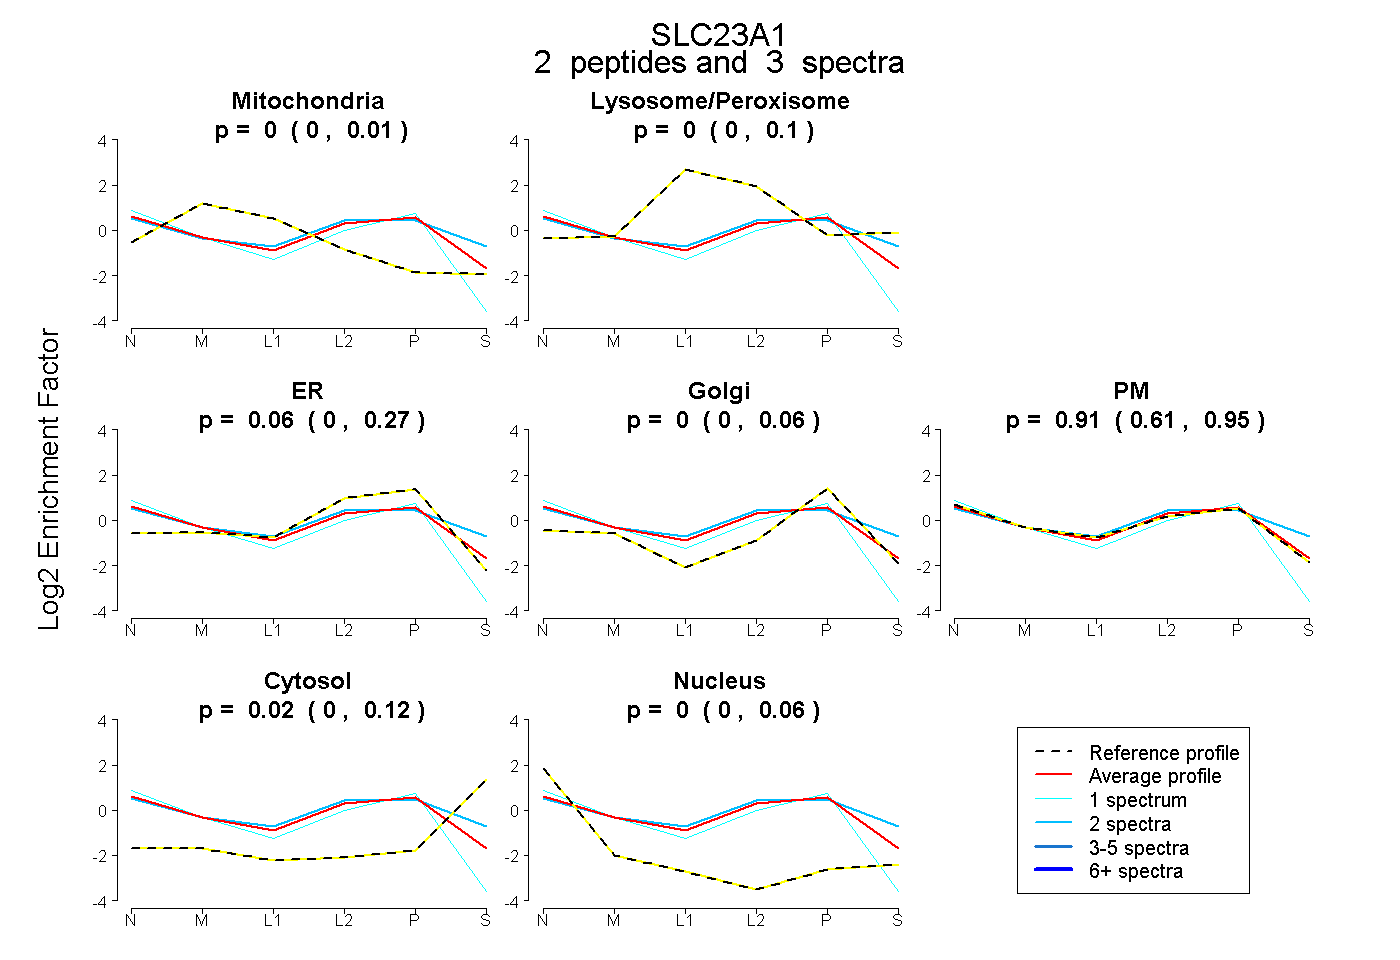 |
0.000 0.000 | 0.012 |
0.004 0.000 | 0.097 |
0.058 0.000 | 0.273 |
0.000 0.000 | 0.064 |
0.913 0.609 | 0.952 |
0.025 0.000 | 0.123 |
0.000 0.000 | 0.056 |
|||
| Plot | Lyso | Other | |||||||||||
| Expt C |
8 peptides |
24 spectra |
 |
0.000 0.000 | 0.000 |
1.000 1.000 | 1.000 |
||||||||
| Plot | Lyso | Other | |||||||||||
| Expt D |
3 peptides |
5 spectra |
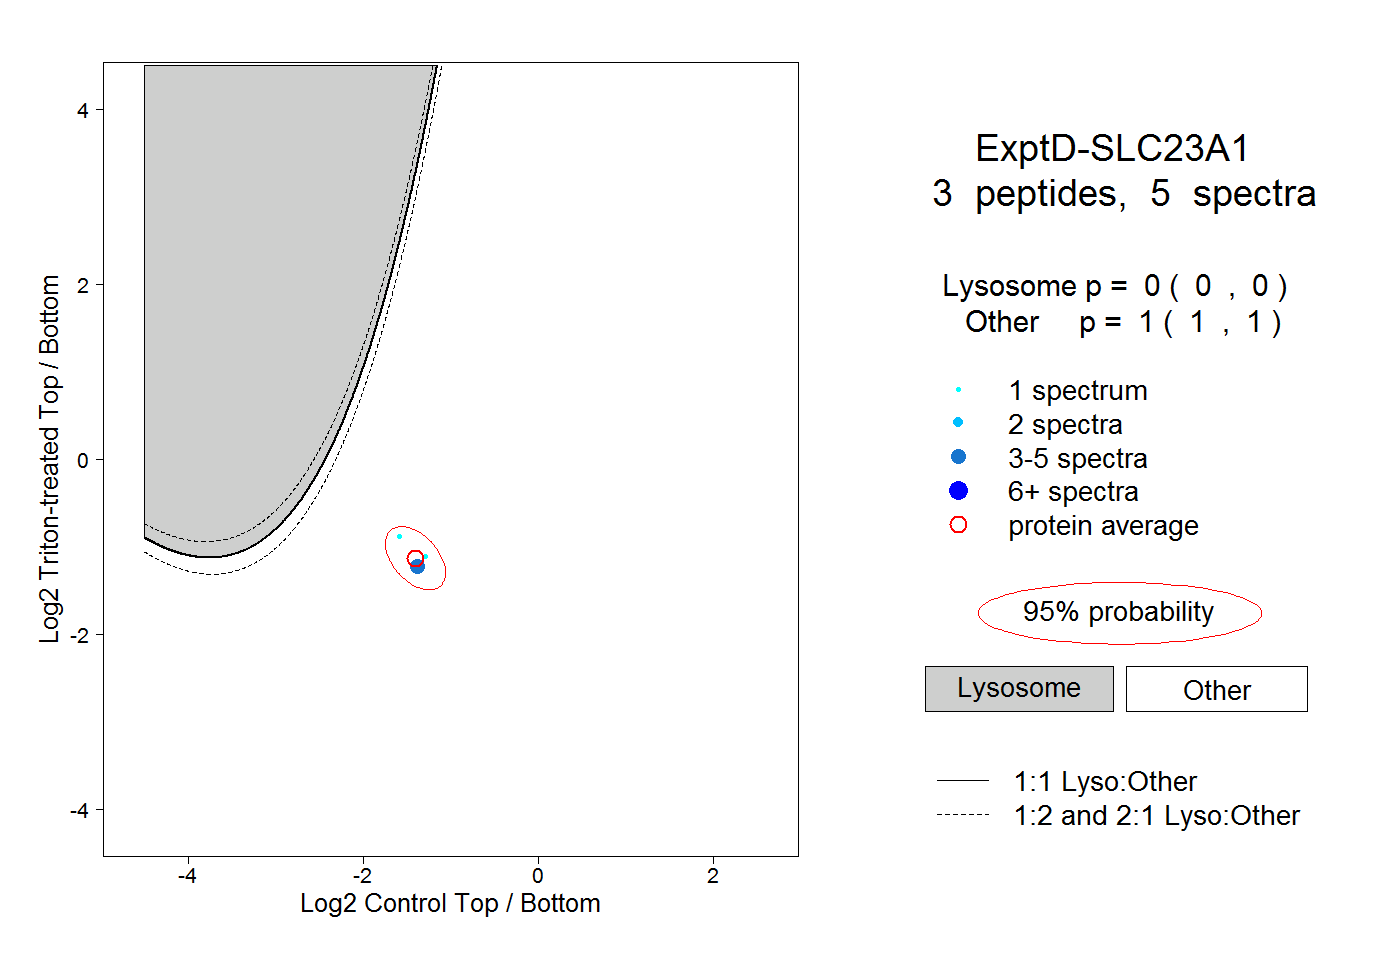 |
0.000 0.000 | 0.000 |
1.000 1.000 | 1.000 |