 15
15peptides
spectra
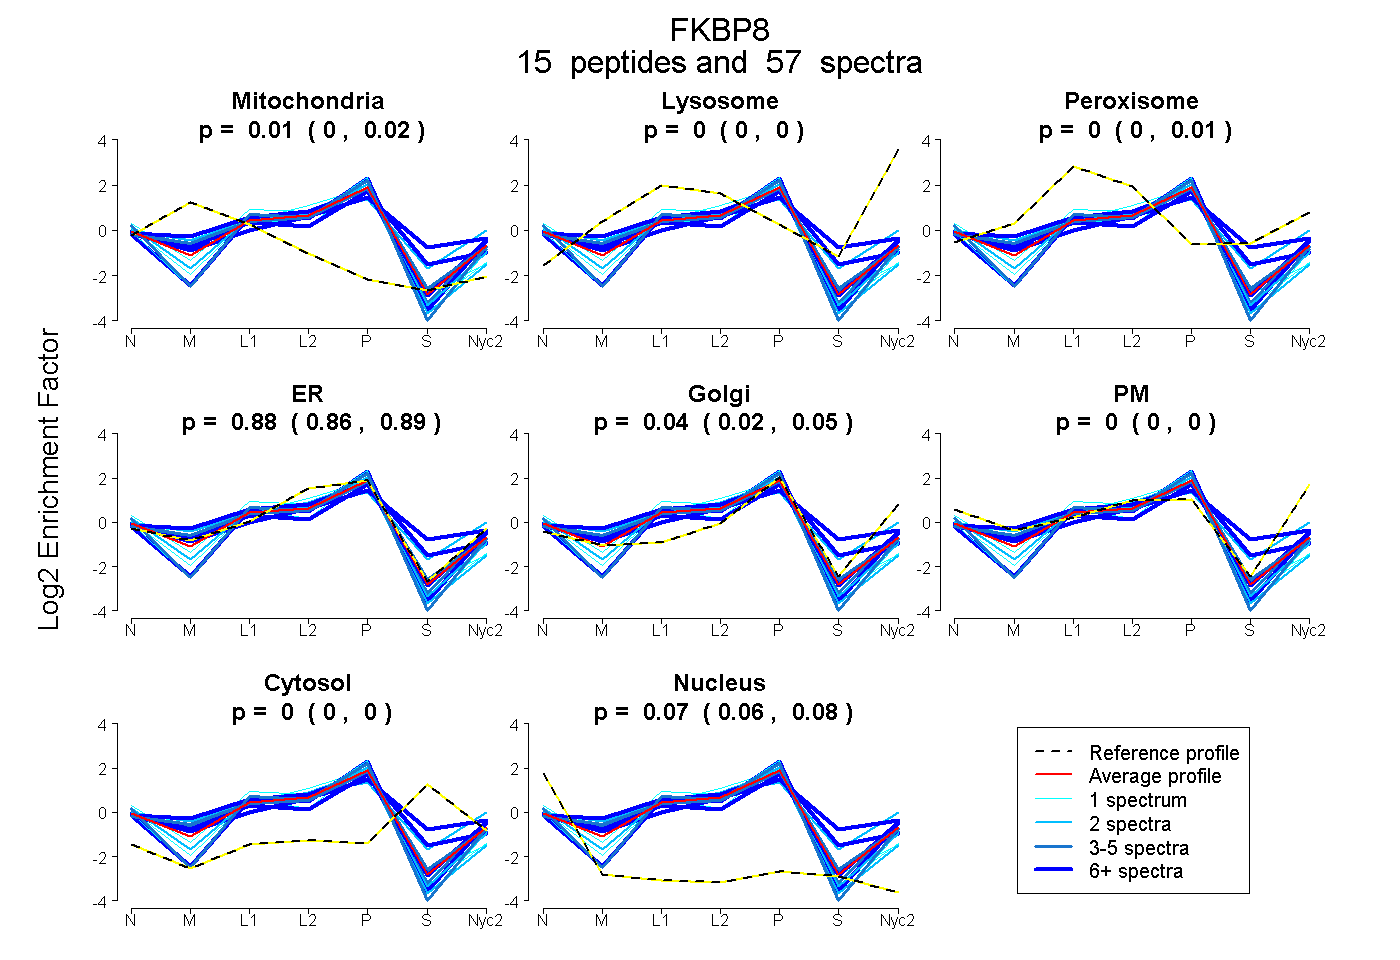
0.000 | 0.021
0.000 | 0.000
0.000 | 0.012
0.864 | 0.893
0.025 | 0.047
0.000 | 0.000
0.000 | 0.000
0.061 | 0.076
9peptides
spectra
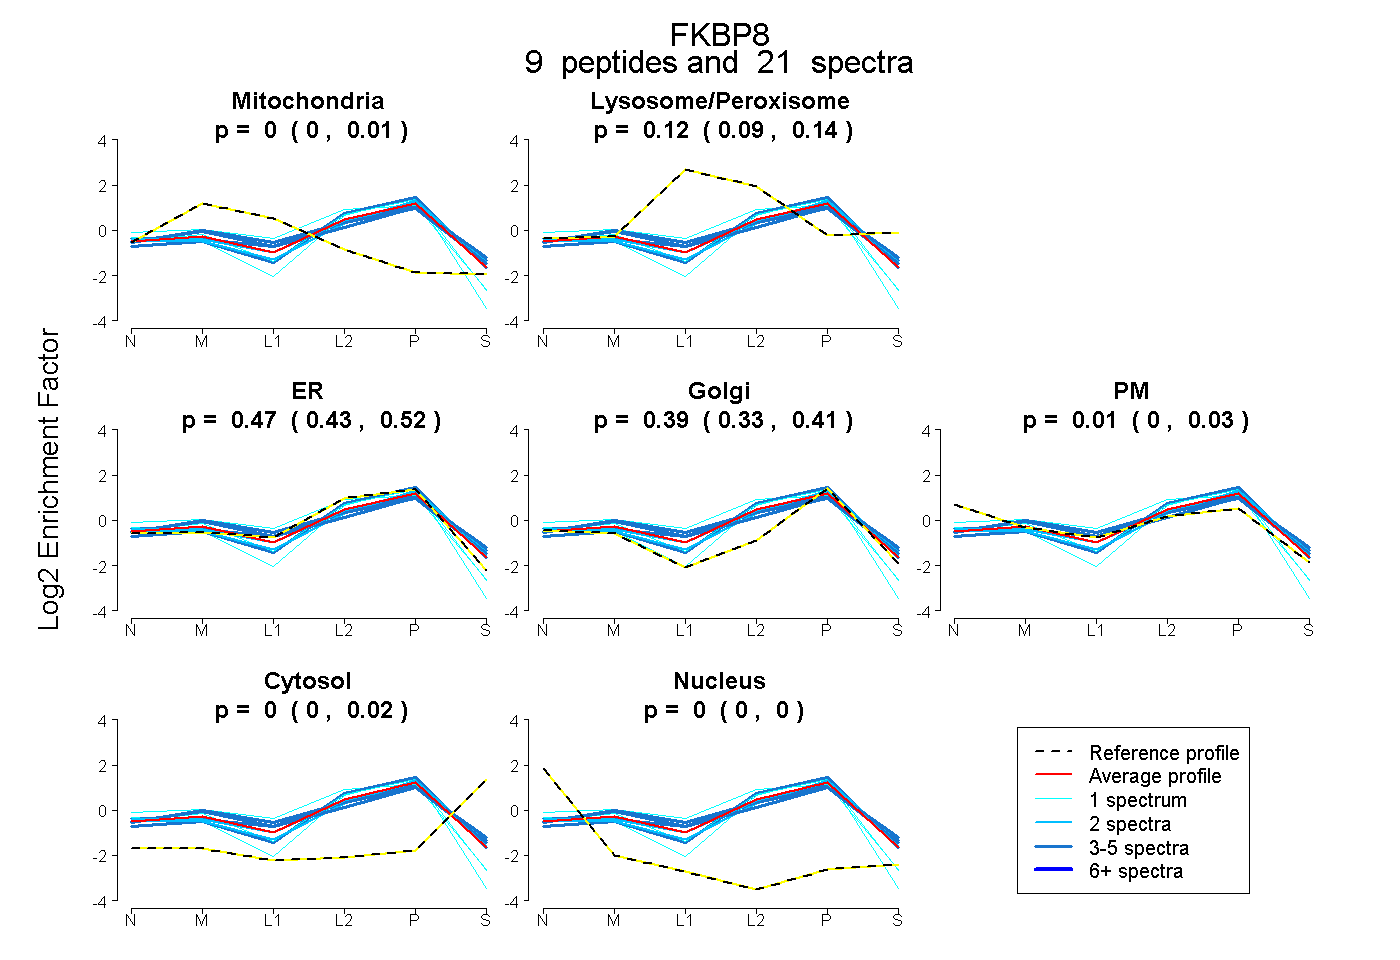
0.000 | 0.011
0.091 | 0.141
0.432 | 0.522
0.331 | 0.415
0.000 | 0.031
0.000 | 0.017
0.000 | 0.000
13peptides
spectra
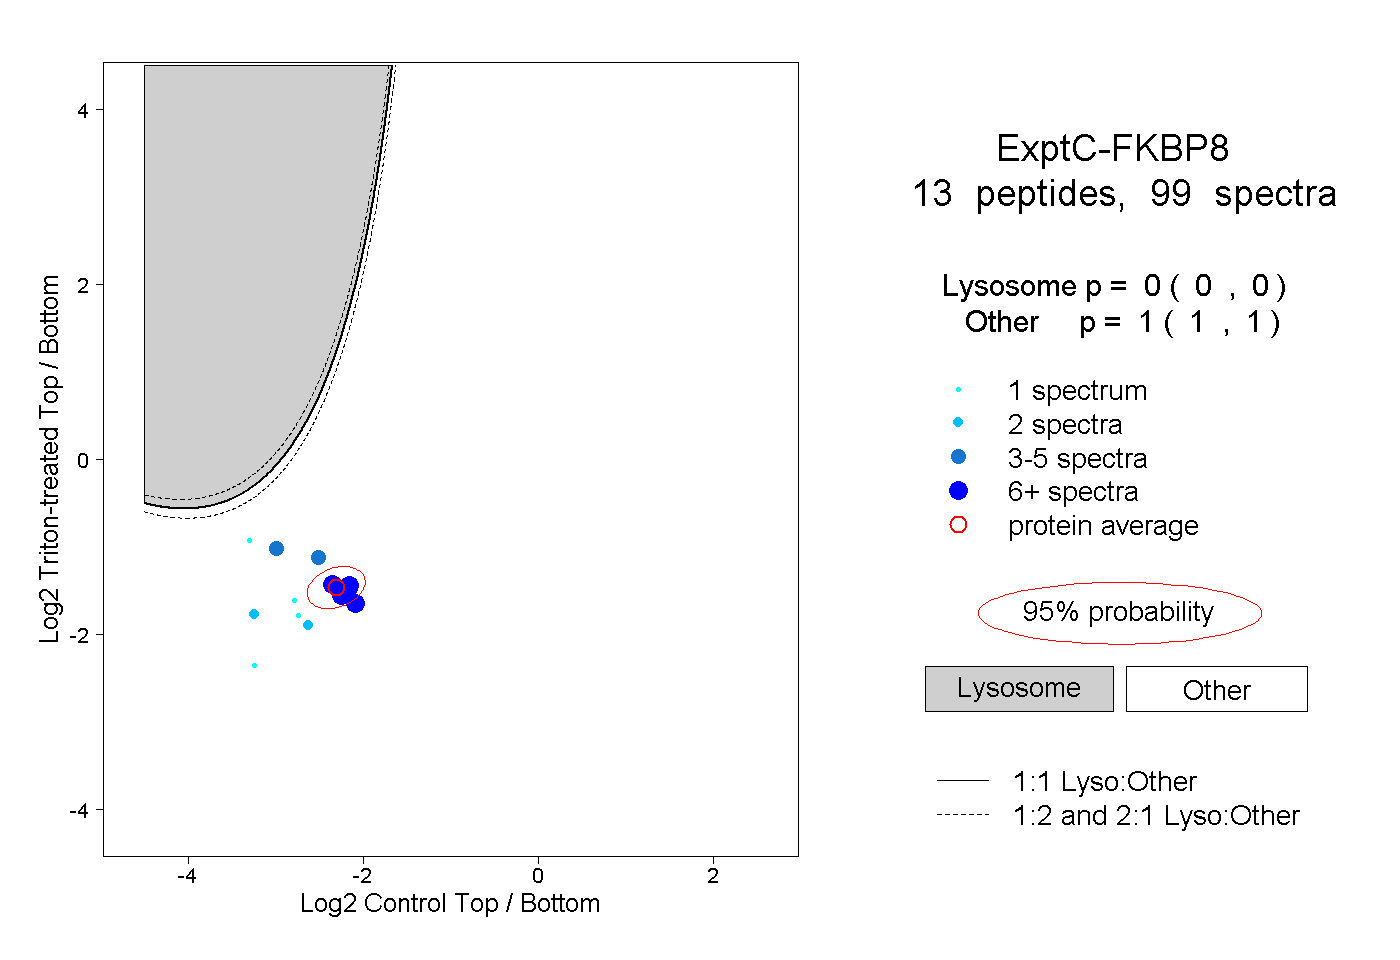
0.000 | 0.000
1.000 | 1.000
9peptides
spectra
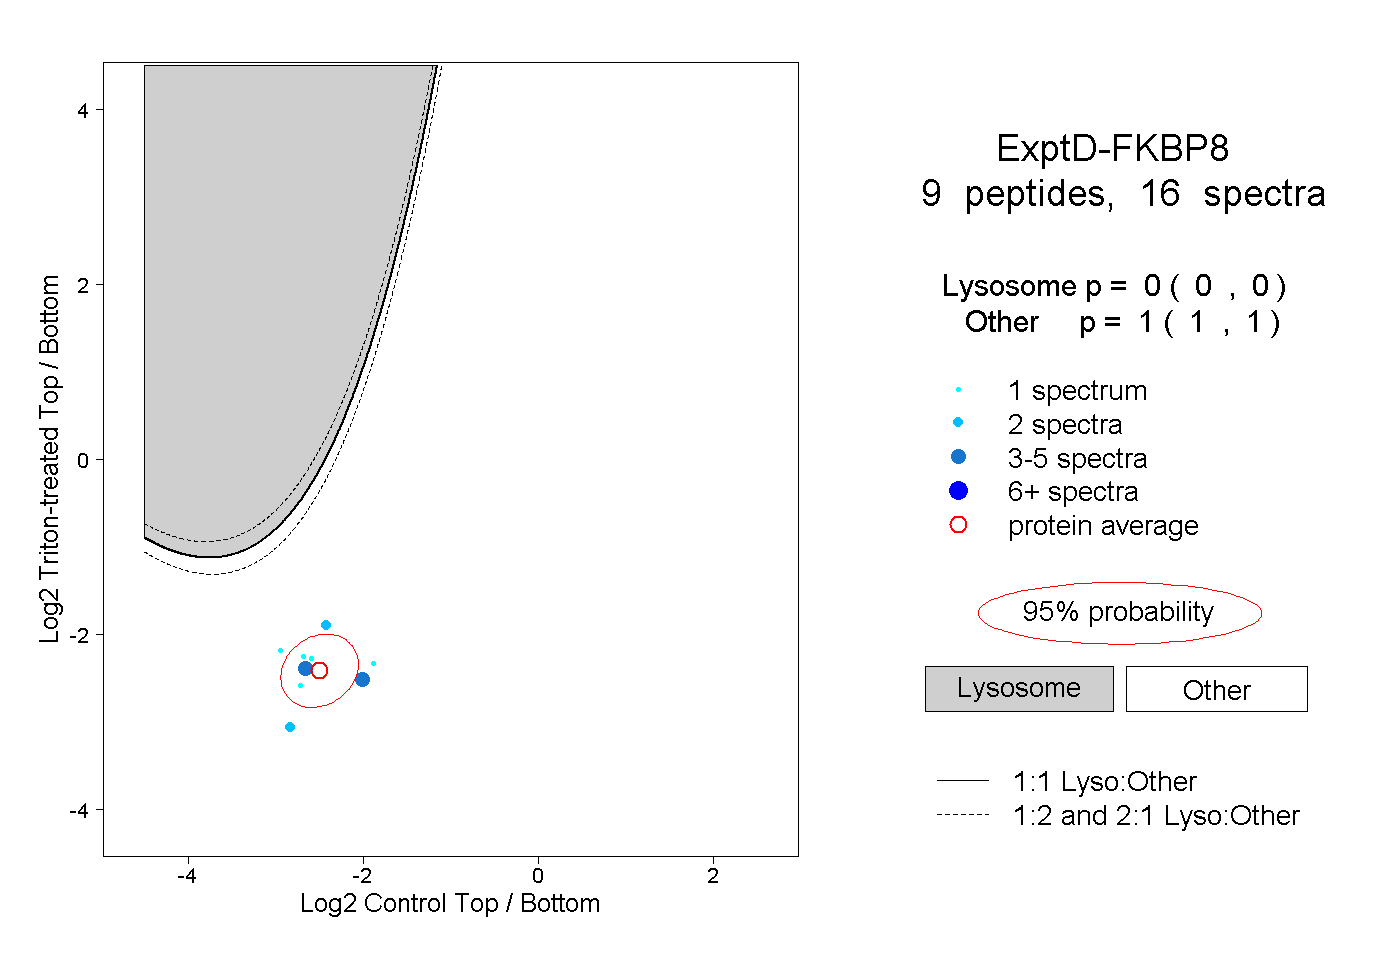
0.000 | 0.000
1.000 | 1.000