 15
15peptides
spectra
0.000 | 0.021
0.000 | 0.000
0.000 | 0.012
0.864 | 0.893
0.025 | 0.047
0.000 | 0.000
0.000 | 0.000
0.061 | 0.076
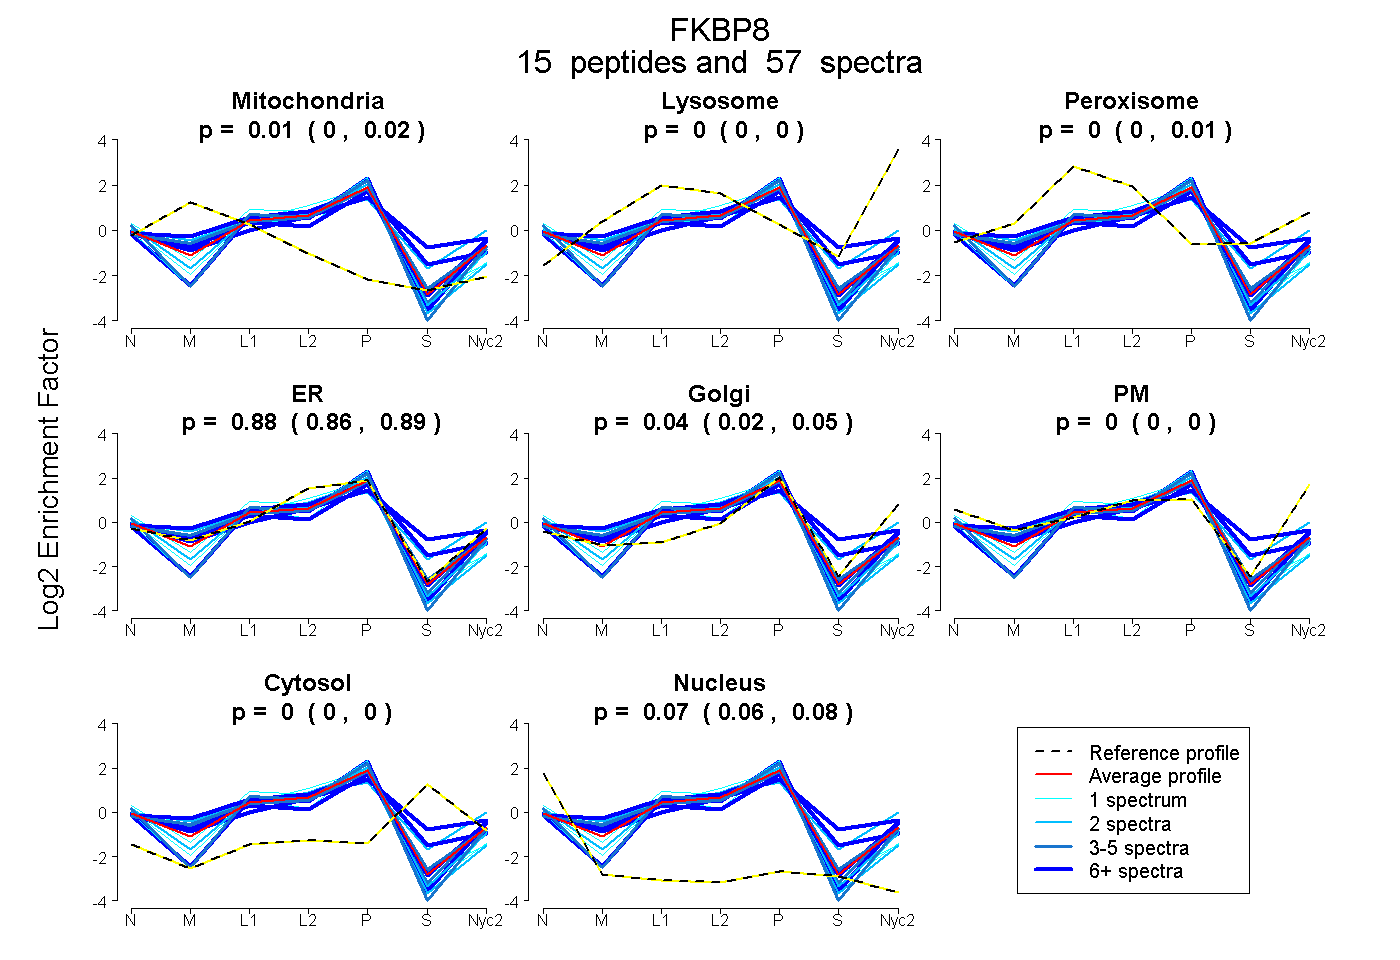
| Plot | Mito | Lyso | Perox | ER | Golgi | PM | Cytosol | Nucleus | |||||
| Expt A |
15 peptides |
57 spectra |
|
0.013 0.000 | 0.021 |
0.000 0.000 | 0.000 |
0.000 0.000 | 0.012 |
0.882 0.864 | 0.893 |
0.036 0.025 | 0.047 |
0.000 0.000 | 0.000 |
0.000 0.000 | 0.000 |
0.068 0.061 | 0.076 |
| 4 spectra, VLAQQGEYSEAIPILR | 0.000 | 0.000 | 0.000 | 0.898 | 0.000 | 0.000 | 0.000 | 0.102 | ||
| 5 spectra, ECGNAHYQR | 0.079 | 0.000 | 0.000 | 0.883 | 0.000 | 0.000 | 0.000 | 0.038 | ||
| 1 spectrum, CLNNLAASQLK | 0.131 | 0.000 | 0.000 | 0.866 | 0.000 | 0.000 | 0.000 | 0.002 | ||
| 2 spectra, TIHAELSK | 0.000 | 0.000 | 0.000 | 0.905 | 0.000 | 0.000 | 0.000 | 0.095 | ||
| 1 spectrum, ADFVLAANSYDLAIK | 0.000 | 0.000 | 0.015 | 0.887 | 0.000 | 0.000 | 0.000 | 0.097 | ||
| 4 spectra, AITSNAK | 0.127 | 0.000 | 0.000 | 0.794 | 0.058 | 0.021 | 0.000 | 0.000 | ||
| 9 spectra, MLGNPSR | 0.000 | 0.000 | 0.000 | 0.775 | 0.162 | 0.000 | 0.000 | 0.063 | ||
| 2 spectra, TLVPGPTGSSRPLK | 0.123 | 0.000 | 0.000 | 0.842 | 0.000 | 0.000 | 0.000 | 0.035 | ||
| 5 spectra, YCYGPQGSR | 0.128 | 0.000 | 0.000 | 0.751 | 0.117 | 0.000 | 0.000 | 0.004 | ||
| 1 spectrum, STETALYR | 0.000 | 0.000 | 0.000 | 0.901 | 0.000 | 0.000 | 0.000 | 0.099 | ||
| 1 spectrum, GAWSIPWK | 0.000 | 0.000 | 0.000 | 0.684 | 0.237 | 0.000 | 0.000 | 0.079 | ||
| 8 spectra, LEPSNK | 0.078 | 0.000 | 0.019 | 0.665 | 0.076 | 0.000 | 0.150 | 0.013 | ||
| 6 spectra, VALANR | 0.126 | 0.000 | 0.000 | 0.814 | 0.008 | 0.052 | 0.000 | 0.000 | ||
| 6 spectra, TAEDGPDLEMLSGQER | 0.000 | 0.000 | 0.113 | 0.532 | 0.117 | 0.000 | 0.239 | 0.000 | ||
| 2 spectra, GQVVTVHLQMSLENGTR | 0.063 | 0.000 | 0.217 | 0.398 | 0.302 | 0.000 | 0.020 | 0.000 |
| Plot | Mito | Lyso or Perox | ER | Golgi | PM | Cytosol | Nucleus | ||||||
| Expt B |
9 peptides |
21 spectra |
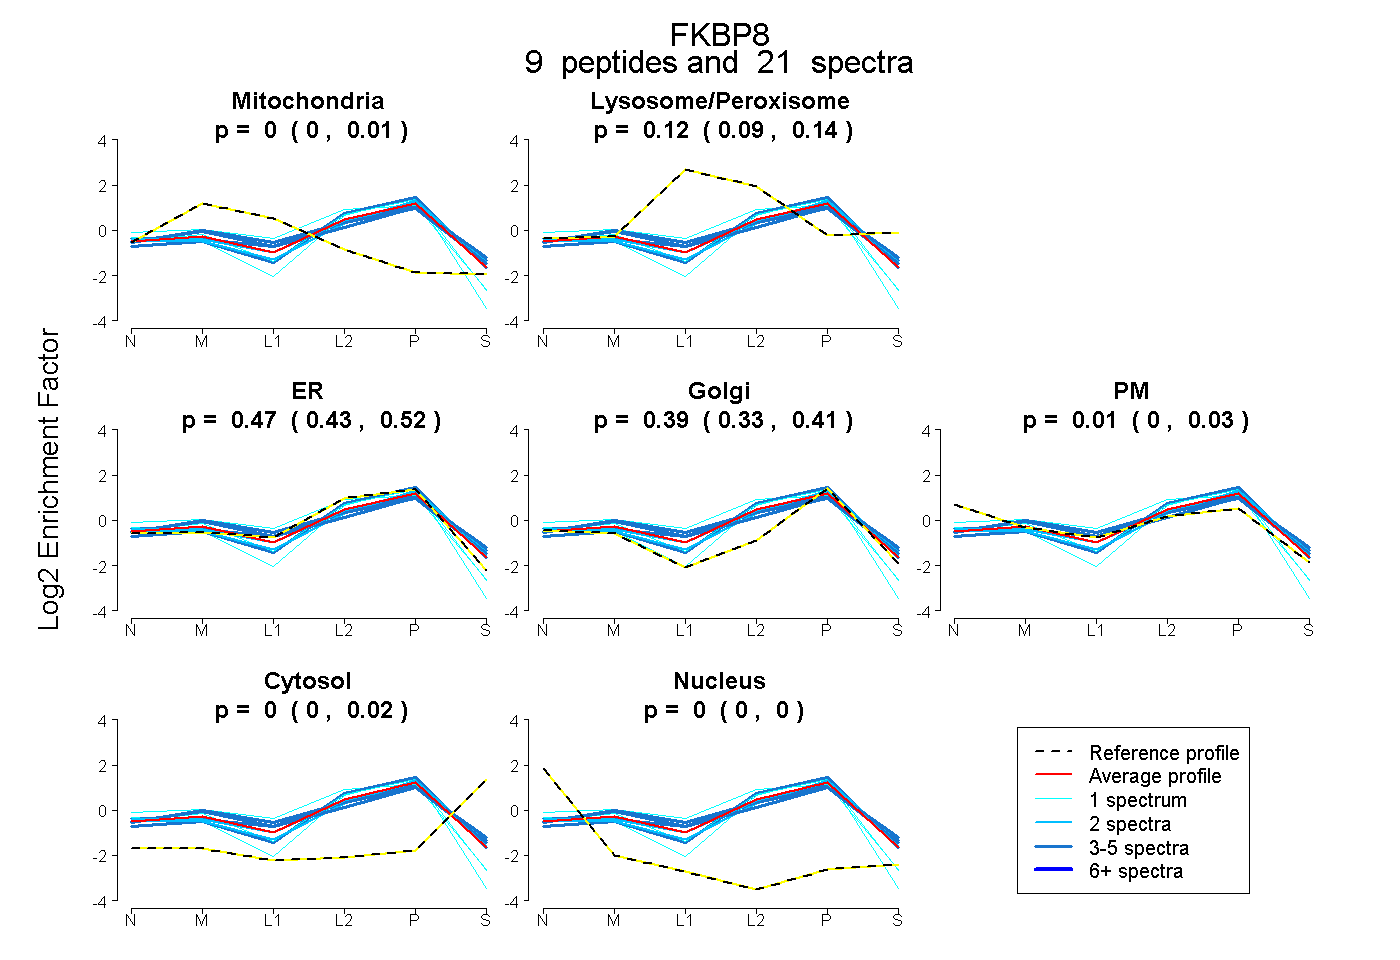 |
0.000 0.000 | 0.011 |
0.123 0.091 | 0.141 |
0.475 0.432 | 0.522 |
0.388 0.331 | 0.415 |
0.010 0.000 | 0.031 |
0.005 0.000 | 0.017 |
0.000 0.000 | 0.000 |
|||
| Plot | Lyso | Other | |||||||||||
| Expt C |
13 peptides |
99 spectra |
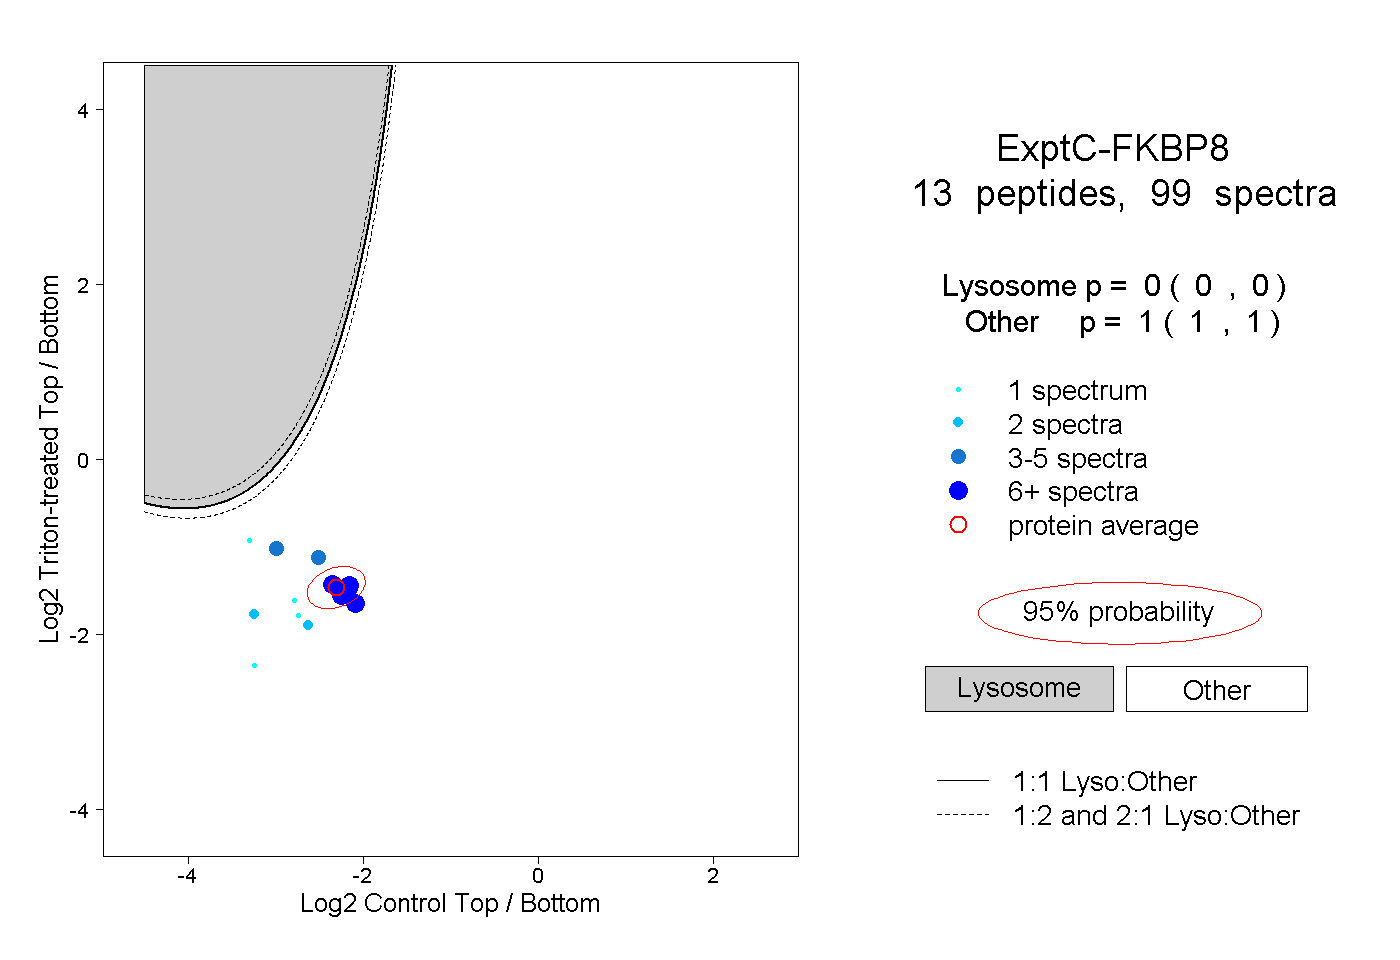 |
0.000 0.000 | 0.000 |
1.000 1.000 | 1.000 |
||||||||
| Plot | Lyso | Other | |||||||||||
| Expt D |
9 peptides |
16 spectra |
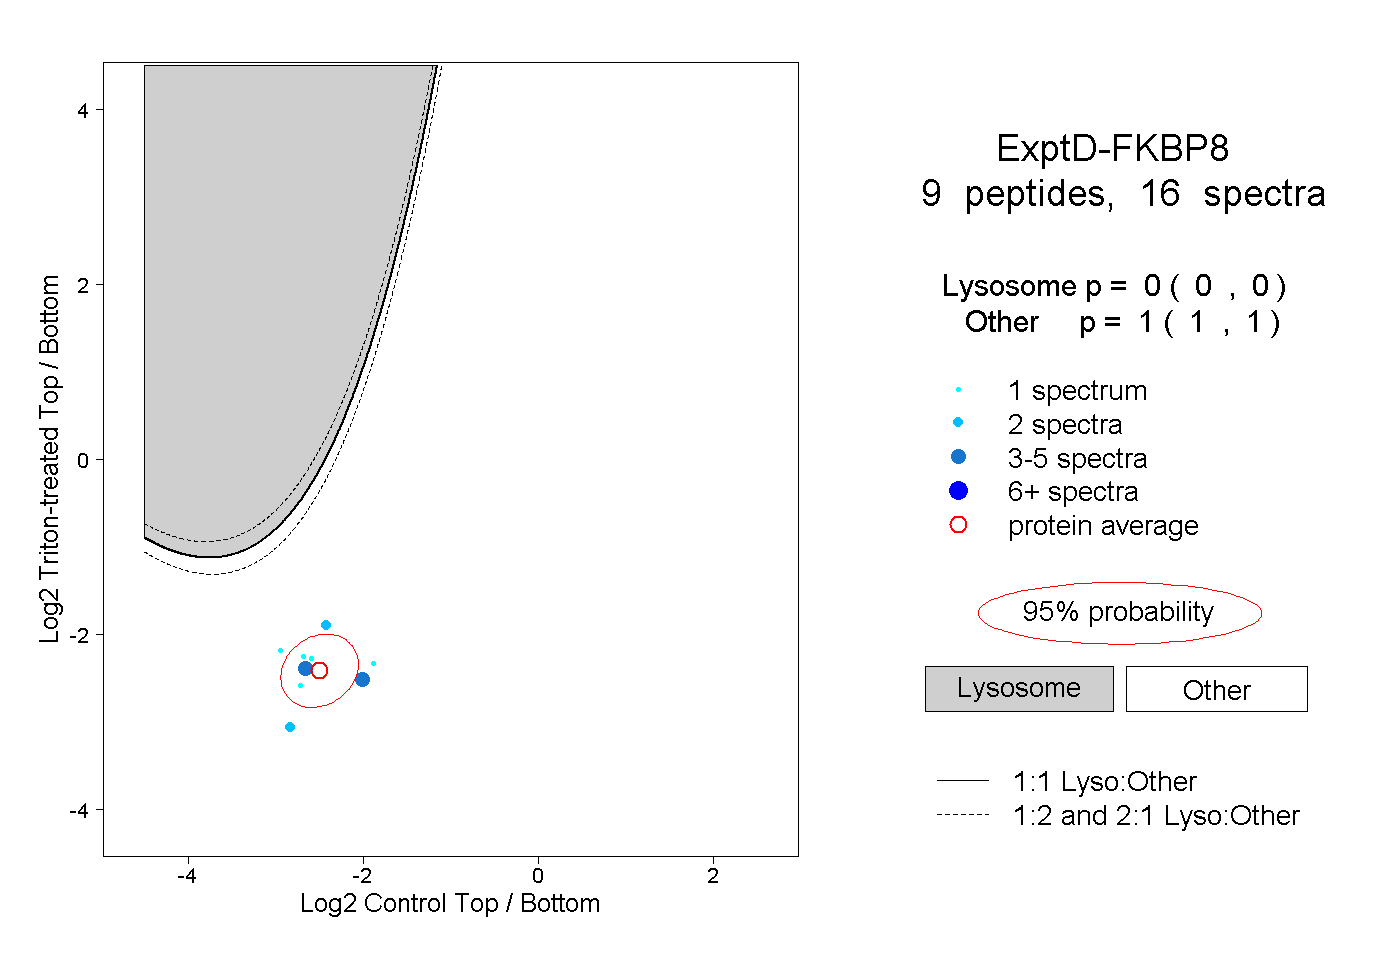 |
0.000 0.000 | 0.000 |
1.000 1.000 | 1.000 |