 6
6peptides
spectra
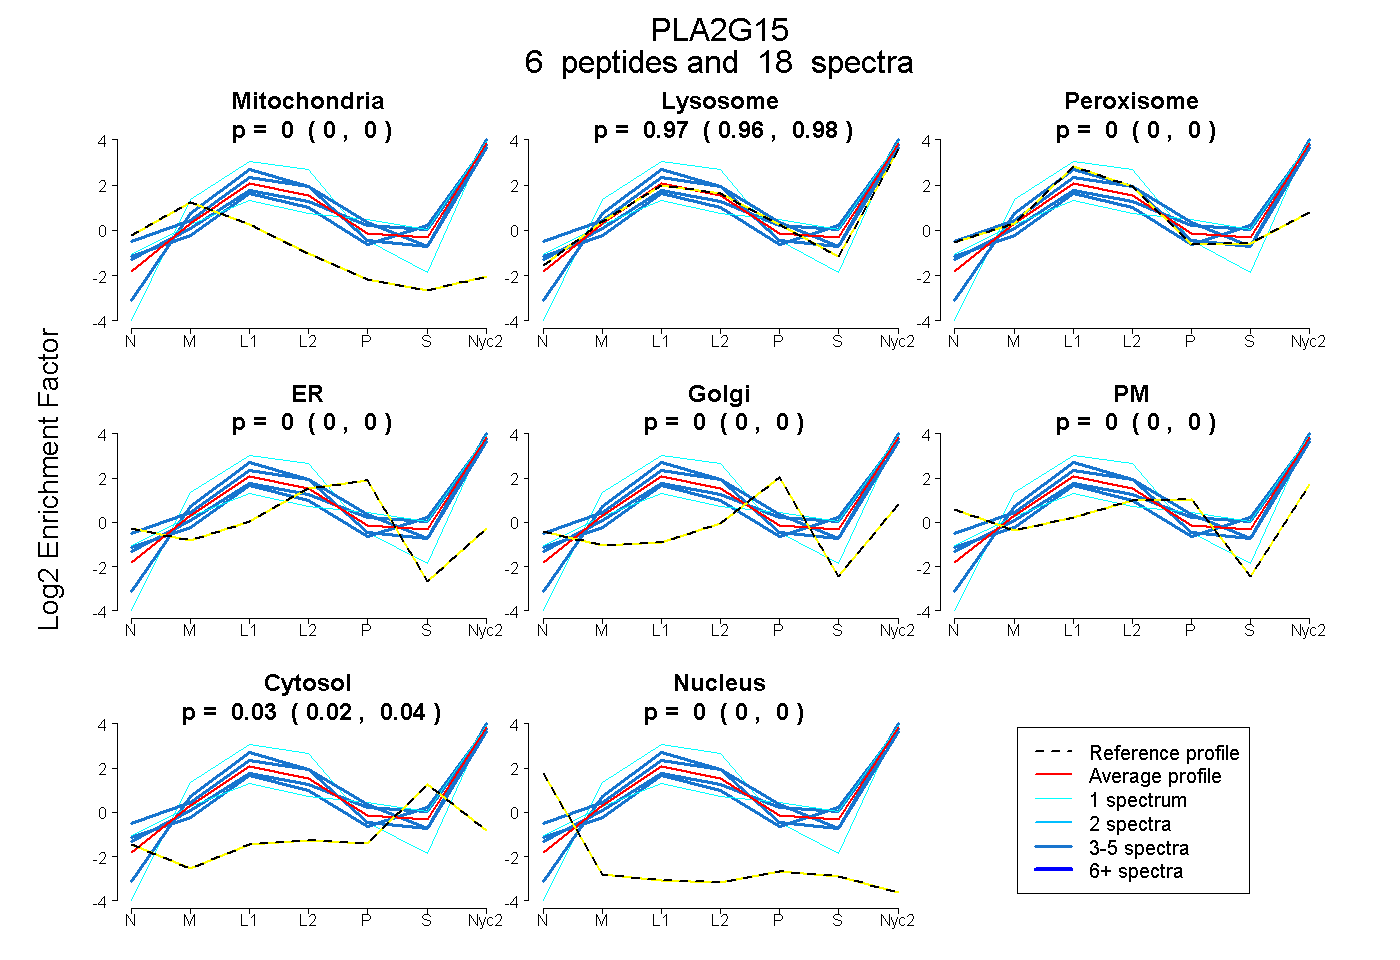
0.000 | 0.000
0.961 | 0.982
0.000 | 0.000
0.000 | 0.000
0.000 | 0.000
0.000 | 0.000
0.016 | 0.038
0.000 | 0.000
3peptides
spectra
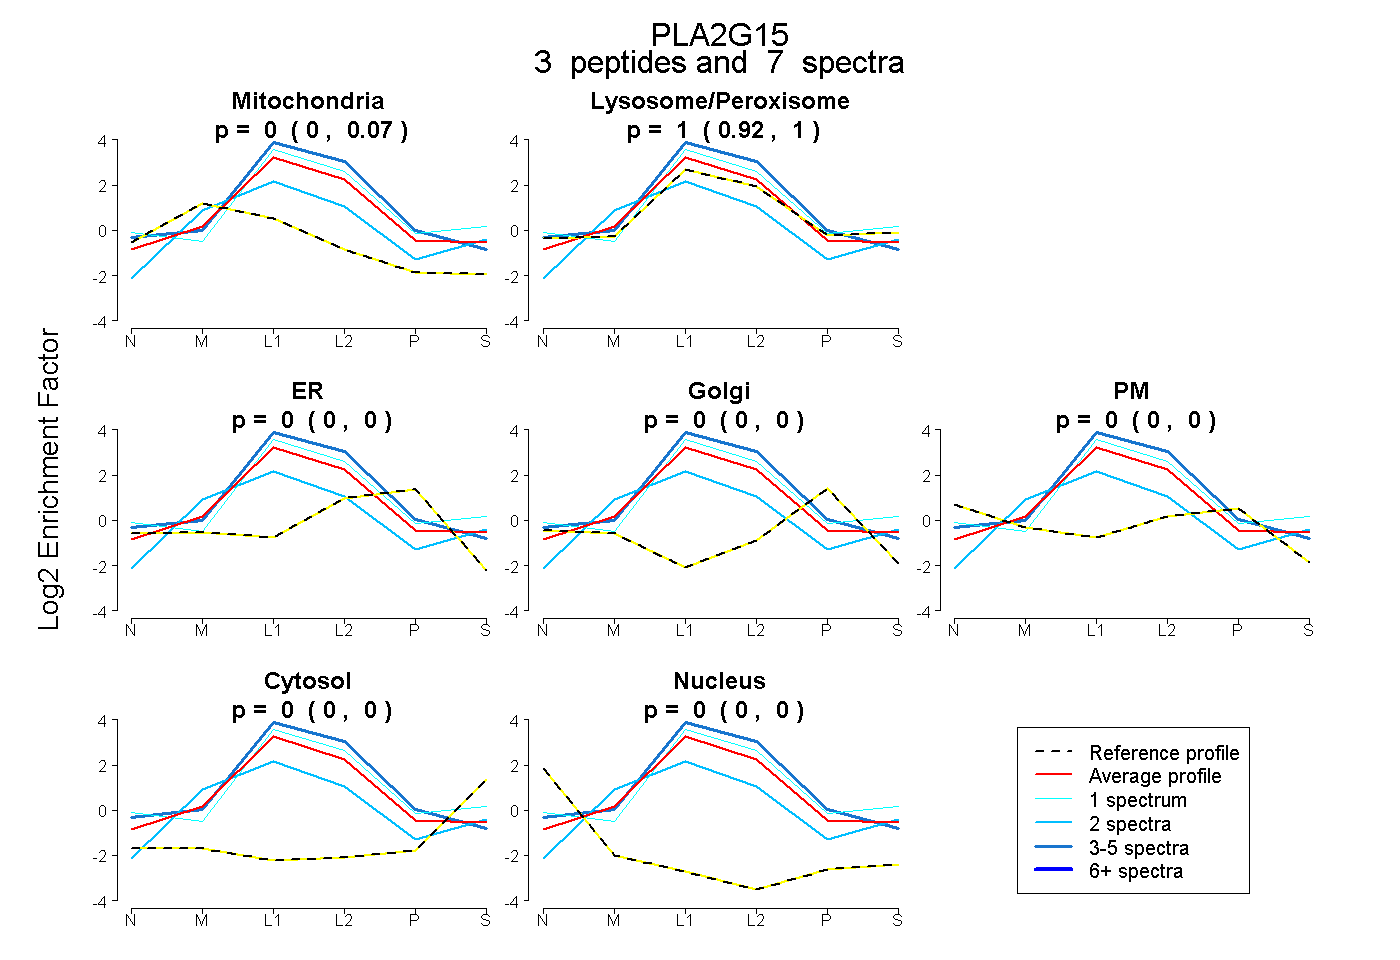
0.000 | 0.072
0.917 | 1.000
0.000 | 0.000
0.000 | 0.000
0.000 | 0.000
0.000 | 0.000
0.000 | 0.000
9peptides
spectra
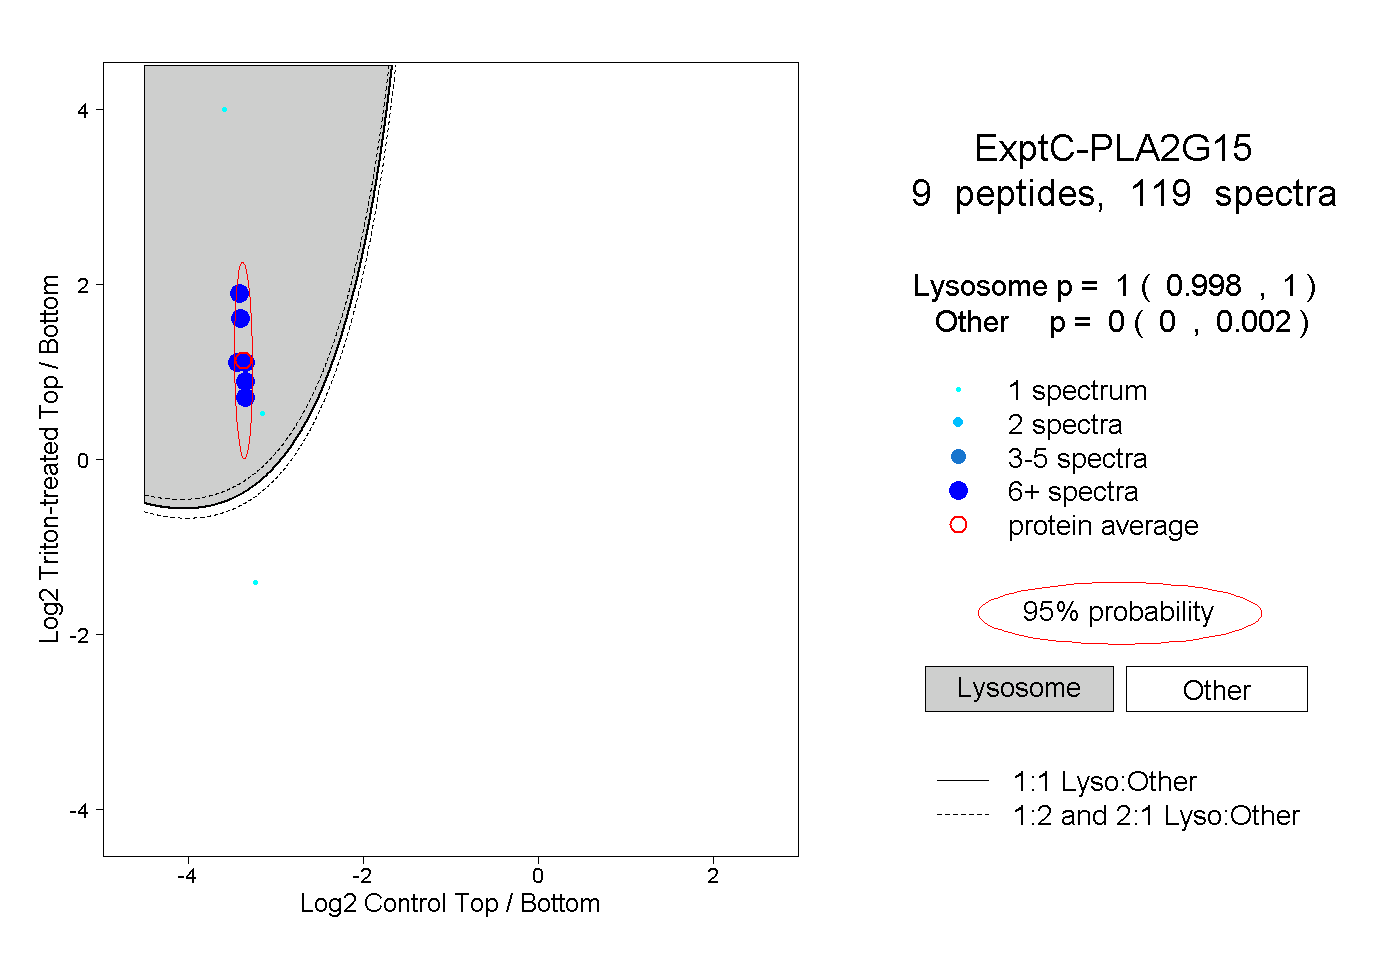
0.998 | 1.000
0.000 | 0.002
4peptides
spectra
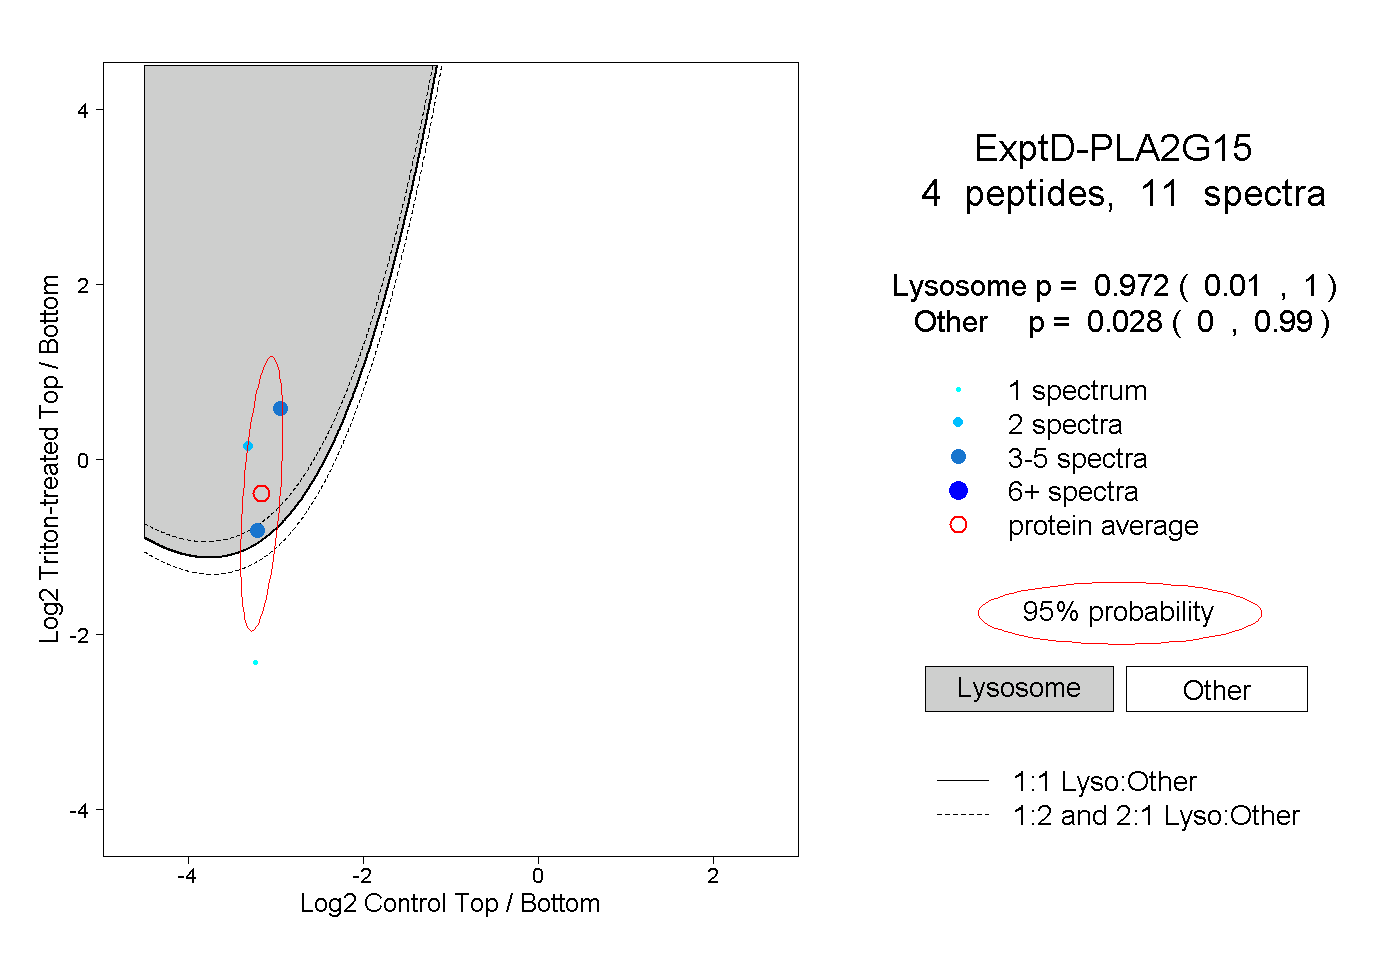
0.010 | 1.000
0.000 | 0.990